HOT GRAPH GAN
Hot Graph Gan was the intention to create and understand the patterns of the hot villages of spain. We used graphs as images in GANS to see how M.L. understands our villages and then we triend to use these new graphs as we do for real ones.
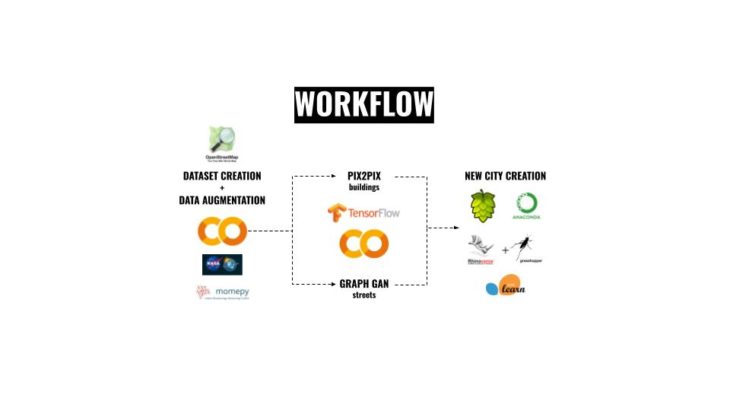
The workflow process is divided into three parts:
- Dataset Creation & Dataset Augmentation
- We build 2 GAN models:
- Pix2pix for correlation with buildings
- CYGANS for generation of new graphs
- HOPS & Grasshopper por visualizing the new cities
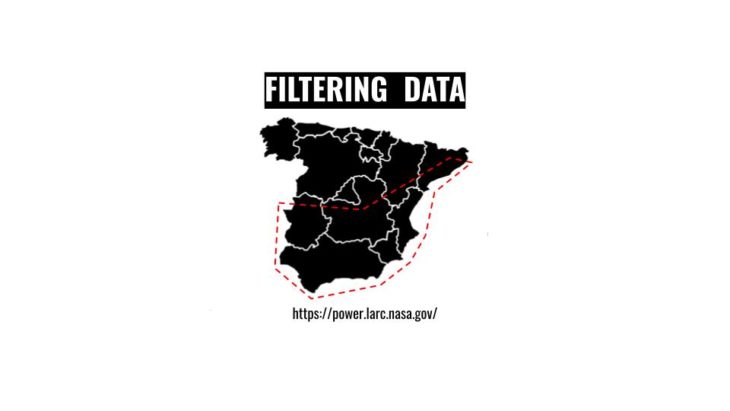
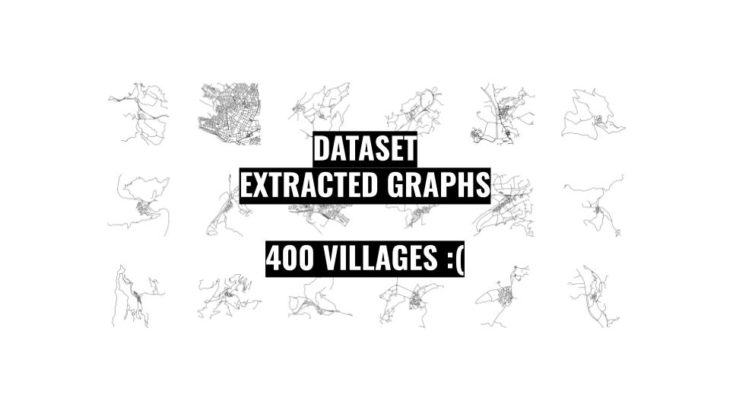
We got small villages from the hottest and driest places of Spain. We ended having 2293 villages. We only could extract 400 village graphs as it was computationally expensive.
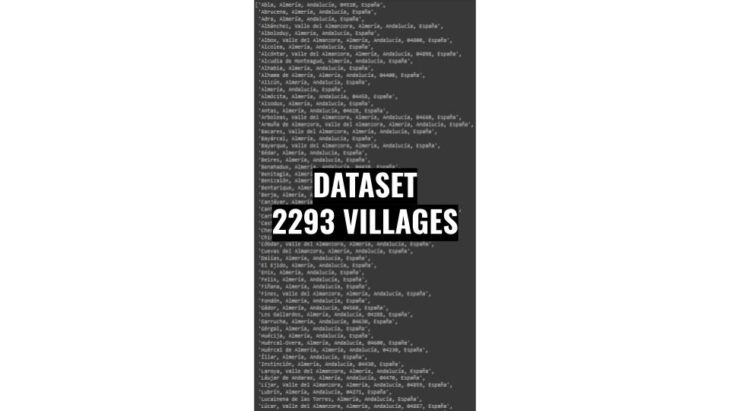
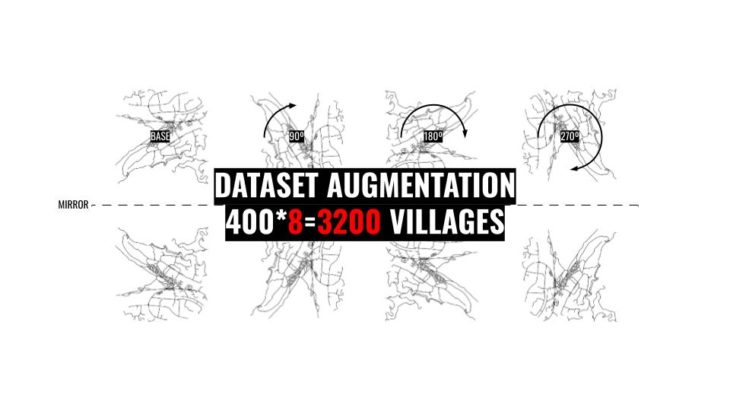
We tried to augment this dataset to 3200 villages by rotating and mirroring them. And this will be out training dataset for the GAN
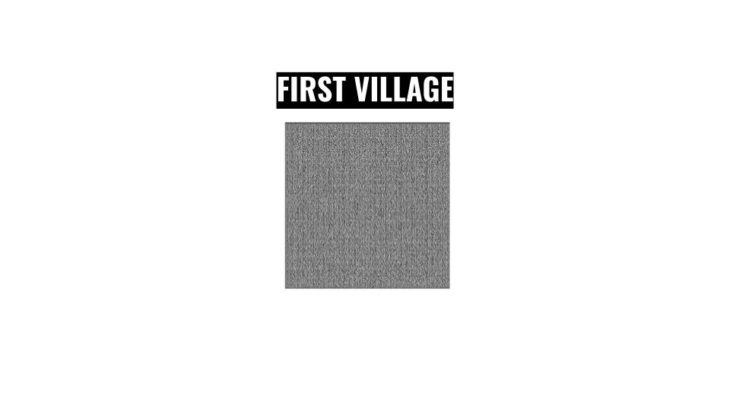
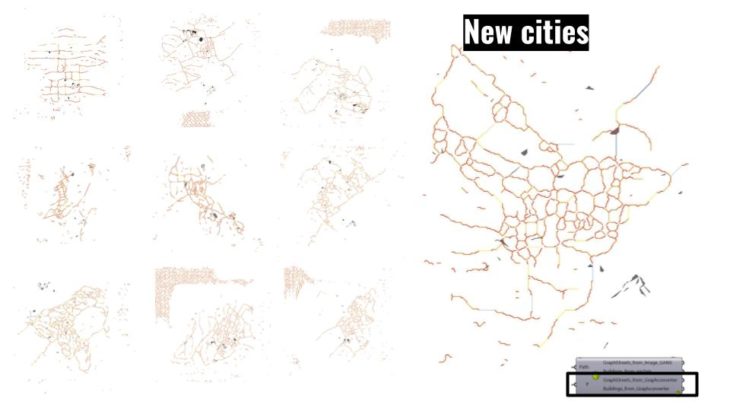
First Village was random noise. After 200 epochs it begins to try somehow understand and resemble the outline of the villages.
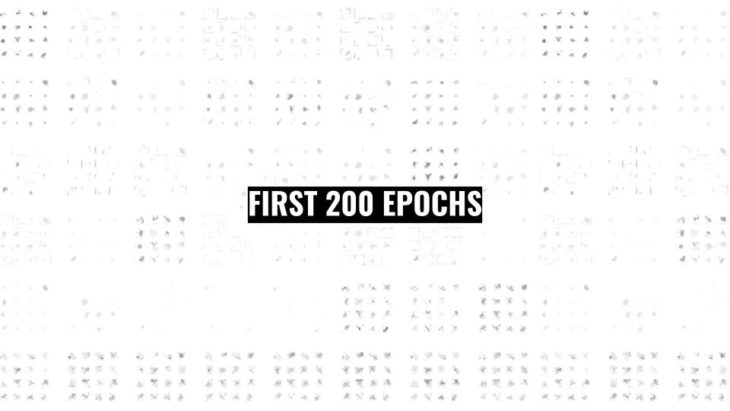
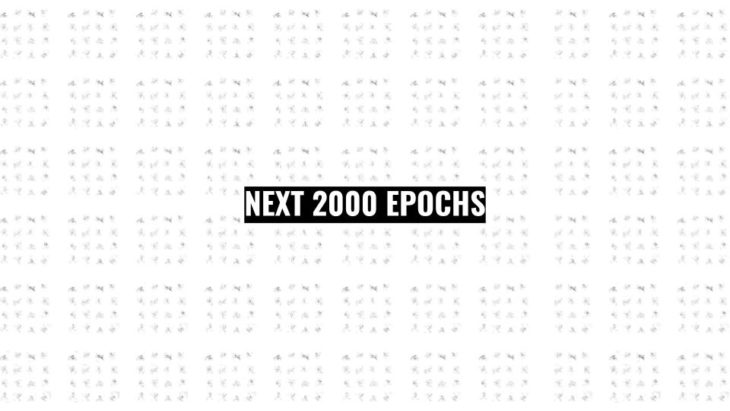
After 200o epochs you can see that this graphs are starting to be more consistent.
We ended having a model of 4.500 epochs that produced pretty decent results with a bit of noise in the perimter.
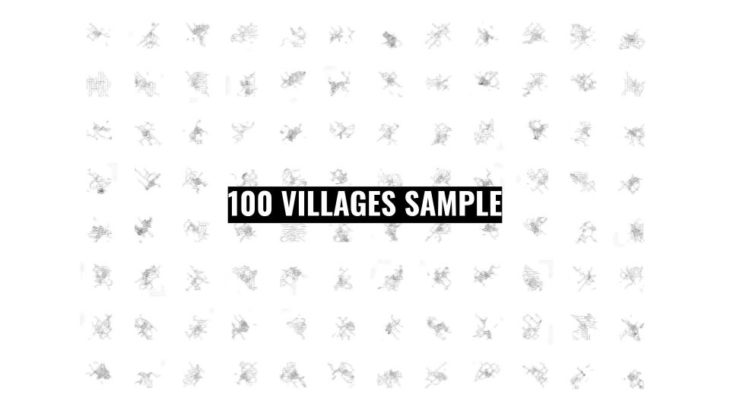
And we took 100 new village samples to explore further.
We wanted to study the correlation also between buildings and graphs. So we used OSMNX to get the boundary buildings and MOMEPY to colour them by orientation.

Then we create a dataset of 1.200 images having as the input the graph of the village and as an output the coloured buildings. We trained this in a pix2pix model to see if we are able to predict where the buildings in our new graphs will be located.
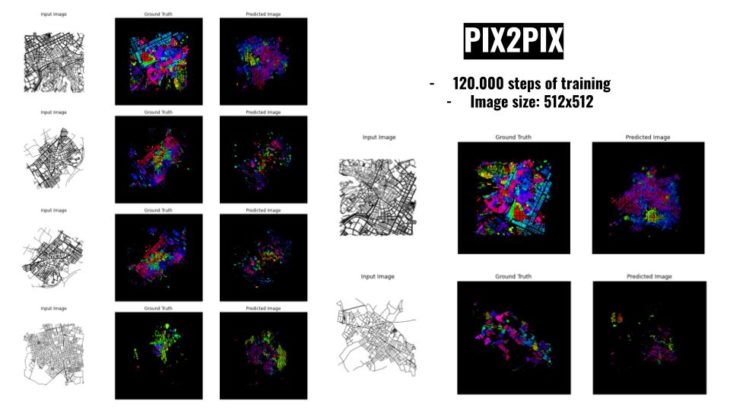
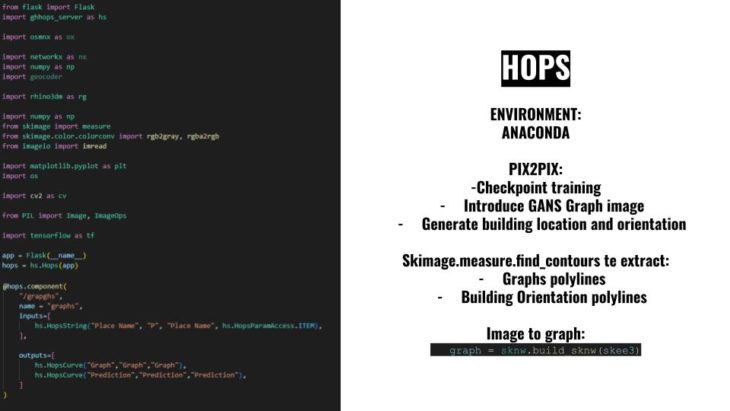
After training the model 120.000 steps, we decided to integrate both GAN models in our HOPS script and use it in Rhino to visualize and create our new small hot spanish cities.
For this we had to use an Anaconda environment because it was the only way to use OSMNX for it.
So our HOPS consists on an input that will be the image created from the first GAN and then we will have 4 outputs that will showcase our results.
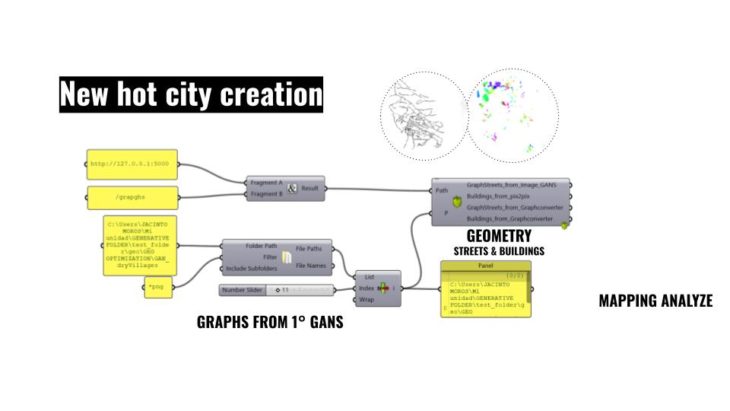
For the first 2 outputs, we can see the result of our building pix2pix prediction and also the new village graph. As it was an image we used a SKLEARN method to get the boundary lines of the geometries detected.
- The white colour represents the new graph village and its width.
- Then the buildings are represented as pixel colours. This coloures showcase the orientation of the buildings.
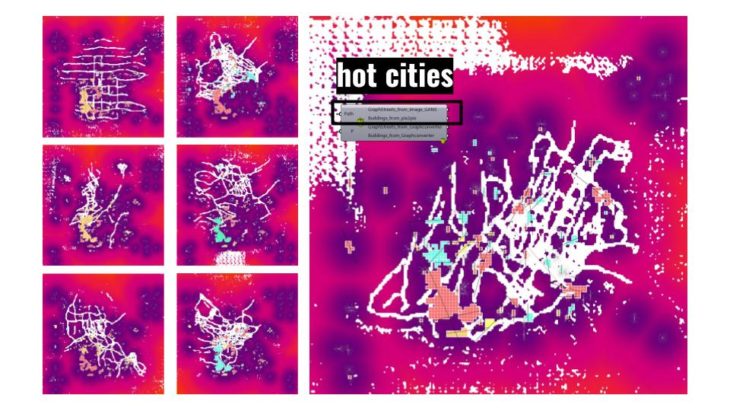
Finally. the last 2 outputs comes from the method of IMAGE TO GRAPH. So we obtain the 2 images of our 2 GANS: new graph and the buildongs. In this casse we have a more nitid graph showcasing how our new city graph would like. However, the buildings are not so wel detected.
HOT GRAPH GAN is a project of IAAC, Institute for Advanced Architecture of Catalonia developed in the Master of Advanced Computation in Architecture and Design 2021/22 by Students: Pablo Antuña & Jacinto Jesús Moros Montañés Faculty: David Andrés León and Dai Kandil