The physical computing seminar presented an opportunity to further visualize the GreenUp project, which was conceived as part of the Fab City Design Strategies studio. It proposes to install home gardens, outfitted with sensors and wifi, on the balconies of houses all over Poblenou in order to connect the residents, businesses, and community groups of that neighborhood.
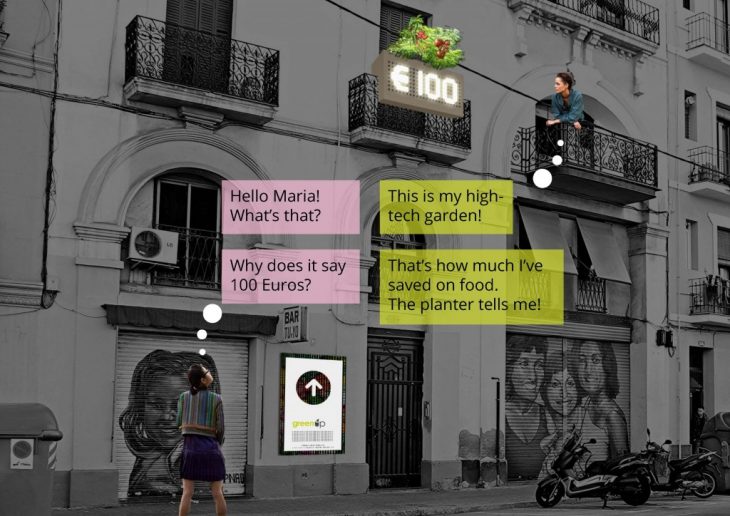
Example of one GreenUp planter.
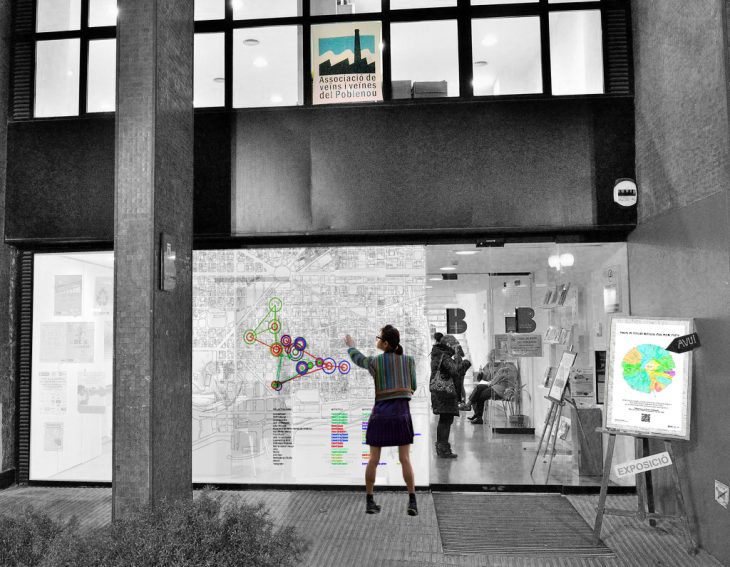
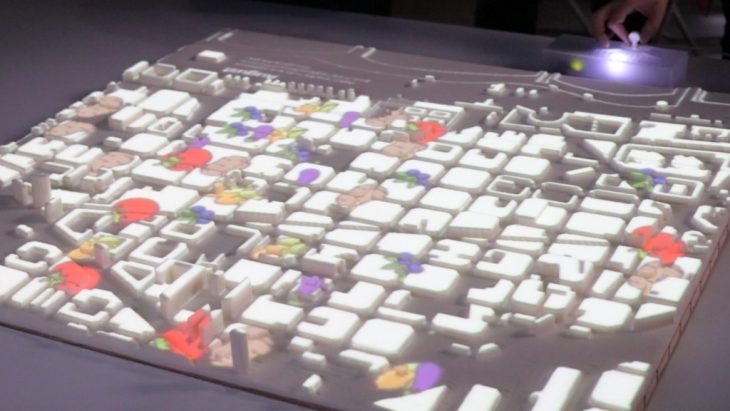
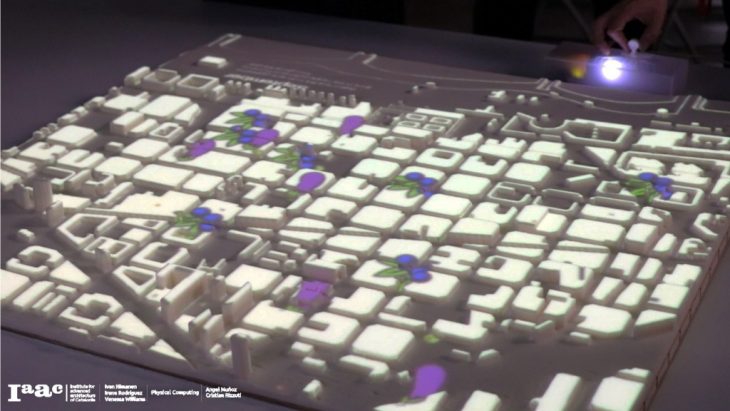
Interacting with the map at the Casal del Barri, Poblenou.
Part of this proposal is to create an interactive map which shows the data that the planters are collecting, where they are located, and what type of plants they are growing (based on environmental factors). This map can be projected in strategic locations where passers-by can learn about the project. How will this map look?
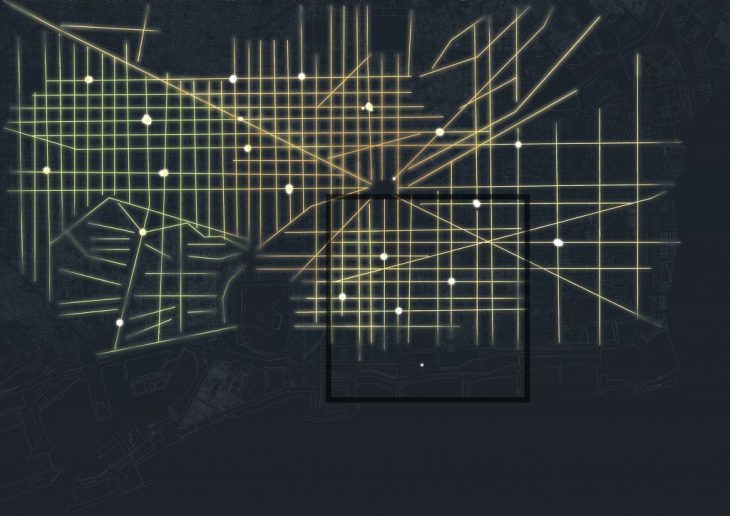
Planter as pixel, city as screen. Sketch for the GreenUp vision. Highlighted area is the Poblenou neighborhood, which was focused on for the Physical Computing seminar mockup.
Each vegetable grows under specific environmental conditions, and has a unique harvesting schedule. Several dozen locations for ten different edible plants were mapped, and a physical slider was fabricated to allow the user to explore their growth over time.
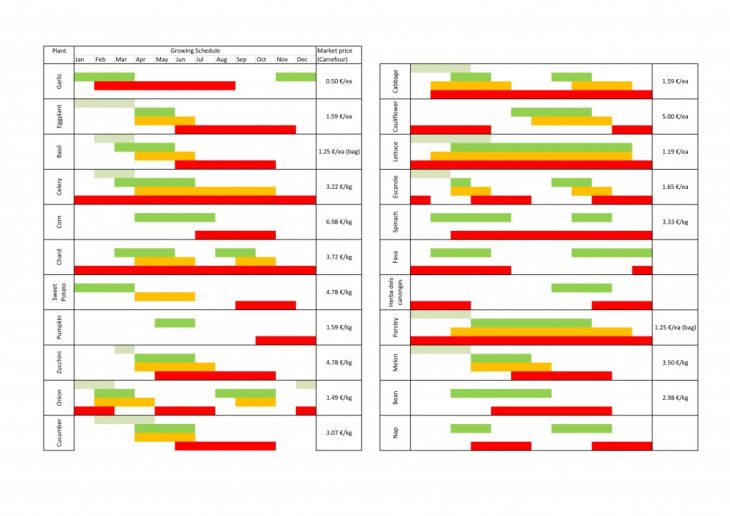
Harvesting schedule for various plants. This is the standard way to visualize this information in permaculture.
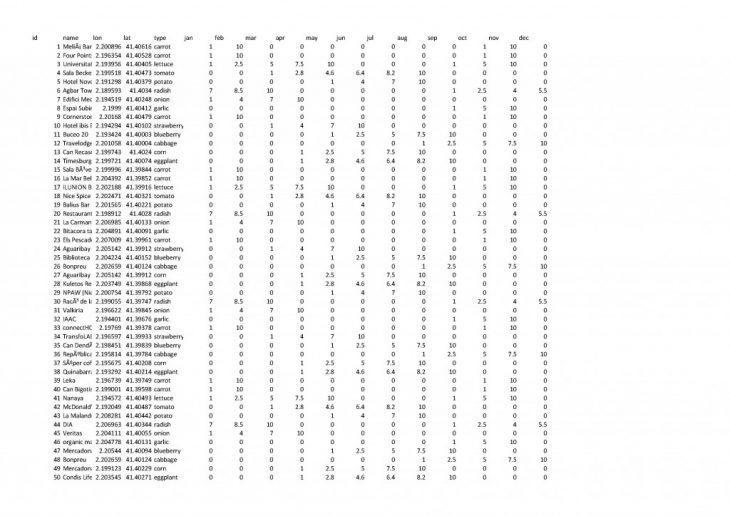
Harvesting schedule in CSV form, readable by Processing. Each row represents one planter, or one icon on the map, and includes a latitude & longitude, vegetable type, and size factor across the 12 months of the year (which corresponds to the vegetable’s harvesting schedule).
The harvesting schedule for each plant was compiled into a CSV (comma separated value) file, with time on the X axis and plant types on the Y axis. Then, an Arduino board was connected to a linear potentiometer (a simple slider). Arduino is able to read the change in resistance based on the position of the slider, convert it into an integer (between 0 and 1032) and send it as a byte to another program called Processing. Processing receives this value, interprets it as various months of the year (0 – 85 = January, 85 – 170 = February… 950 – 1032 = December) and draws an icon of each vegetable at each designated location, with a different size according to the vegetable’s harvest schedule that month. The data which tells the Processing code at which size to draw the icons is stored in the CSV. The data flow looks thus:
INPUT (potentiometer) –> Arduino –> byte value –> Processing –> conversion from 0-1032 to 0-11 –> reading CSV according to conversion –> OUTPUT (vegetable icon & size)
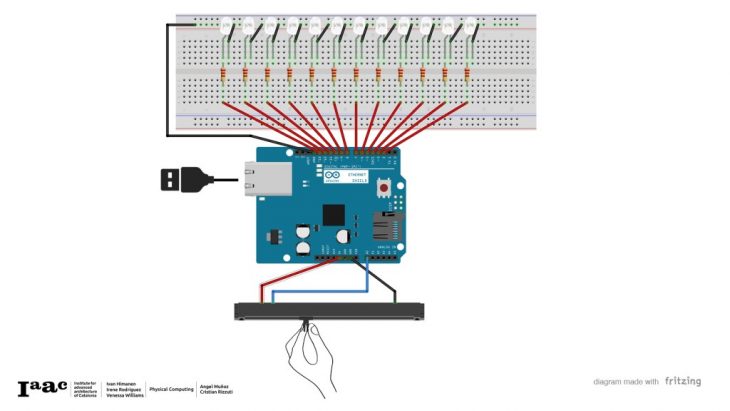
Arduino circuit diagram.
Typically, Processing and Arduino send and receive bytes at a rate of 9600 bits per second. For this project, in order to increase responsiveness, the bitrate was increased to 115,200.
All of the hardware was fit into a console (a simple box made of laser-cut acrylic). The only requirement is that the console be connected via USB to a computer that has the Processing code. In this case, the visualization was projected onto a site model of Poblenou which was CNC-milled of high-density foam.
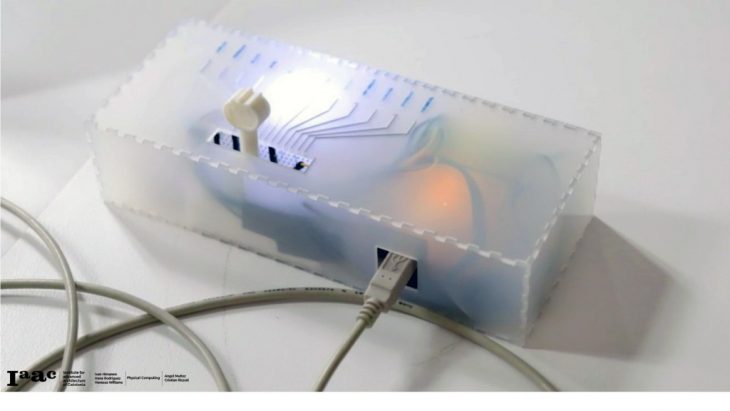
Interactive Console, containing Arduino, potentiometer, and LED array.
With a few modifications, the same visualization can be projected onto glass, using hand movements or touch instead of a potentiometer. The use of large, colorful icons also makes the visualization playful. Adding this physical dimension to a project is a great aid in sharpening the narrative and encouraging interaction with anyone unfamiliar with the underlying data.
The final mockup, August.
The final mockup, September.
–
GreenUp Mapping – Poblenou is a project of IAAC, Institute for Advanced Architecture of Catalonia, developed at MaCT (Master in City & Technology), 2017-18 by:
Students: Ivan Himanen, Irene Rodriguez Vara and Venessa Williams
Faculty: Angel Munoz, Cristian Rizzuti