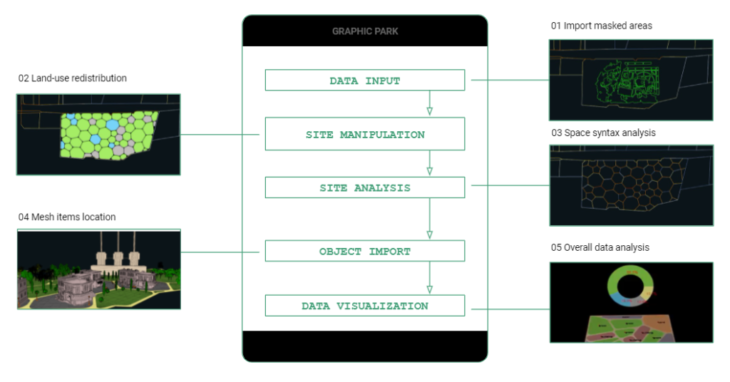
GRAPHIC PARK
</p>
CONTEXT
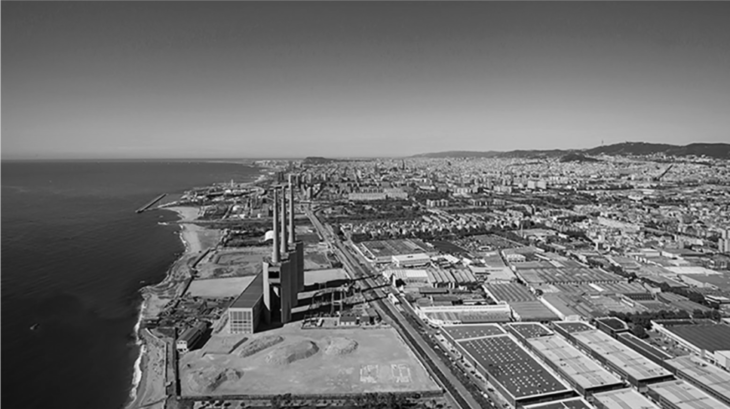
Image of “Les Tres Xemeneies”, located in Sant Adria del Besos. The city of Barcelona is in the background. Source: La Vanguardia
We started with contemplating how sensing could change the way we engage with this site, The three Chimneys in Sant Adria del Besos. This area of Sant Adria has been linked to having a high percentage of criminal activity.
You could argue that this is due to this area being disconnected to the urban fabric of the Metropolitan area of Barcelona.
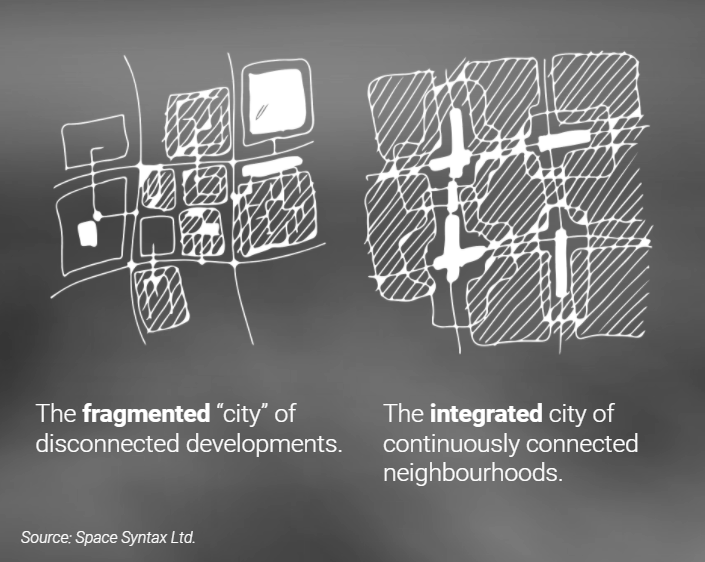
We wanted to understand what the principles are to improve the safety of a given area.
Space syntax theory supports the argument that a grid of streets or paths designed to be well connected, will yield a natural surveillance. An urban area that is based on continuously connected neighbourhoods, with green streets being a good example of an urban design feature, accommodates both economical and ecological wealth for the city. It can make an area that is segregated, into one that is more integrated and safe.
STATE OF THE ART
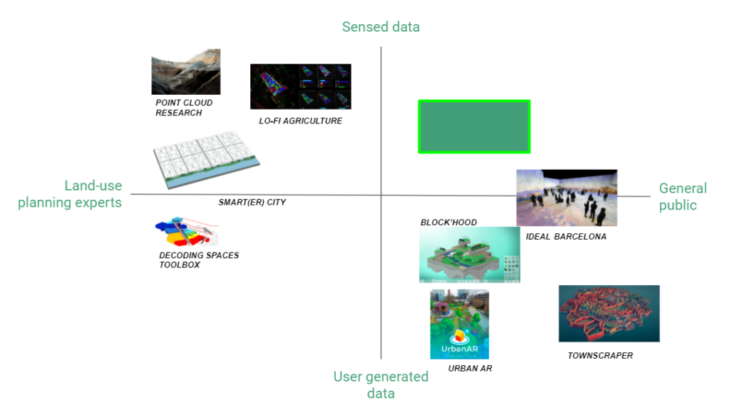
We wanted to make a tool that would allow citizens and neighbours to design urban, site-specific interventions, in a playful way. A scan of urban design tools out there gave us insight into what approach may add most value.
There are few tools that take sensed data from an urban area, and present it in an accessible way to a general audience. Sensed data design tools are almost exclusively used by urban design practitioners, both because of the technical demands of managing large volumes of data, and because knowledge needed to interact with these multi-disciplinary practices.
VALUE PROPOSITION
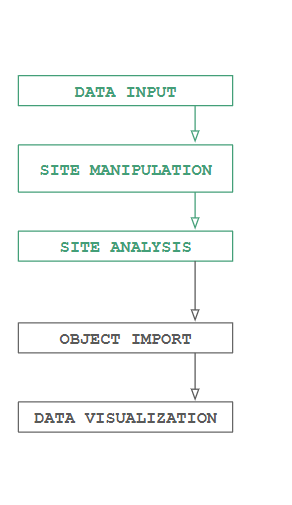
APPROACH BREAKDOWN
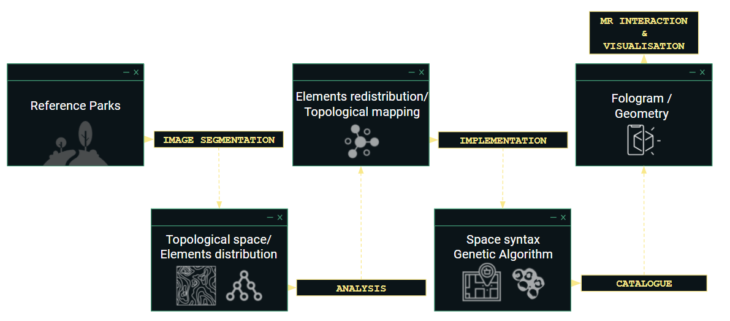
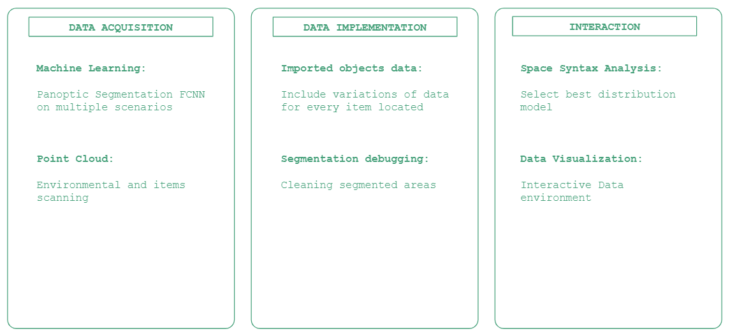
DATA ACQUISITION

IMAGE SEGMENTATION
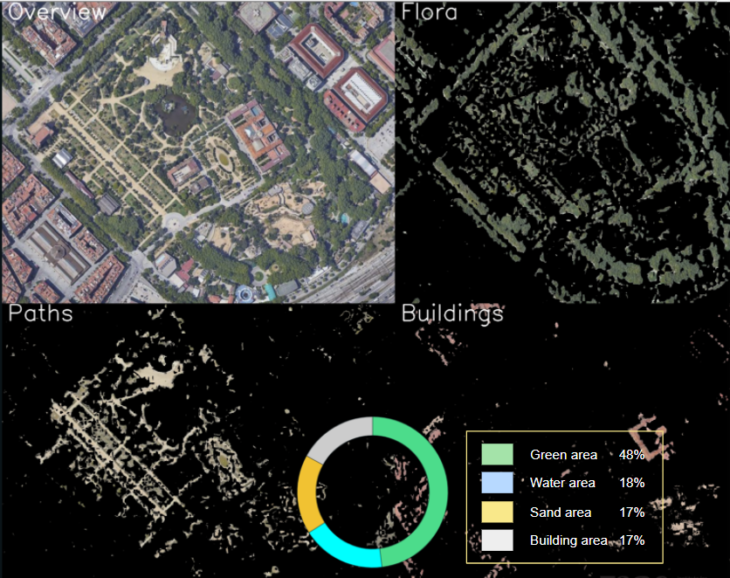
The first step in the process is to extract data out of the satellite images by segmenting these in different classes. The separation is done with different approaches: Manual-, Semantic- and Color Segmentation. In the Manual segmentation the masks are made by hand and colored with photoshop. The other two approaches are more interesting.
Semantic Segmentation
This method is a way of using machine learning to train a model which will detect different items and put them in different classes to create masks. The work flow is the following:
- On the website makesense.ai different pictures of parks will be uploaded and masks will be drawn manually as seen in the GIF. Instead of using a large amount of pictures, here a large amount of items is marked. Each picture contains 100+ marked items.
- With the masks downloaded, the model can be trained. This is done by a python code running on Tensor Flow. Running this 15+ hours on the CPU, 54 epochs are being made.
- With the trained model a validation code is ran on other satellite images. Unless all the trained items in the pictures, the validation code could not detect new items.
The conclusion of this image segmentation is that a bigger data base is needed for a good outcome. This can either be a self trained model with much more pictures manually segmented or an existing trained dataset.
Color Segmentation
A third approach is color segmentation using OpenCV in Python. With this method the pictures are converted into HSV pictures and the classes are specified to certain color arrays. Because the different classes have very different colors than each other, this color segmentation makes clear masks which can be used to segment the satellite images.
DATA IMPLEMENTATION
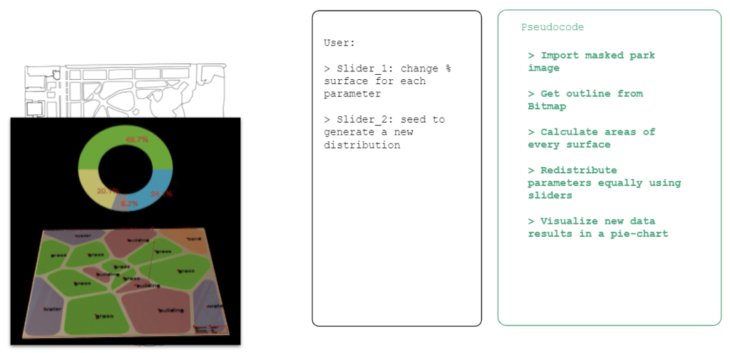
Once we had masked satellite images into different classes, we wanted to allow users to change the size of the masked shapes and/or redistribute them on the site.
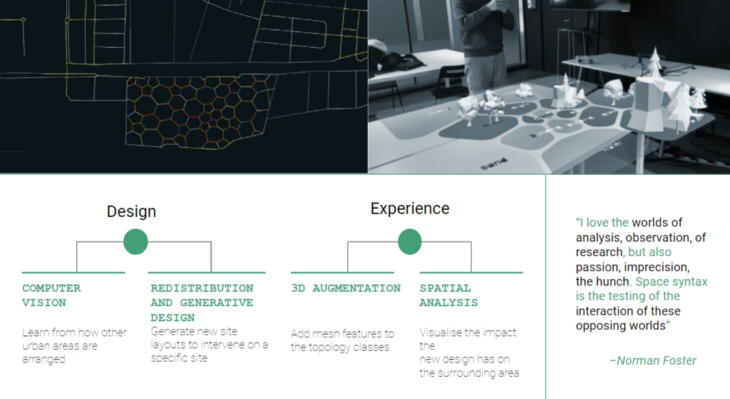
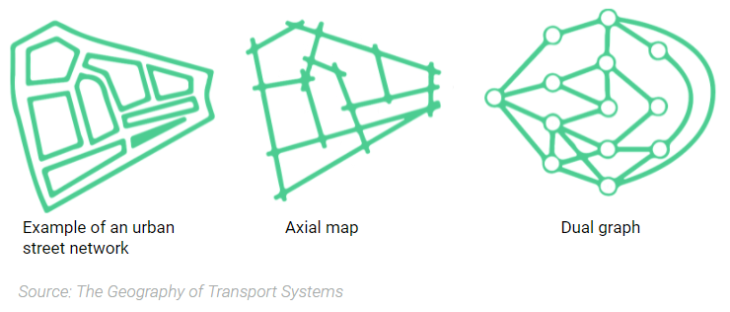
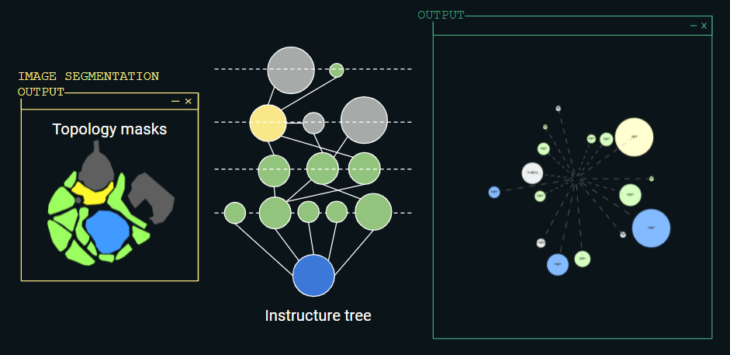
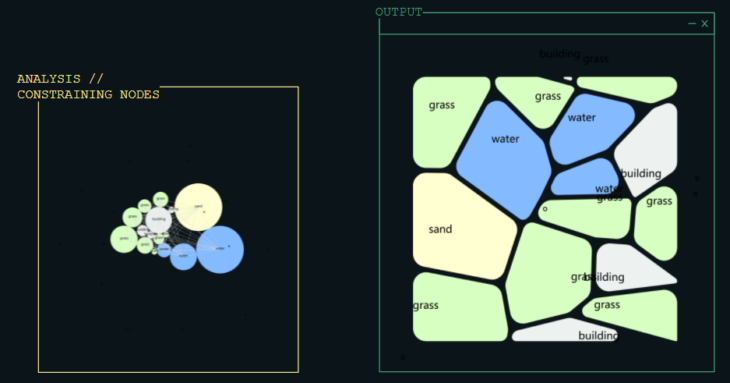
Using a Python script in Grasshopper, we applied space syntax to establish the relationships between masked shapes – in this case, known as nodes. The building principles of space syntax –connectivity, integration, and choice– on an urban street network are usually illustrated through an axial map. The theory itself is rooted in graph theory, and can also be represented as a graph tree.
TOPOLOGICAL SPACE – ELEMENTS DISTRIBUTION
ANALYSIS
Contoured infographic of integration of the site and its surrounding street network
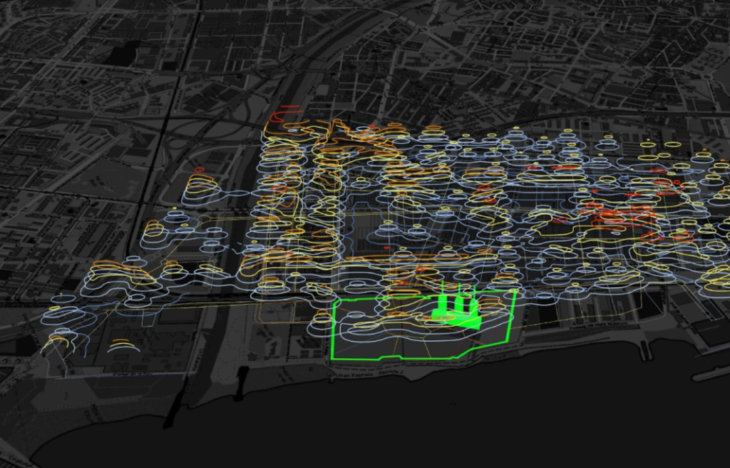
Space syntax analysis of the surrounding area overlayed as contoured clouds
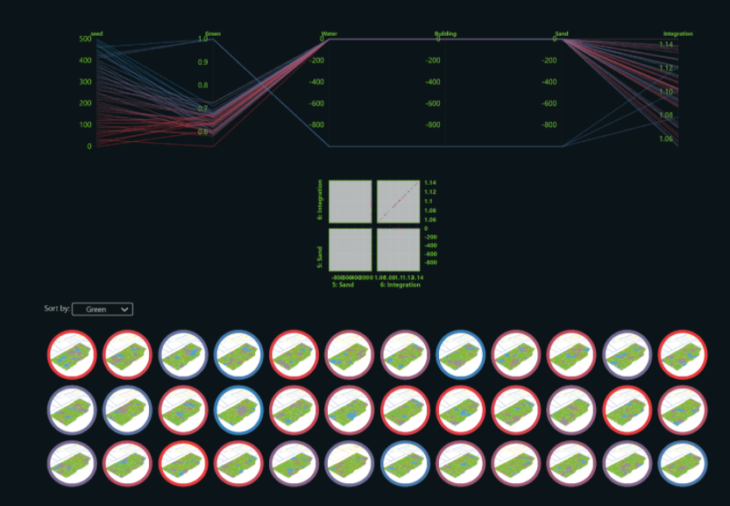
Best model selection
MIXED REALITY
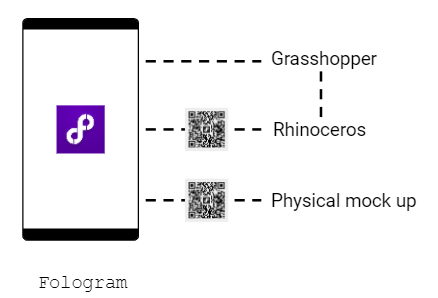
We used a mixed reality tool called Fologram to generate an interactive user experience and a simple interface merging both physical and digital scenarios to redesign our new park.
This tool is a software and application that can easily be integrated into our Rhinoceros model and our Grasshopper program using a mobile phone or a tablet with internet connection.
We created interactions, selected in a simple menu, that would help to change the parameters percentage in land-use or locate specific items from a library to design the new virtual park to finally observe the different data outcome compared to the initial version of the park.
PROTOTYPE
OVERVIEW
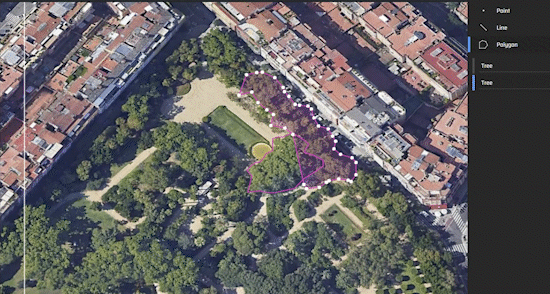
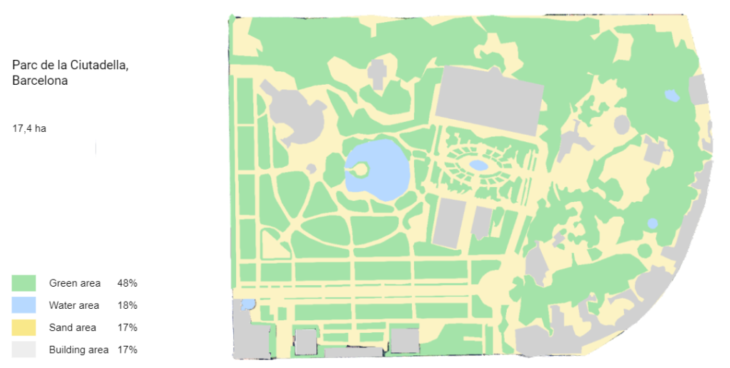
The location chosen in our study case is the Parc de la Ciutadella in Barcelona. This scenario includes not only the 4 elements as parameters in our digital interactive project but also many different space uses and connections that can be easily transferred to our landmark location.
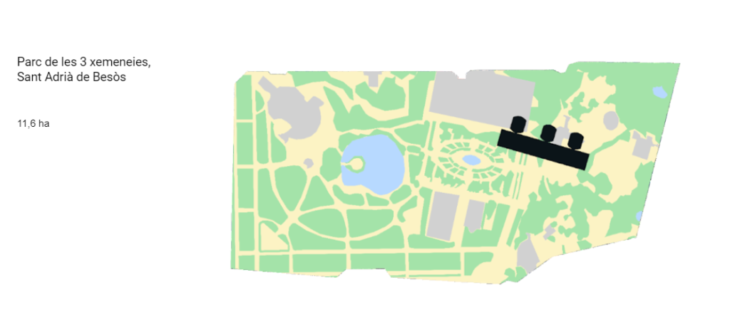
The original size of the Parc de les Tres Xemeneies will crop the outline of the Ciutadella Park as well as fix the three chimneys original location as shown in the map below:
HOW IT WORKS
INTERACTION ELEMENTS
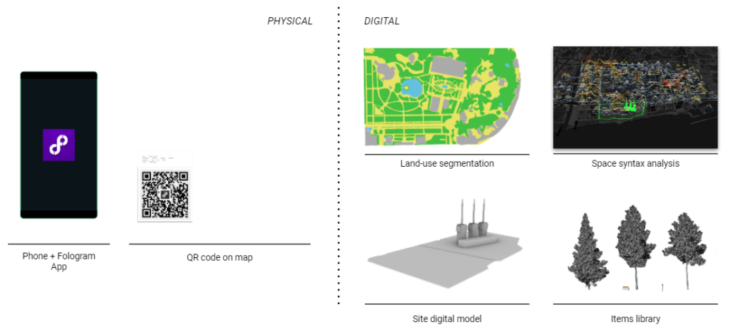
The interactive process includes physical elements that the user will work with as a mobile phone or tablet with internet connection and the fologram application, and a qr code snapped on a specific surface or canvas model to project the virtual elements on top of it.
The digital elements will include the segmented image and its space syntax analysis map on one side, and the digital mesh models of the location or environment and the library of items that will be located on the redesigned space.
INTERACTION BREAKDOWN
The interaction flow that the user would go through along the entire process would start by importing the masked areas obtained from the image segmentation, followed by a phase to redistribute the areas generated, to later obtain a space syntax or movement flow between the redesign space, where finally all the desired items should be placed to define the final overall data analysis of the new virtual park.
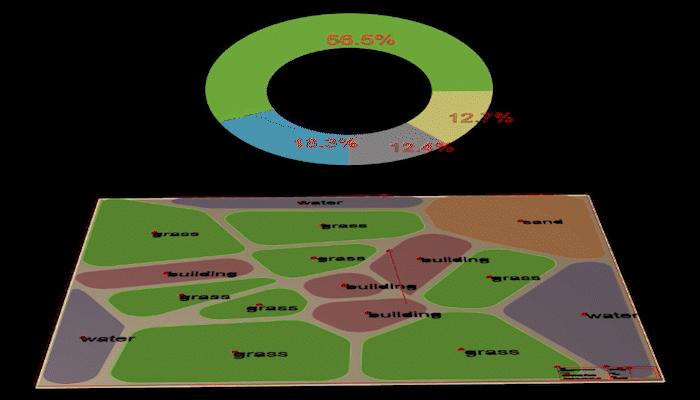
LAND-USE REDISTRIBUTION
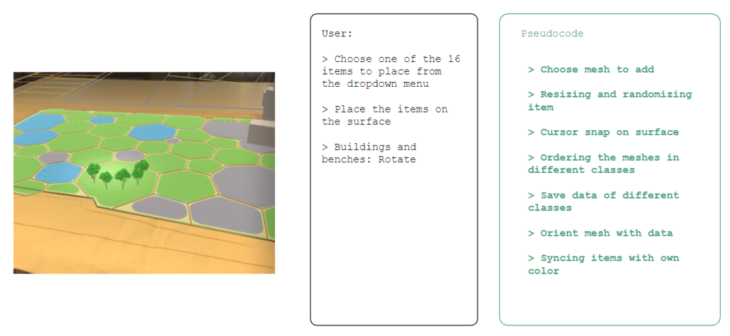
ITEMS LOCATION
For the user the item location is done in Fologram. Here it scans the QR on the mockup and the chimney area will pop up with the park segmented colors on it. The user has a drop down menu where it can choose the item to place; trees, palms, rocks, buildings and other city items. A red cursor will be shown where the item will be placed and by one click; the item is placed. For the buildings and benches a rotation option is also available for putting it in the right direction. The other items will have a random rotation and a slight random size offset to make the items look different from each other. There is no limit in how many items are placed and in a few minutes the user can create a full park.
FINAL RESULTS
</p>
FURTHER DEVELOPMENT
INTEGRATION – WEBAPP
The workflow for this project allowed us to discover different features relevant to introducing urban analytics to a generative park design experience. Moving forward, we would like to integrate these features into a more intuitive AR experience.
EXPAND DATASET

Adding different parks around the world, and prioritising the design characteristics of the user’s favourite ones.
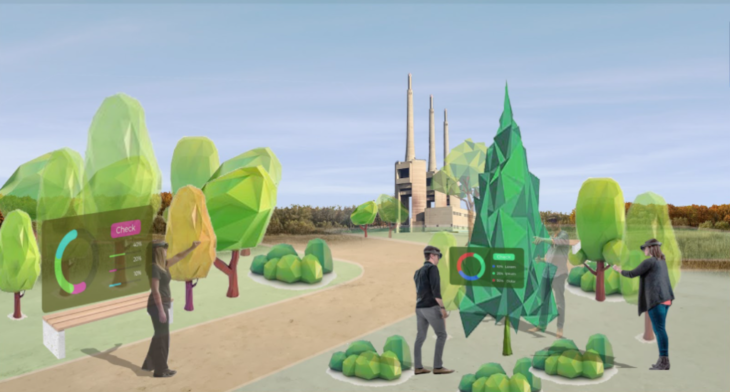
Render of users using the app, in an augmented reality context, at the specific site to redesign.
FURTHER STEPS
Some steps beyond that we found interesting to take into consideration as project’s outcome insights are the following:
GRAPHIC PARK is a project of IAAC, Institute for Advanced Architecture of Catalonia developed at Masters in Robotics and Advanced Construction, in 2021/2022
Students: Huanyu Li, Alberto Martínez, Vincent Verster, Jordi Vilanova
Faculty: Aldo Sollazzo, Keith Kaseman
Faculty Assistant: Oriol Arroyo, Maria Espina