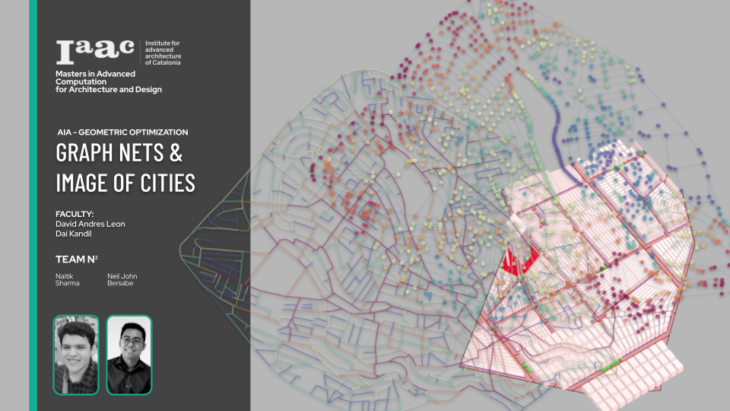
GRAPH NETS & IMAGE OF CITIES
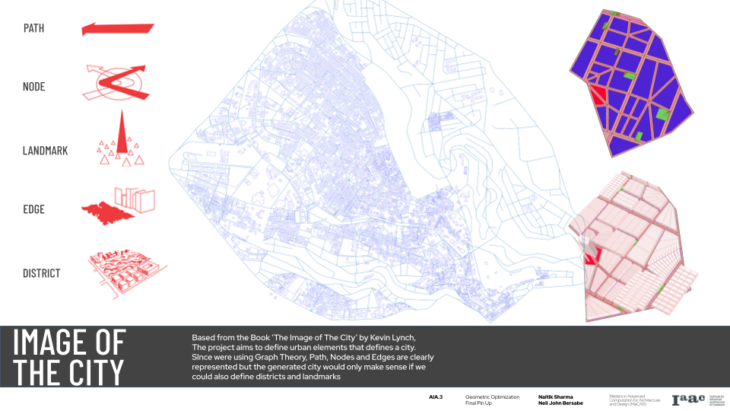
Our project named Image of the City is based from the the book written by Kevin Lynch, that describes how individuals perceive and recall features in urban spaces., and he defined 5 distinctive elements in the urban landscape and categorized them as Paths, Nodes, Landmarks, Edges and Districts. Since were delving into graph theory and to make sense of our artificially generated city and not just mere nodes and edges the project aims to define districts and landmarks., features that give more sense and value to our generated cities.
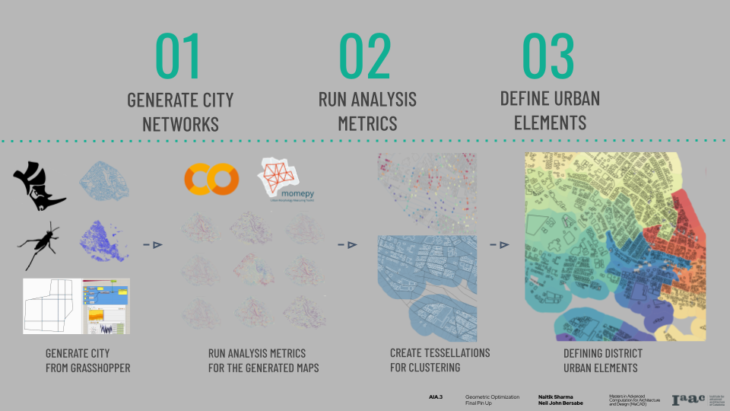
So for our whole design process we started by generating our city from grasshopper, then we brought this into colab as dxf’s and used momepy to analyze different urban metrics, Next we generated tessellations for clusterings and then finally used the data to define districts as urban elements
01_GENERATE CITY NETWORKS
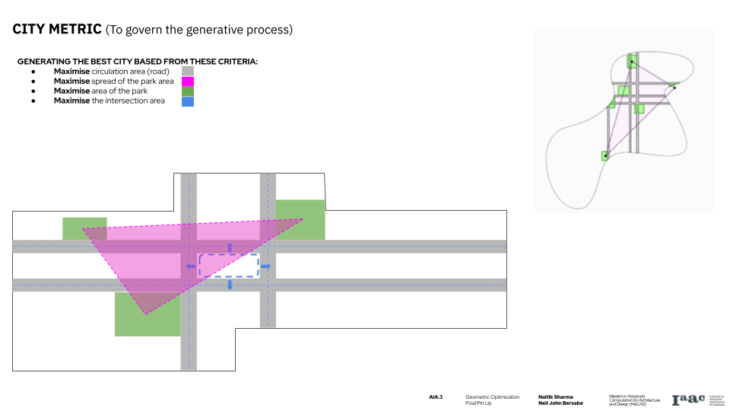
Before starting with the generative process we needed to define few metrics for the city that will govern our design and give us the best performing city network. The metrics defined were circulation area, intersection area, park area and the spread of park area.
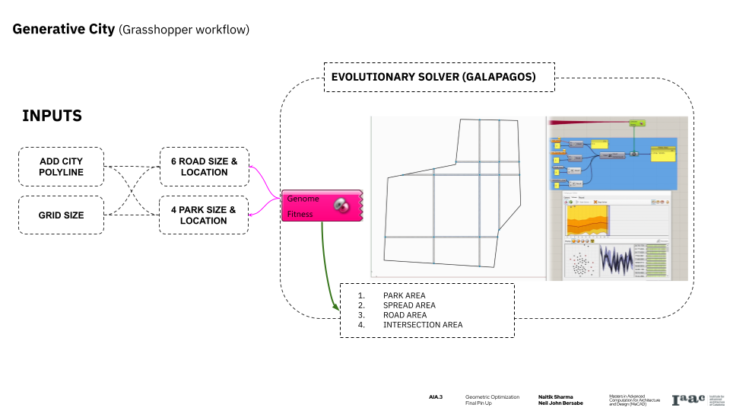
After defining the city metrics we started with the generative process. For inputs we needed city polyline and a grid size. Next we supply the inputs to create 6 roads 3 horizontal and 3 vertical and 4 parks. We create parameters for controlling the location and size of the roads and parks. These parameters went as Genome to galapagos the evolutionary solver, and for fitness criteria we took the summation of the park area, spread area of the parks, road area and intersection area and applied it for maximising the results.
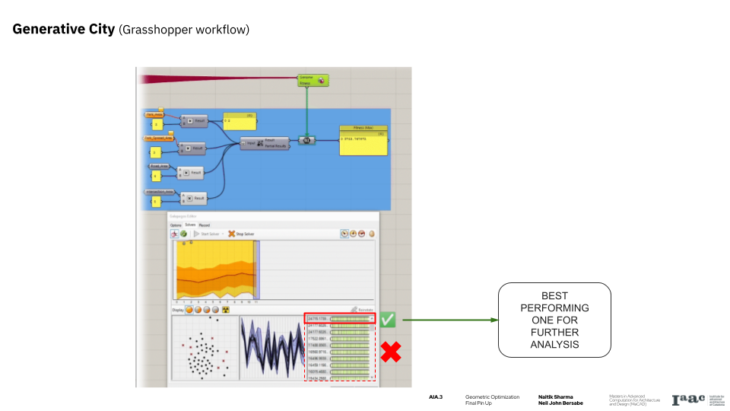
After this, we took the best performing one on given by galapagos and supplied it to the city generator plugin for further creation of road network.
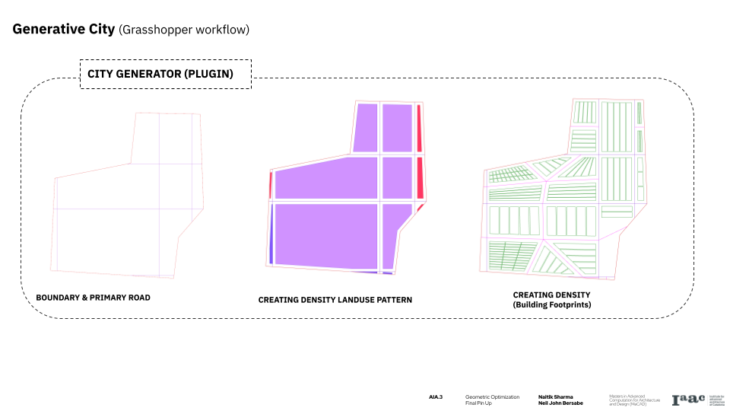
We supply in the city polyline and and the road network we got and define few more parameters for creating the landuse pattern of the blocks and generating buildings and secondary road network over it.
02_RUN ANALYSIS METRICS
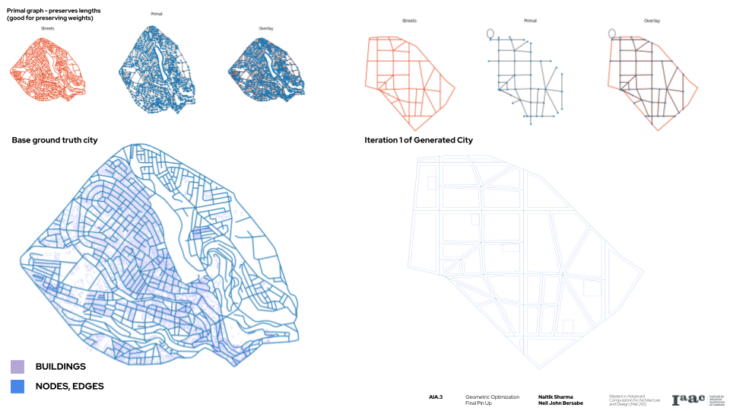
For our analysis we used the primal graphs as basis because we would want to preserve the length of each segment to possibly be used as weights later. Basically we plotted two types of geodataframes from each iteration, one is the road networks as nodes and edges, and another showing the buildings as polygons
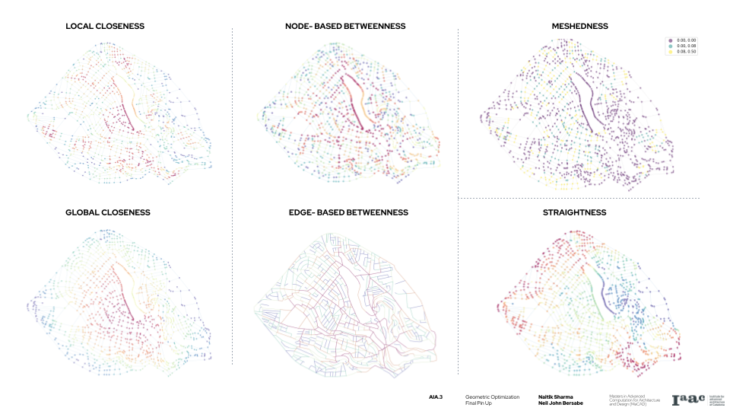
We ran different analysis like meshedness, straightness, closeness and betweenness to see different clustering strategies we could implement for defining our districts. We noticed that the local closeness somehow represents districts the closest in a way by grouping denser segments together.
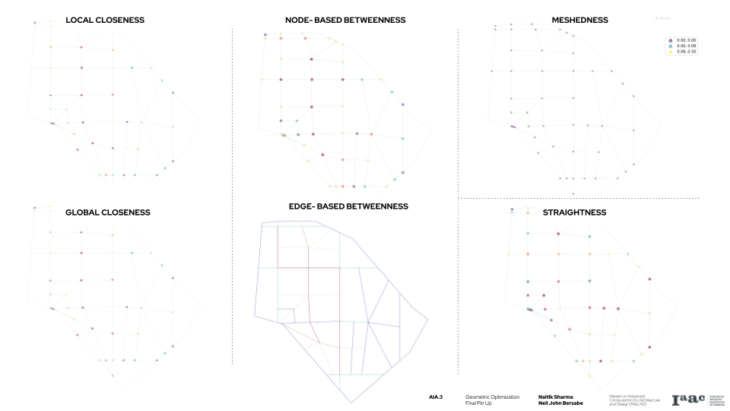
We ran different analysis like meshedness, straightness, closeness and betweenness to see different clustering strategies we could implement for defining our districts
03_DEFINE URBAN ELEMENTS
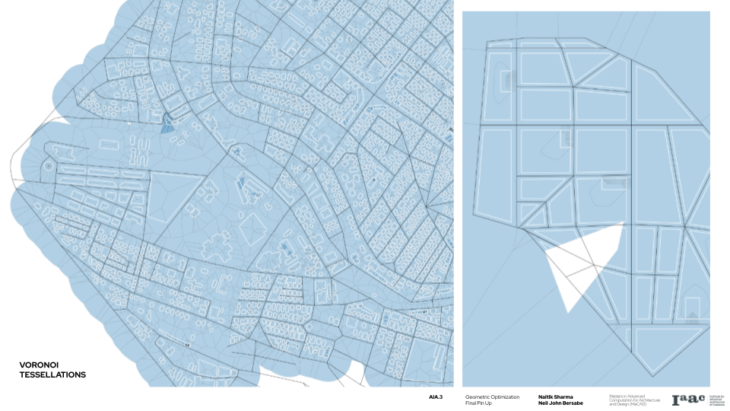
To clearly identify zones, we used voronoi tessellations to space fill the areas and define blocks where we could apend zonal metrics into. Tessellating the graph assures that were not leaving any area/ zone out for clustering
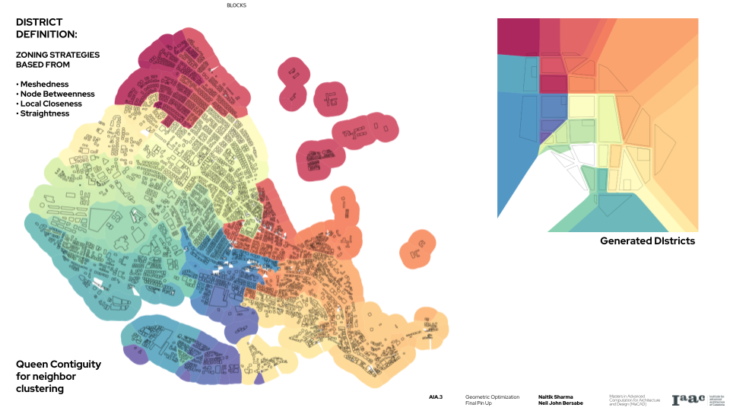
We defined our districts where we created blocks from momepy based from weights appended from the different metrics and got these clustered map as you can see..
We also used queen contiguity in the process of making the blocks as a criterion for determining its neighbors when defining the clusters
We could then follow this logic and use it on other generated cities to clearly define districts. For future steps we could bring this information back to grasshopper together with the clustering data for a more distinctive district zoning for a clearer image of the city
GRAPH NETS & IMAGE OF CITIES is a project of IAAC, Institute for Advanced Architecture of Catalonia developed in the Master of Advanced Computation in Architecture and Design 2021/22 by Students: Neil John Bersabe and Naitik Sharma Faculty: David Andrés León and Dai Kandil