GAME OF GREEN. Urban Green Analysis Toolbox
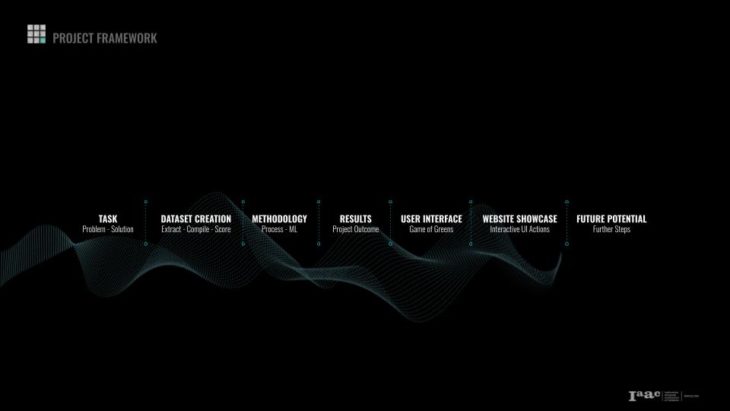
Our Project Framework is defined in 7 stages: The Task, Dataset creation, Methodology, Results, User Interface, Website showcase, Future potentials.
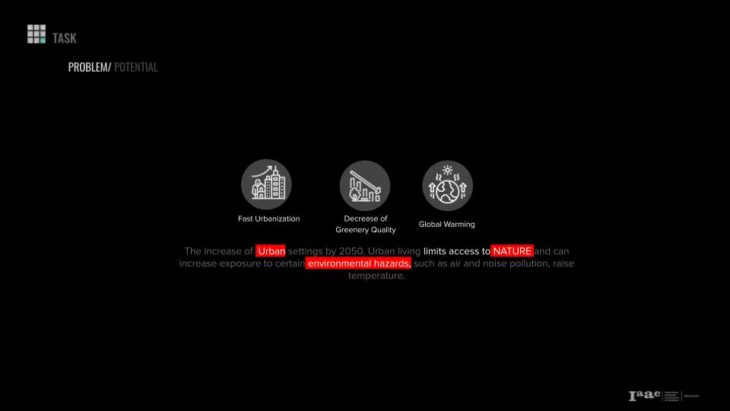
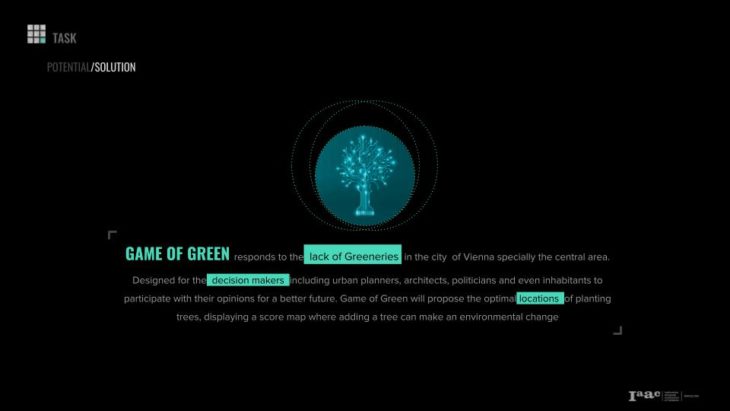
TASK
Due to the fast urbanization in the cities, the greenery qualities are decreasing,and limiting the access to nature. All that leads to certain environmental hazards, such as air pollution, raise temperature, and other global warming issues.
From there looking at the distribution of the greeneries in the city of Vienna, we noticed that the green fields are condensed on the borders while leaving the center with a poor green quality
And In alignment of both The Smart City Wien Framework Strategy and the UN 2030 Agenda as more green spaces interventions can improve the environmental conditions,…
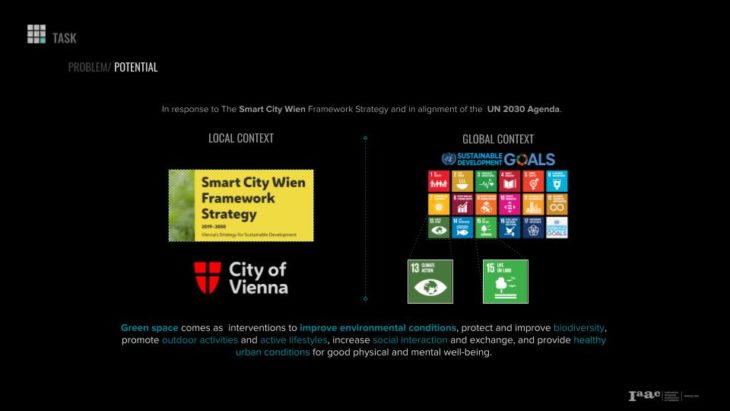
Our project comes as a solution. Game of Green that responds to the lack of Greeneries in the city of Vienna specially the central area.Designed for the decision makers including urban planners, architects, politicians and even inhabitants to participate with their opinions for a better future. Game of Green will propose the optimal locations of planting trees, displaying a score map where adding a tree can make an environmental change.
DATASET CREATION
We’ll take you now to the process of how we executed our project
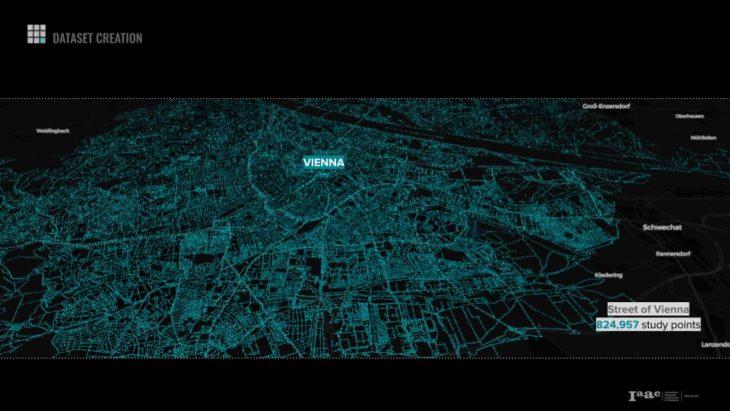
We started with Dataset creation by dividing the street networks of Vienna into point every 10m , resulting with more than 800,000 study points
We extracted Current and historic Data from Open Data Austria, OSMX, and Nasa Power.
- These are the features used for training our Machine learning models
- We compile them all on the study points from the street network, distributed over all Vienna.
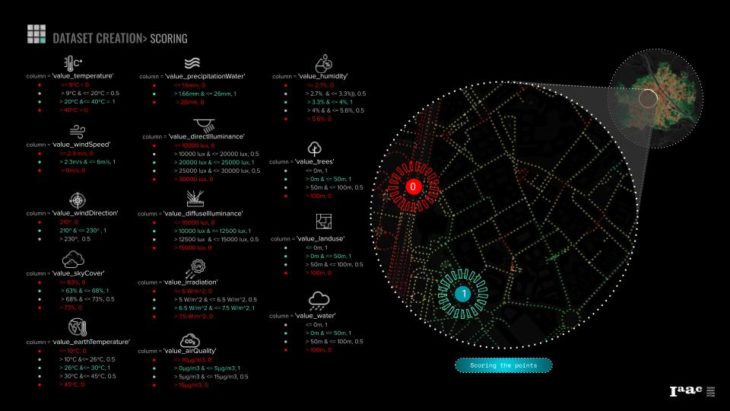
We scored our features from 0 to 1 based on the best and worst conditions for trees to thrive. For example the Value temperature is best for plants between 20 and 40 degrees, while less or more than that range can be challenging.
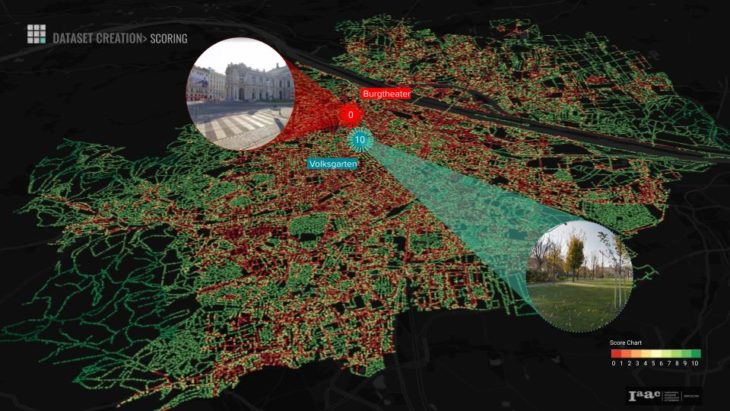
Then we scaled our points from 0 to 10, Resulting 0 as a red color point, and 10 as green color point. Here’s an example of two places close to each other that has different scores, one with the worst green quality, and the other with the best quality
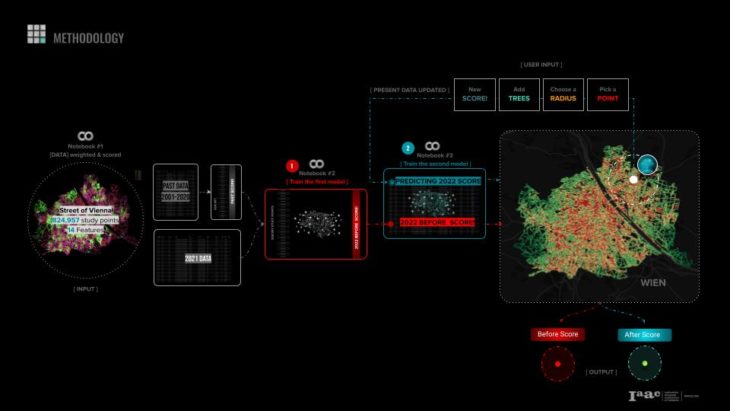
METHODOLOGY
Before training our models , We ran a PCA on our dataset to double check if multi-co-llinearity exists among our features. Then we decided to go with 2 Linear Regression models as we have linear relationships between our variables. One to predict the 2022 Score, Before adding trees. And the other to predict the 2022 Score, after adding trees.
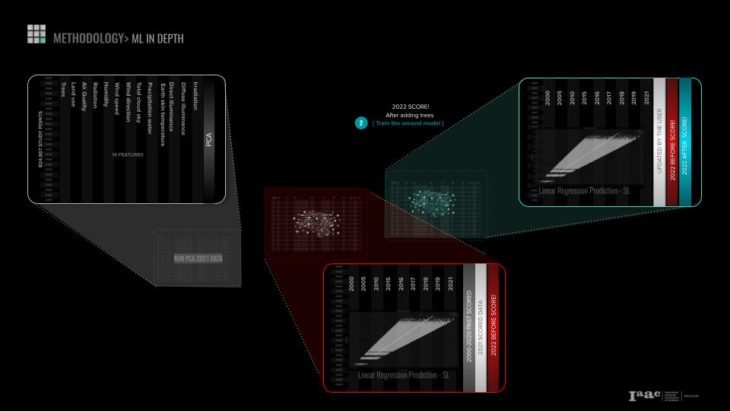
So our methodology would look as follows:
- compiling the features, scoring them, run a PCA analysis
- we trained the two models: The Red one to predict the score before adding trees, and the second is the Green one to predict the same score after the user adds trees within a range of area.
- The output would be two scores to compare After and Before adding trees.
RESULTS
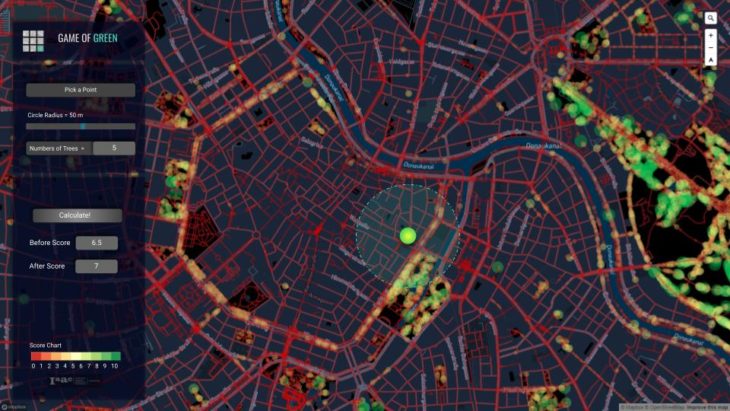
The result of this project is an URBAN GREEN ANALYSIS TOOLBOX showing the power of how planting a tree can make an environmental change.
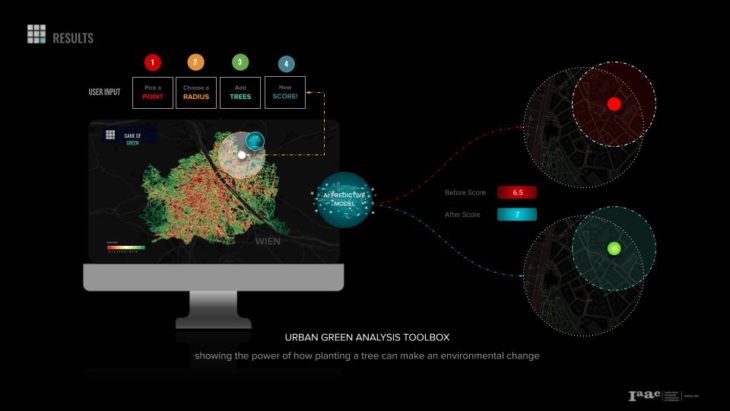
USER INTERFACE
On the INTERACTIVE MAP the user will be visualising colored points revealing areas of the city that could be rewilded and where the areas that are in a good condition. The user would pick a point, select a radius defining the area to be modified, setting a number of trees to be added,
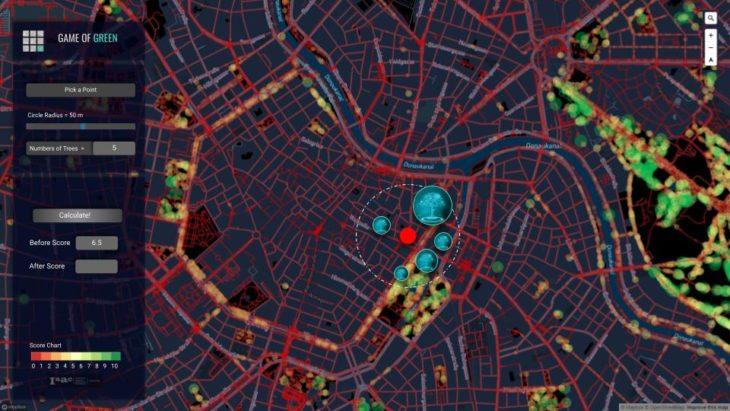
And then calculate the a new score after adding trees, the interactive map would return with a different color within the scoring chart range between red and green, and a score value of both between the range of 0 to 10.
WEBSITE SHOWCASE
Here’s a the website showcase, visualizing how the user can zoom in to inspect which areas are most needed for change:
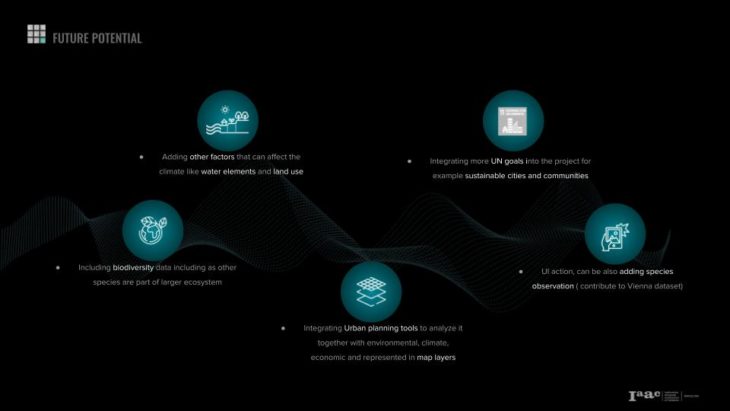
FUTURE POTENTIAL
For the future potentials>
- Adding other factors not only trees, e.g. water elements, and land use
- Integrating more UN goals into the project for example sustainable cities and communities
- Including biodiversity data as other species are part of larger ecosystem
- integrating Urban planning tools to analyze it together with environmental, climate, economic and represent them in map layers
- Contributing to Open Data Ostrich , as the UI action can be also document any observation of the surrounding environment, not only interacting with interface
And last but not least, we would like to shout out for the last 4th member of this group, who gave birth recently. We wanna thank her for her great contribution and dedication. And how beautiful is the motivation and hope of this project is to plant a tree for a better future to our children.
GAME OF GREEN is a project of IAAC, Institute for Advanced Architecture of Catalonia developed in the Master of Advanced Computation in Architecture and Design 2021/22 by Students: Charbel Baliss, Lucía Leva, Jumana Hamdani & Jacinto Moros
Faculty: Angelos Chronis, Aleksandra Jastrz?bska, Nariddh Khean & Serjoscha Duering