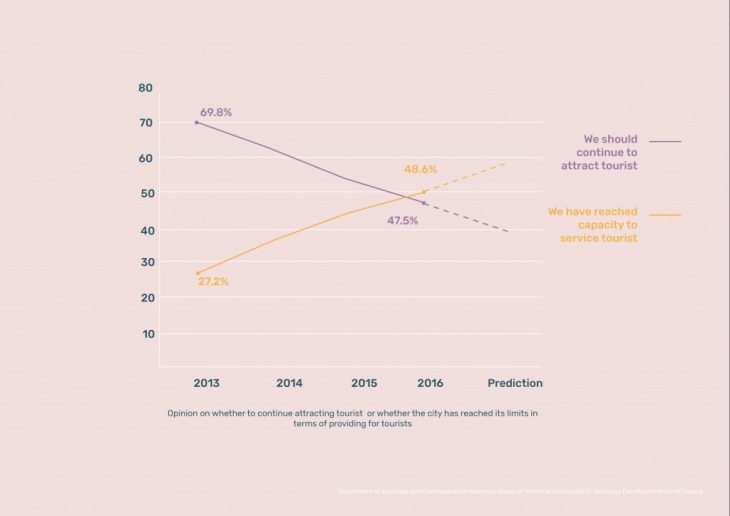
Unlike other cities, where increase in tourists seems to be celebrated as a marker of success, Barcelona is at a place of conflict. These sentiments are mainly felt by locals. According to a study conducted by the University of Coruna, as of 2016, 48.6% of them believed that the city had reached capacity to serve tourists, a number that has been increasing since 2013. Moreover, 47.5% believed that we should continue to attract tourists a number that is in decrease from 69.8%.
 Overtourism refers to a situation in which conflicts arise between locals and visitors at tourism destinations, due to perceived congestion or overcrowding. There are several effects caused by over tourism but for our case we will be focusing on congestion.
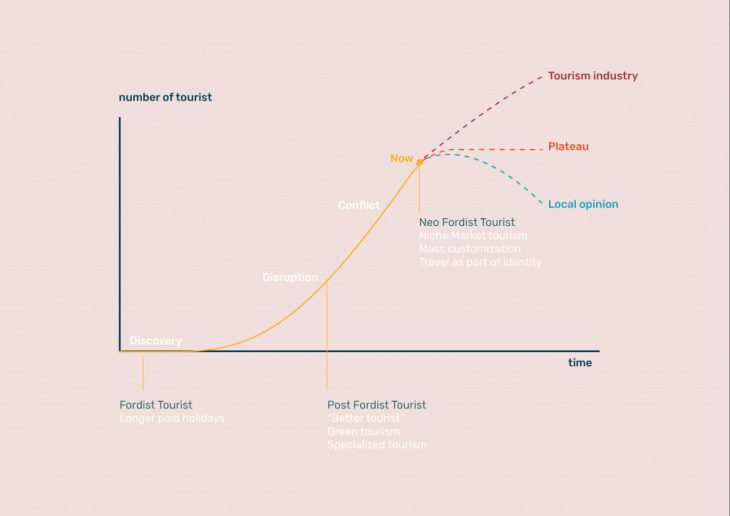 But to understand how we got to this point of conflict, we have to go back in time. Tourism began in the Fordist era due to an increase in paid holidays. These fordist tourists were interested packaged experiences such as summer camps. As tourism increased, there was a disruption to the industry caused by tourists becoming more conscious of their impacts. They began to demand green tourism and a specialised experiences. This brings us to today, conflict. In the midst of this, we have a new set of tourist, Neo-Fordist. These tourists want customization, a niche market and view travel as part of their identity. There are then three possible actions. If one was to ask locals, it would be to reduce tourism. If one was to ask the tourism industry, it would be to encourage tourism. But it could also be possible to cap tourism.and remain at a plateau.
So, who are these tourists? These tourist seek localhood and shared experiences.
What motivates them to move? Millennials and GenZ would rather splurge on experiences while traveling. In seeking to investigate experiences we looked into these platforms: trip advisor and Airbnb. Understanding that Airbnb experiences cater to a younger generation as opposed to the later.
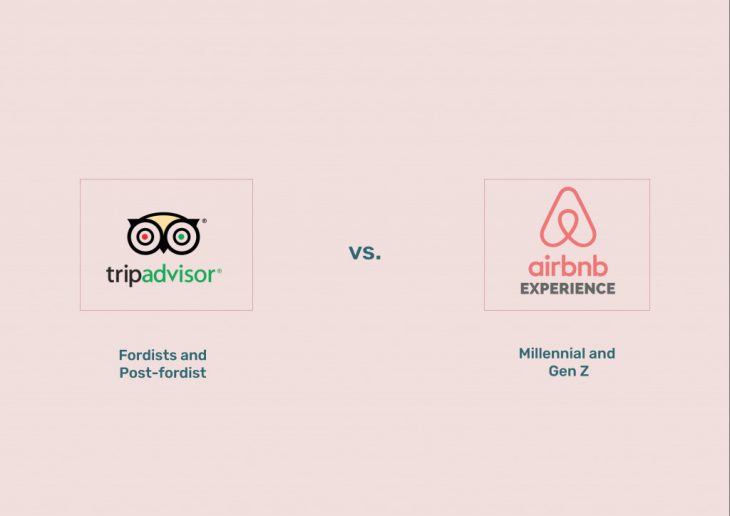
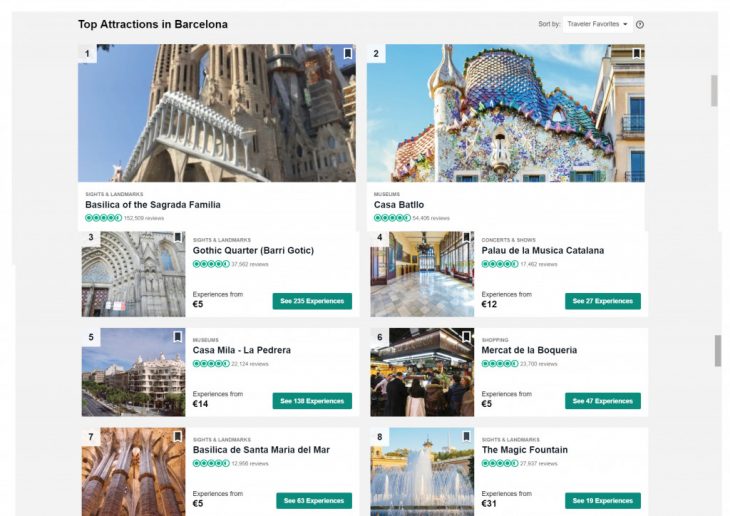
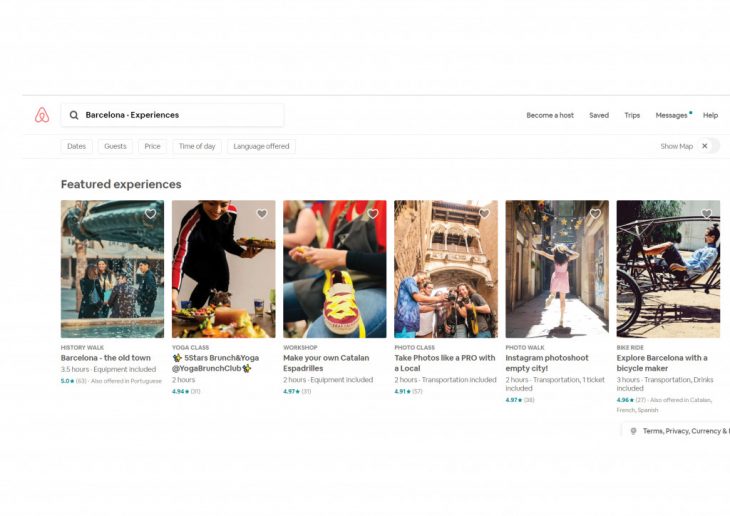 From a cursory glance of these websites one can notice a shift from seeing in trip advisor and experiencing in Airbnb.
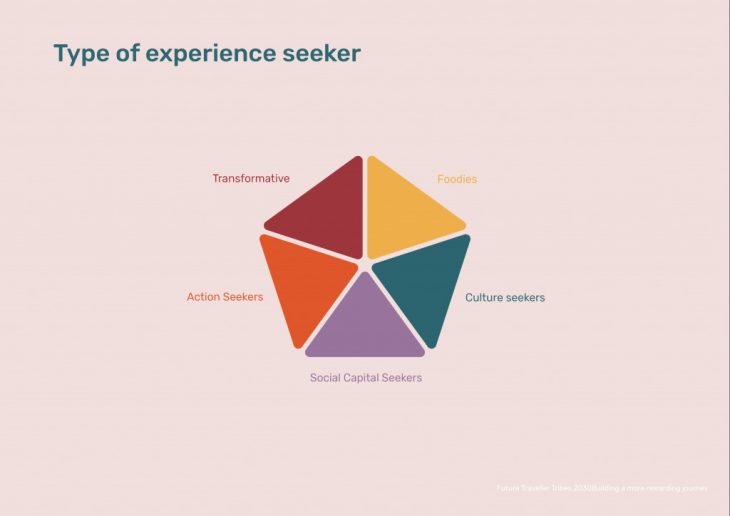
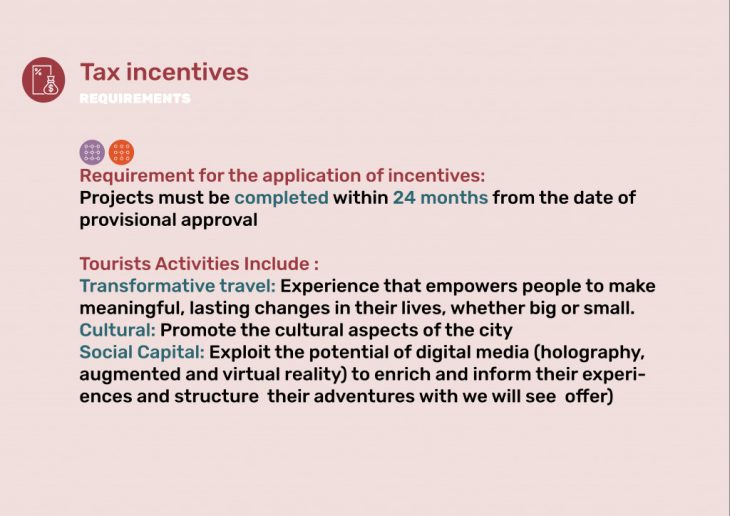
 These tourists can be separated into five types of experience seekers: foodies, transformative seekers (empowers people to make meaningful, lasting changes in their lives, whether big or small), cultural seekers, social capital seeker(desire to take maximal social reward from their travel) and action seekers.
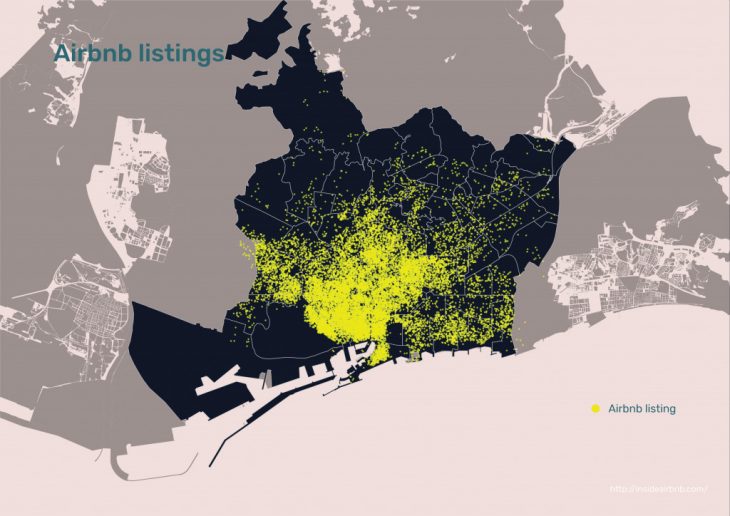
 How are they dispersed in the city? If you look at a map visualizing Airbnb listings you would assume a shift from centralised to decentralised.
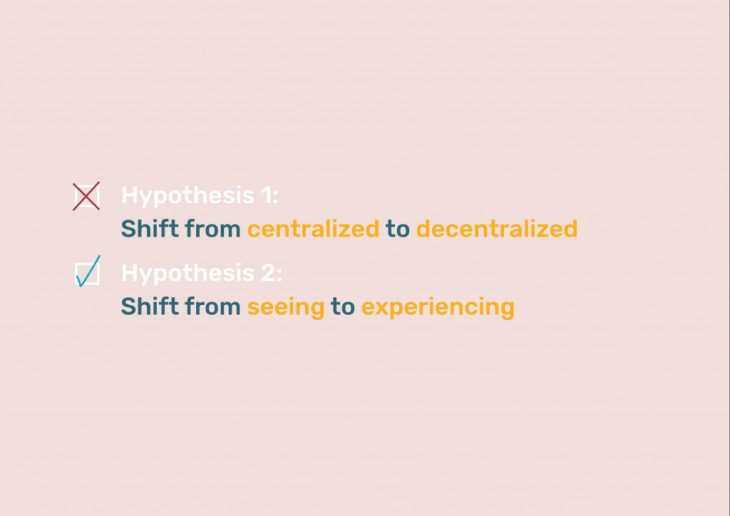
 We know have two hypotheses: shift from centralised to decentralised and shift from seeing to unique experiences. But is this so?
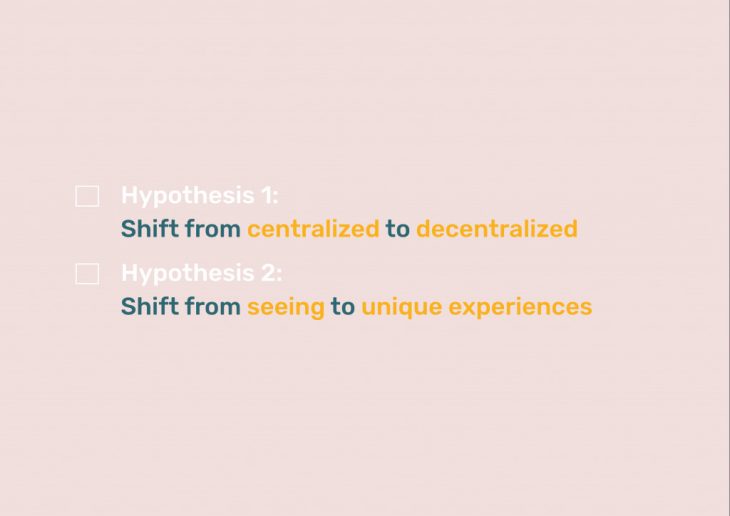
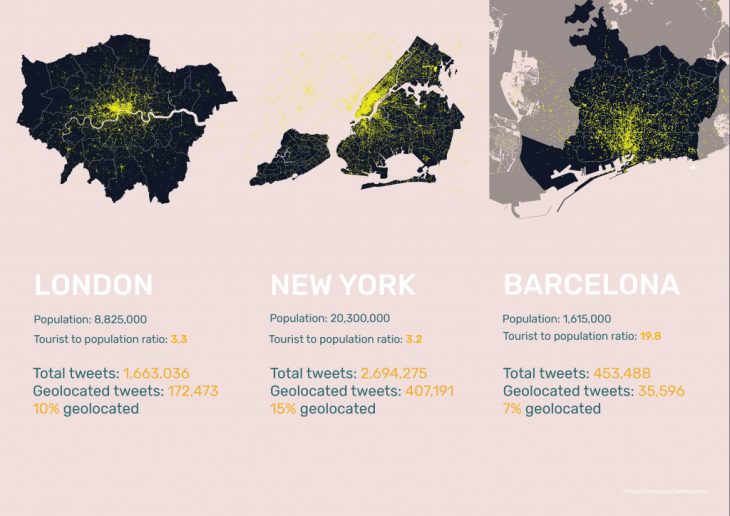
In order to be able to verify the two stated hypotheses, we conducted an analysis using data from twitter. By using twitter developer account we were able to download over 4 million tweets from three touristic cities: London, New York and Barcelona. The number of collected tweets is closely related to the population in a given city with over 2 million tweets from New York and only 450 thousand tweets from Barcelona. Indicated cities also differ significantly in terms of tourist to population ratio. In the case of London and New York, there are three tourists per one inhabitant, while in Barcelona there are 19 tourists per one inhabitant. The geolocation of collected tweets varies from 7 to 15 percent across the cities.
 In addition to the geolocation, the twitter datasets contained information about the tweet itself such as: text, hashtags, external links, time and language the tweet was posted, but also basic information about the user like user id and user location.
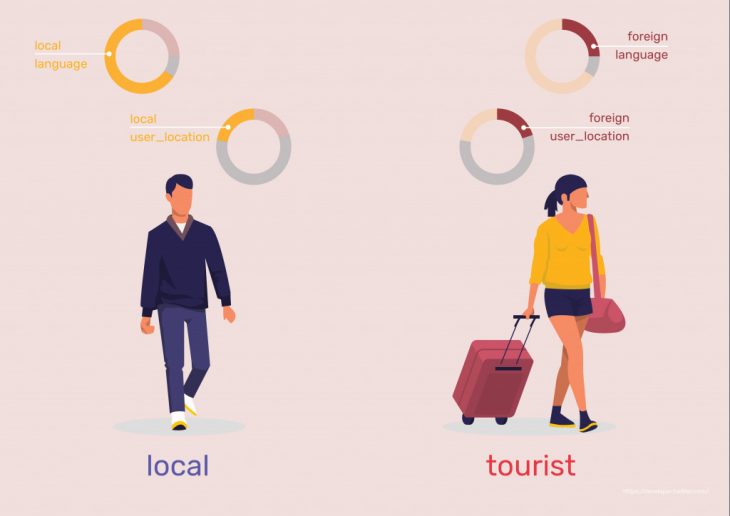
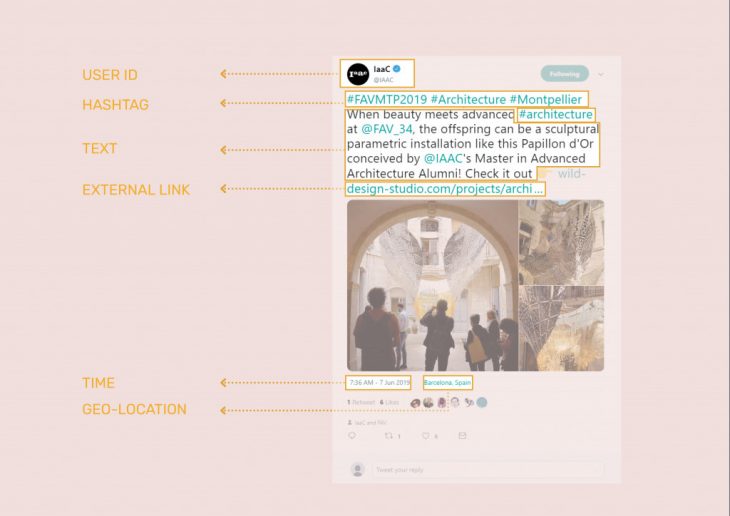 However we used this information as well as language of tweet to be able to filter tweets coming from locals and these coming from tourists. So a local is someone who tweets in local language and who has a local location set in the profile corresponding to the city, while tourist tweets in foreign language and use a foreign user location. In this process we discarded a lot of data, our database does not include. For example, tourists in Barcelona who speak Spanish or locals without user location settings, however we can largely assume with a higher level of accuracy that filtered tweets are coming from tourists and locals.
 With these two groups, we could carry out further analysis to confirm or deny the first hypothesis.
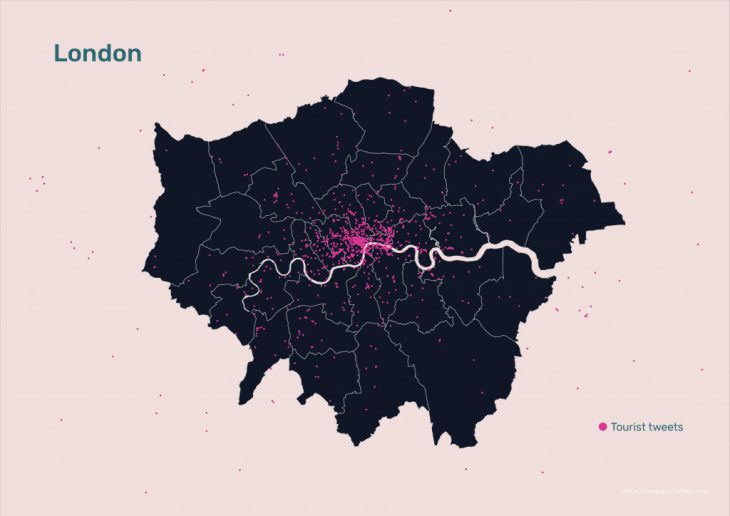
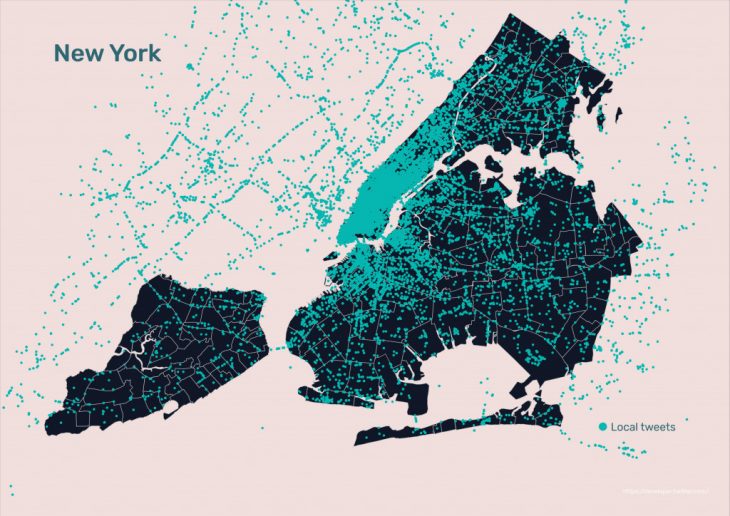
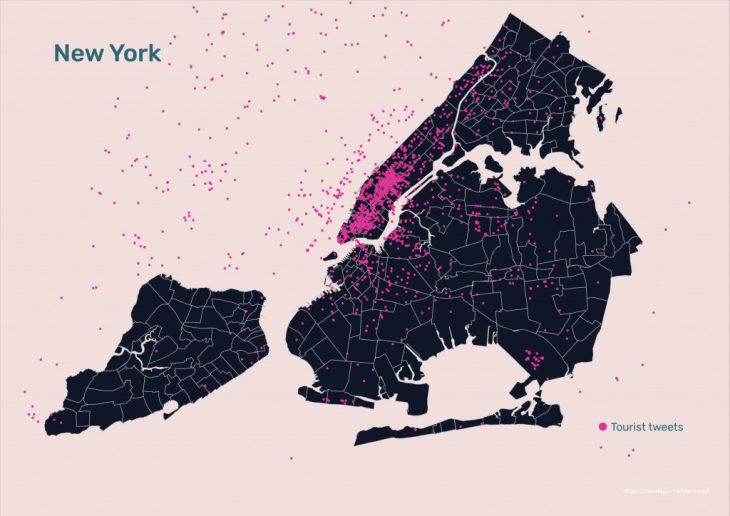
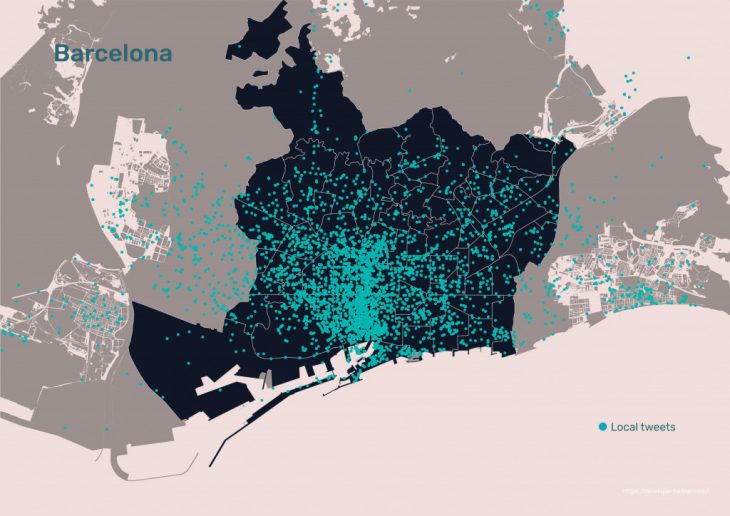
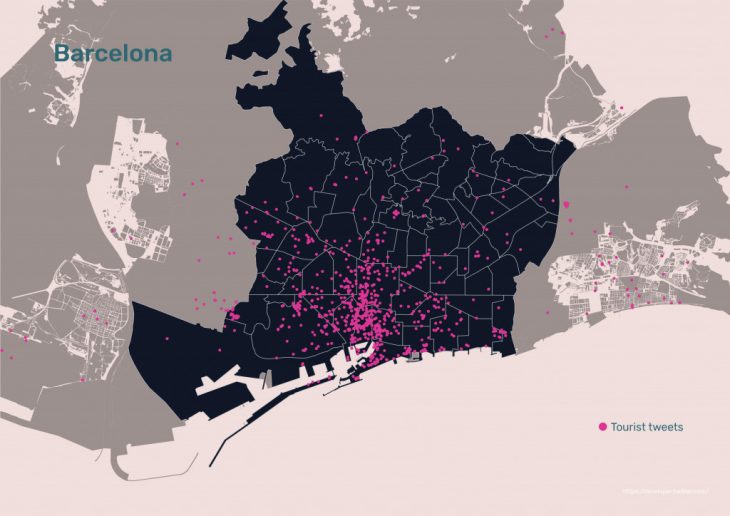
 So we visualize tweets coming from locals and tourists in each of the three cities. Starting from London, through New York to Barcelona, we can observe that tourists’ tweets in each of these cities are more concentrated in the city center while locals’ tweets are spread all over the city. Having in mind the distribution of airbnb accommodation in the city, some might suppose that the location of tourist during the day and night is different.
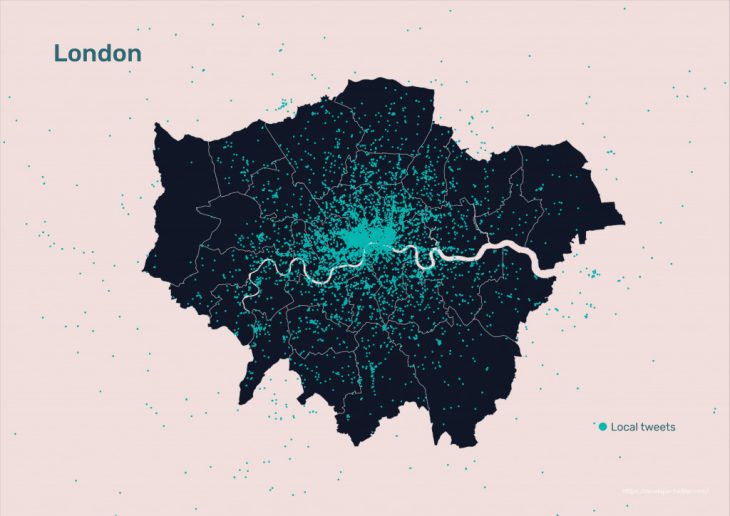
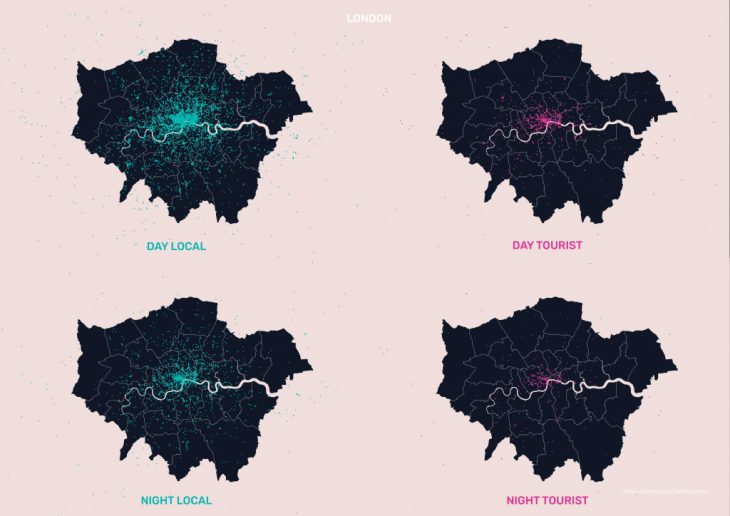
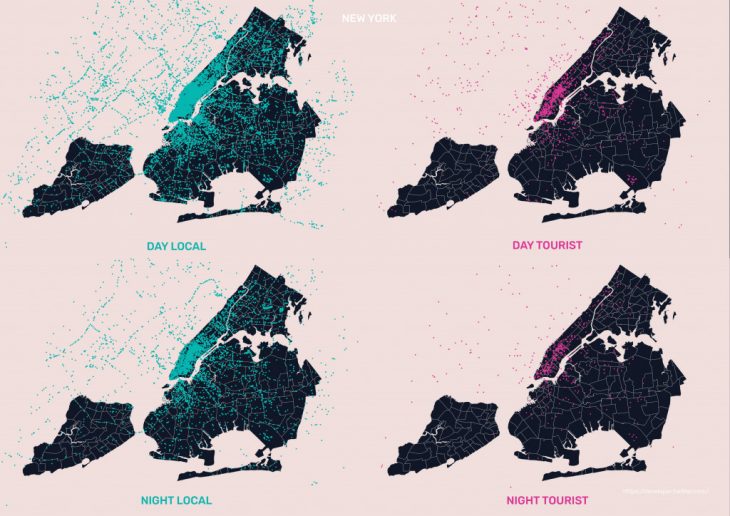
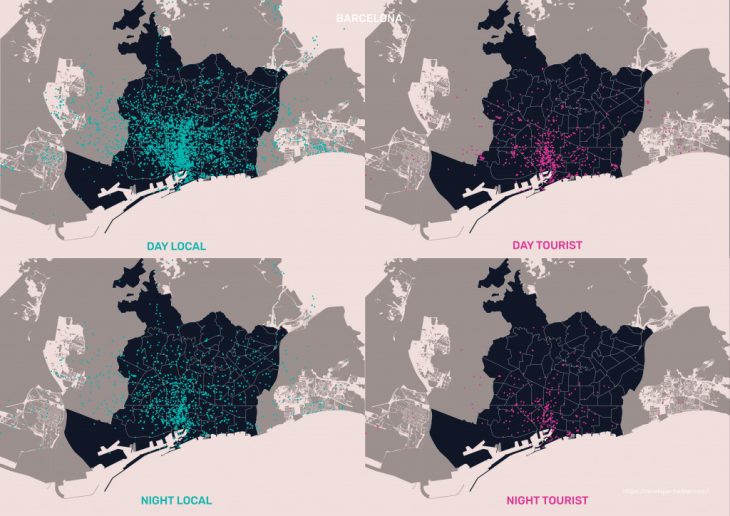 However, after splitting tweets from tourists and locals into day time tweets and night time tweets, we can say that the same effect can be observed. Therefore, our hypothesis suggesting that tourists are decentralized in the city, has not been confirmed by data.
  As to the second hypothesis, suggesting that there is a change in the motivation of tourists – from the need to see to the need to experience, we went to previously mentioned online platforms and we listed top 15 sightseeing attractions from trip advisors website and top 15 attractions from airbnb experiences. Using only keywords we looked for tourists’ tweets containing these words in either text or hashtag column.
 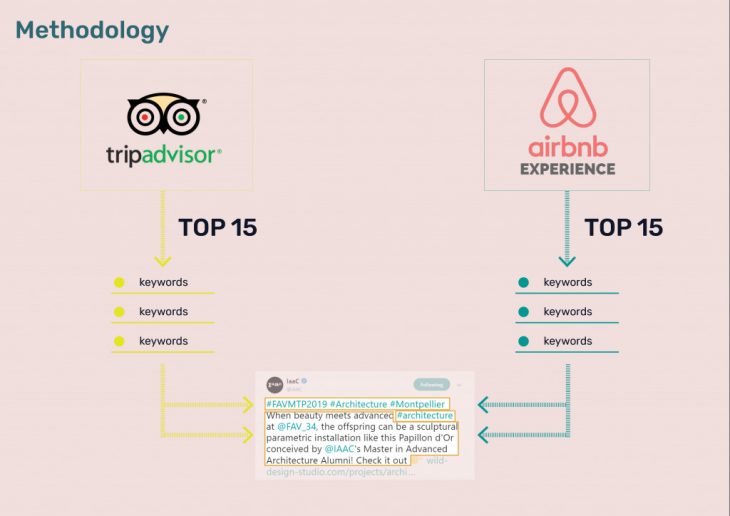 In case of London, we have found over twice as much tweets about experiences than sightseeing places. Another important observation is that tweets about experiences are more spread than very centralized tweets about sightseeing places.
 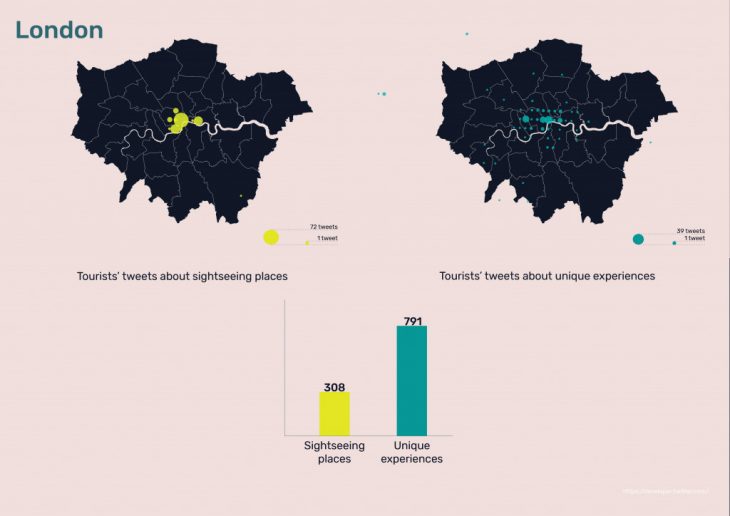 The data look very similar in the case of New York with less disproportion between the observed variables, but in the case of Barcelona we observe more tweets regarding sightseeing places than tweets about experiences in Barcelona.
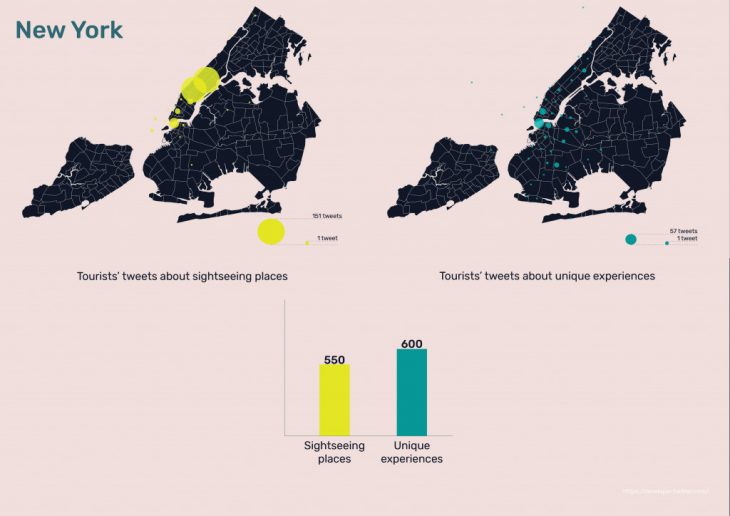
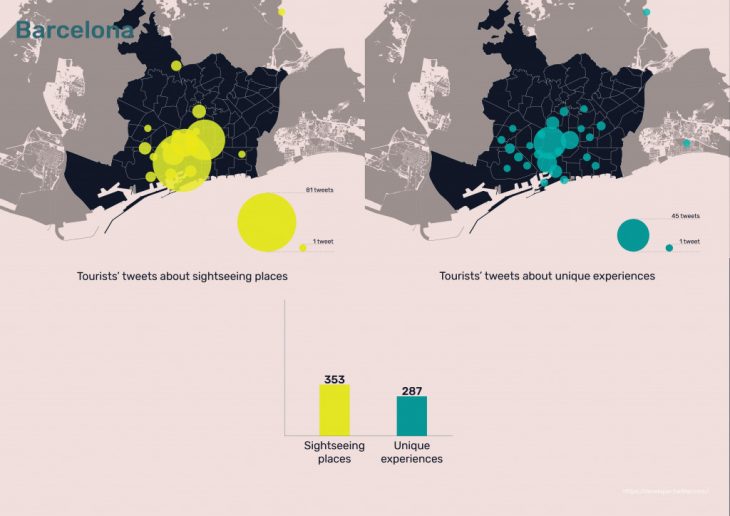
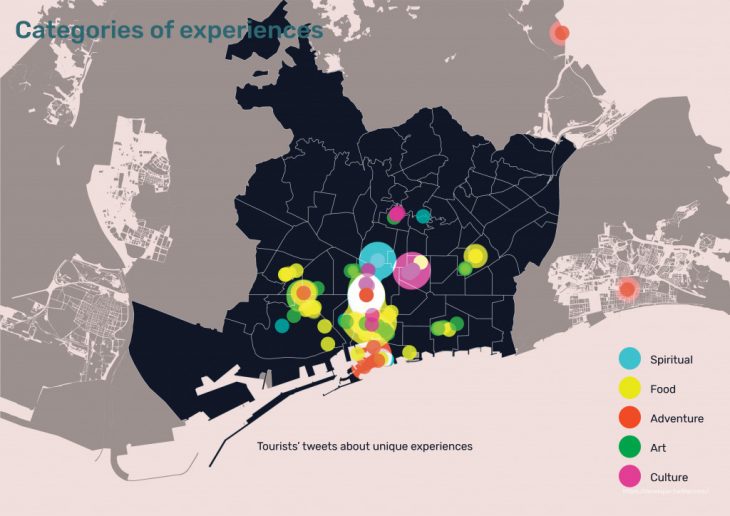 Based on the data we had, we were able to distinguish different parts of the city that provides different experiences for tourists. This led us to the conclusion that tourists’ are in general interested in looking for experiences, which confirms our hypothesis, however in the case of Barcelona, there is an advantage of sightseeing places.
 So let’s summarize what we know.
 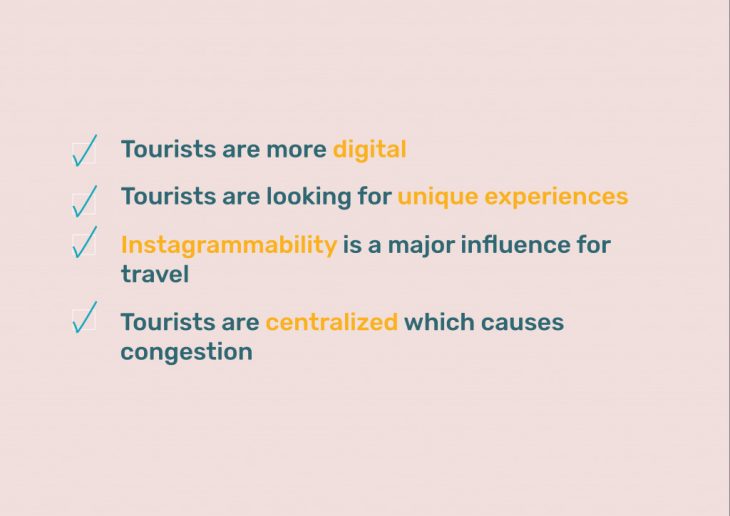 And what do we know about Barcelona? In 2017, Spain jumped from being 5th tourist destination for Millenials and Gen Z to second place. Consequently, the number of tourists will continue to grow.
Additionally, Barcelona is seeking to be a pioneer in the tourism digital innovation sector. At the Second World Conference on Smart destination, in February last year, one of the conference’s highlights was the announcement by the Minister of Industry, Trade and Tourism, Reyes Maroto, of a Spanish Smart Destination Network – a forum for travel destinations to build links, exchange good practices and take advantage of synergies. Also, as part of Barcelona specialisation plan regarding tourism management the city plans to use of ICT to encourage the tourist experience.
Proposal
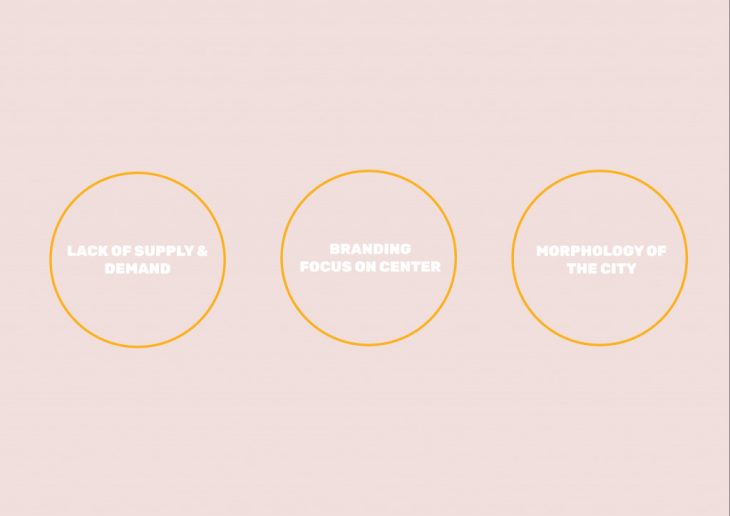
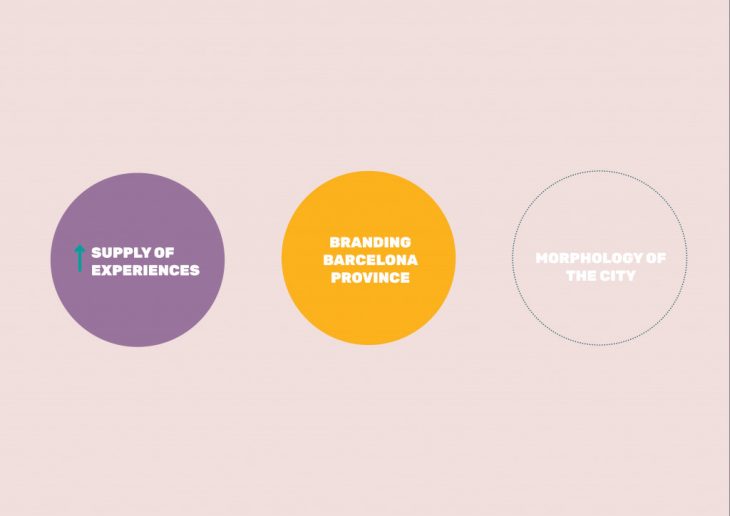
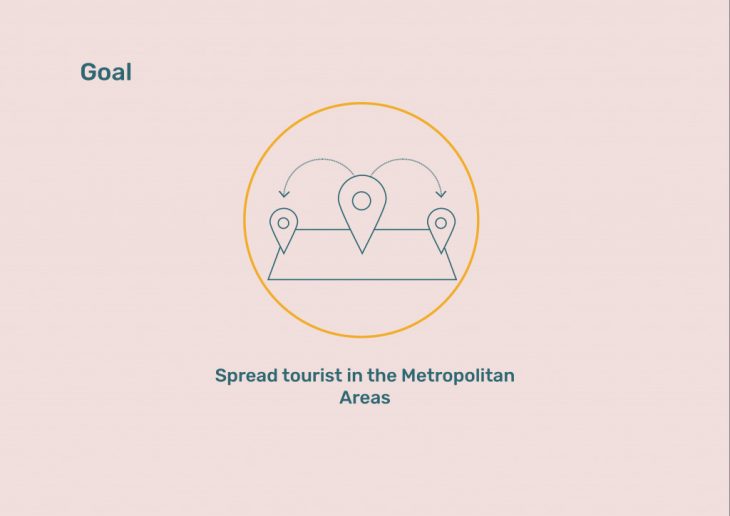 But why are people not going elsewhere? This is because of a lack of supply and demand, branding focusing on the center and the morphology of the city(narrow streets…). We cannot change the morphology of the city but we can augment it. Therefore, our goal is to increase the supply of experiences and shift the tourism brand to better reflect the tourism brand of Barcelona as a whole.
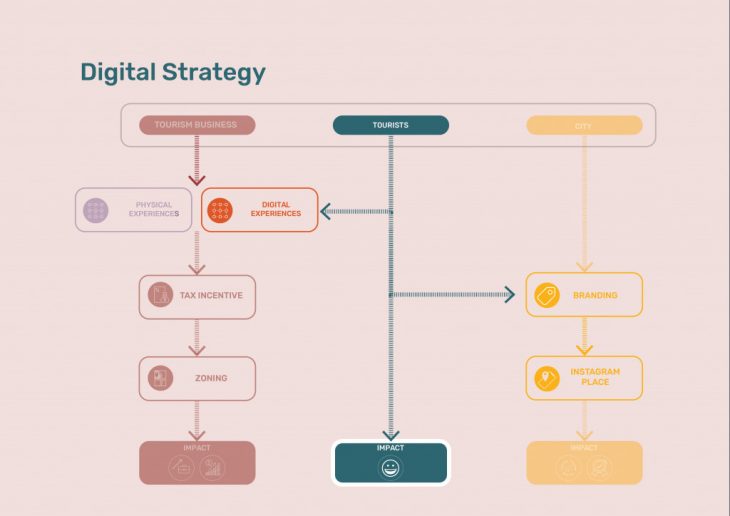
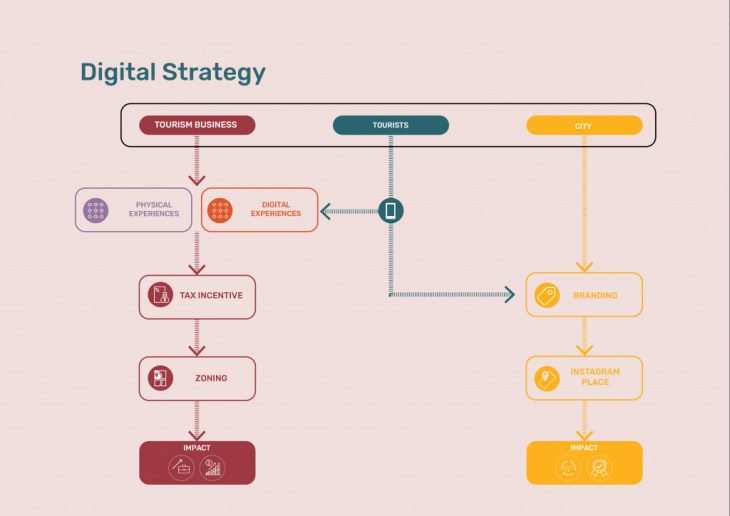
Looking at the efforts from the city concerning supply of experiences they are mostly advisory and intelligence gathering services for several entrepreneurial and business projects. Our project seeks to propose a digital strategy focusing on three stakeholders: tourism business, tourists and the promotional consortia. From the tourism business perspective we sought to increase supply and demand of physical experiences and digital experiences through tax incentives.
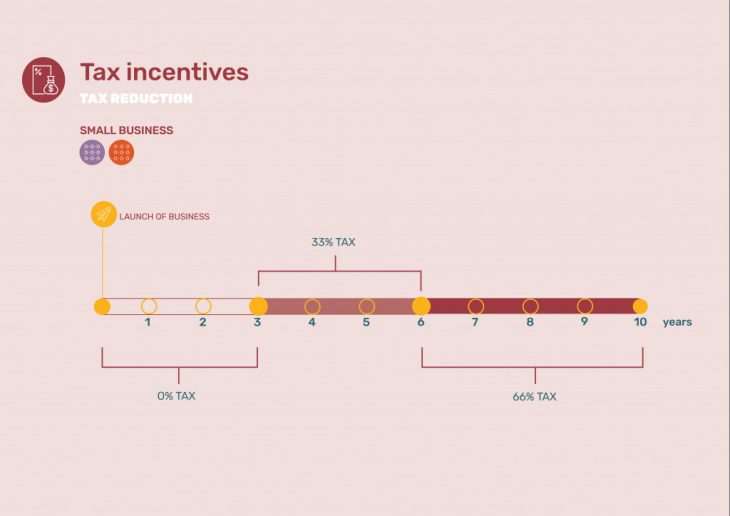
 Tax reduction
If a business builds an experience based or digital tourism based business in a designated tourism desert zone (low-supply area marked for economic development), and provides jobs for area residents. As a result, the state forgives their state taxes for the first three years of operation, and then taxes them at 33.33% for the next three years, 66.66% for the next four, and only then – after ten years – at 100%. An arrangement like this usually holds only if you continue to operate in the same place and maintain the number of jobs for area residents for those first ten years.
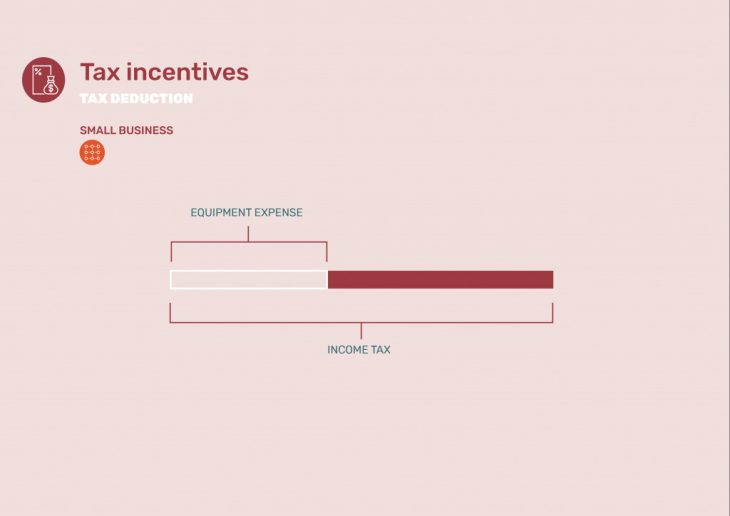
Tax deduction:
Tax deductions only apply to digital tourism businesses. These businesses are allowed to subtract some or all of their expenses for equipment related to technology hardware or software from their taxable income (the amount that you pay taxes on). As a result, their taxes are lower because you’re taxed on a smaller amount.
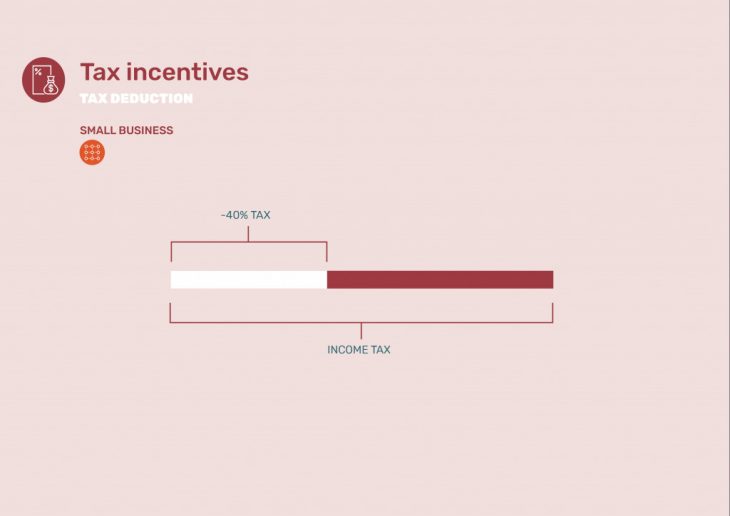
 Example:
So if your business had income of $200,000 last year. You spent $20,000.00 on equipment hardware for your operation. Since the municipality offers a 40% tax deduction to businesses on spending for environmental improvements, you can deduct that $20,000.00 from your income when you figure your taxes. Thus, you’ll only pay taxes on $180,000.00. In practice, that would save you up to about $8,000.00.

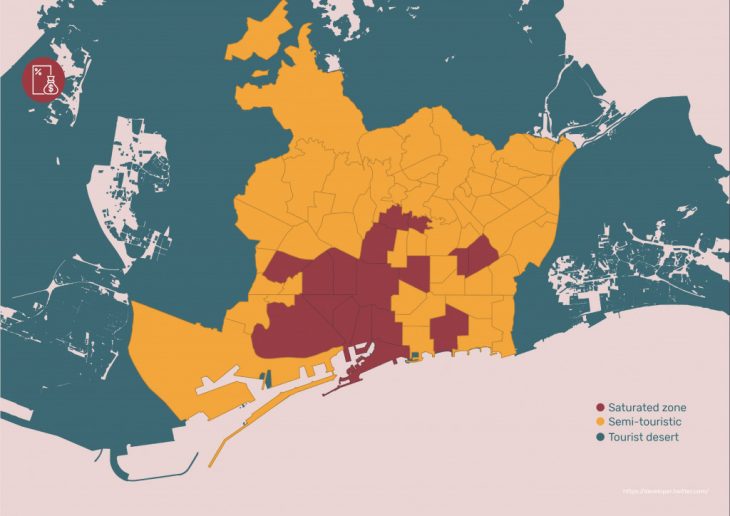
Zoning:
Utilising the previous experience map zoning boundaries were determined based on the location of tweets concerning experiences.There are 3 zoning area: saturated, semi-torristic, and tourist deserts. This would lead to an increase in employment in the neighborhood and creation of business at a faster pace in order to deal with the pressure.
Branding
Our Second goal is to streamline the branding image displayed by Barcelona. Branding for the city is mainly promoted by Turisme de Barcelona. Turisme de Barcelona “assuring compliance to the maximum degree possible between the goals of promotion and development of tourism and commerce in the city of Barcelona”. Barcelona in this case is a municipality with an area of 100 square kilometres. However, Turisme de Barcelona is part of a larger branding effort: Destination Barcelona. This encompasses a much larger territory which because of improvements in connectivity has gradually turned this into an urban continuum. When we speak about Destination Barcelona, we do so without referring to any precise geographic or administrative boundaries.Its limits are largely marked out by demand.
There are three tourism brands in the Barcelona Province: Costa Barcelona, Paisatge Barcelona and Barcelona Pirineus under the website barcelonaesmoltmes. Which is very difficult to find. Not in the top 10 pages on Google when searching for Barcelona and tourism.On the other hand, Turisme de Barcelona has a very good visibility on the internet. However, if one looks at the first page of Turisme de Barcelona. We see an image of the The Barcelona Turistic Bus. Clearly this promotes activities at the center. Additionally, a scroll down promotes sightseeing experiences very focused in the city center.
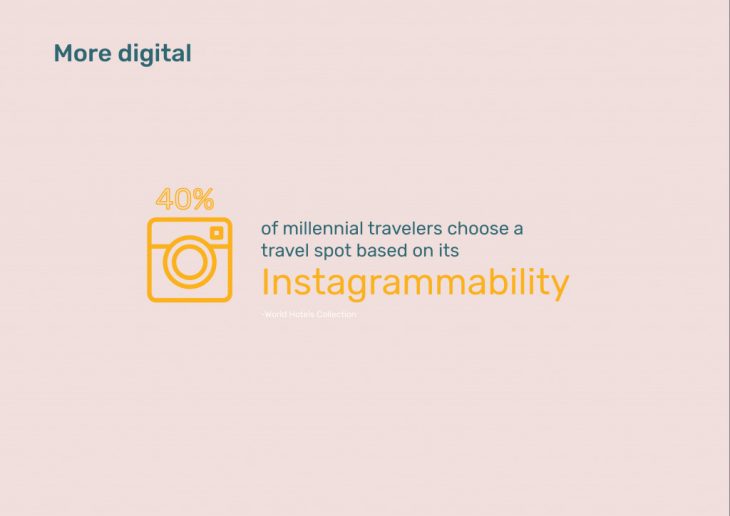
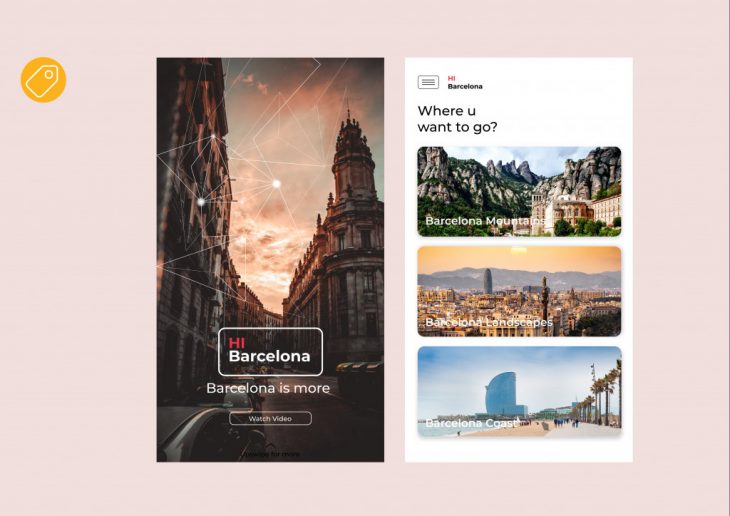 That is why we propose a streamlined brand based on mutual cooperation between the city of Barcelona and its entire area of influence, based on a win-win philosophy that generates benefits for both. This new brand would be called Hi Barcelona. It would first direct the user to the 3 Barcelona brands. Today, travelers are sharing their experiences over multiple online channels, mainly seeking instagrammable places.
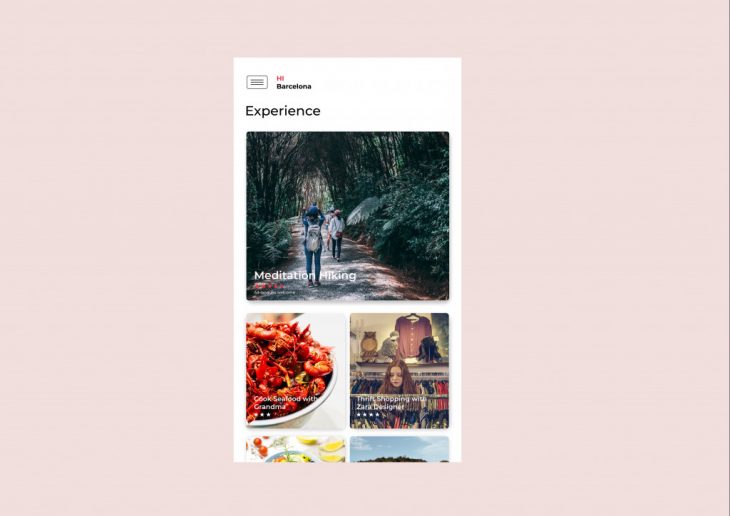 For this reason, the content promoted would be more centered on local based and run experience. For example a mediation hike, cook seafood with grandma of go thrift shopping with a Zara Designer.
 The platform would provide a map with curated journeys To draw up a ‘tourist map’ at both city and district level.discover great experiences across the region that they may have never found otherwise.
 App
App
From a stakeholder point of view, we would like for the city to function as an assistant. The Hi Barcelona app would have 3 features. It would be a one stop shop for information concerning tourism policies, incentives, zoning and resources for the private sector. Creating a hassle free process. Second, it would have a chatbot to handle inquiries with a personality that is customized exclusively for you, for your needs, so that it’s relatable and easy to talk to. Say you’re traveling to Spain, your personal assistant would use spanish expressions to teach you a bit about where you are going. If this sounds far fetched, the city of Los Angeles, in partnership with Microsoft, introduced a chatbot named CHIP (City Hall Internet Personality) that is able to answer more than 700 queries at the same time. Thirdly it would push for experiences in new neighborhoods.
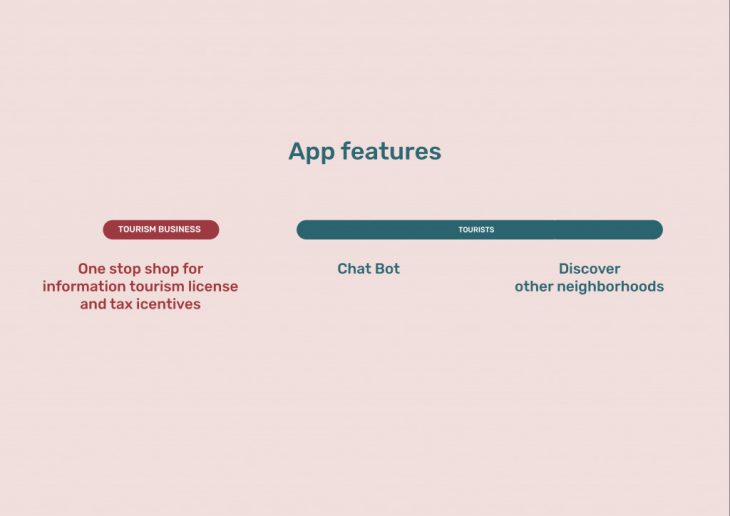
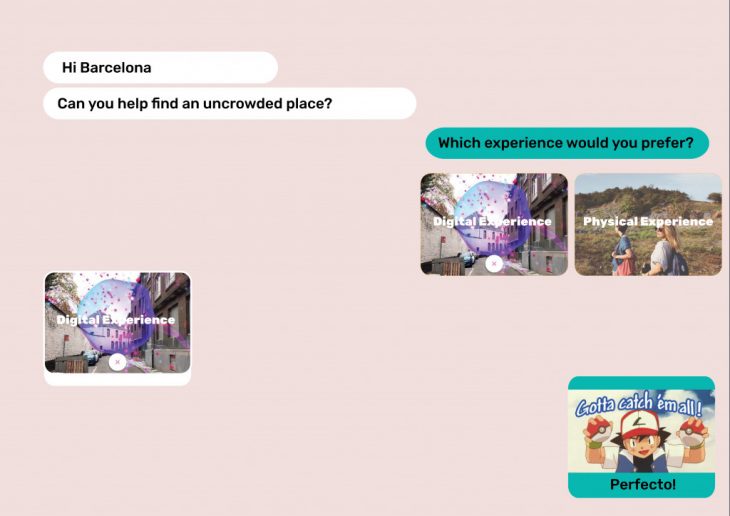
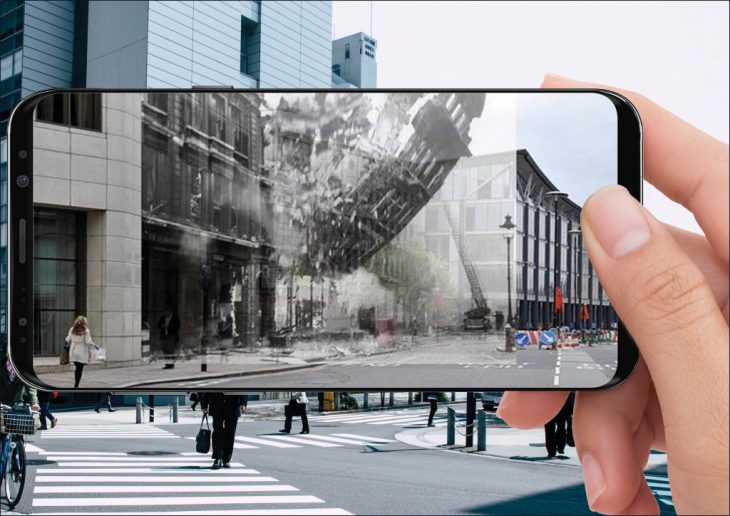
With a strong collaboration with the private sector as well as tax incentives to promote digital experiences. We foresee the possibility of tourism business surrounding augmented Reality. For example visit movie scenes shot in Barcelona.
CONCLUSION
The average number of days for stay in Barcelona is 2 days. This distribution of activities would lead to better and diversified supply resulting in longer stays. Tourists who visit only for short periods tend to stay centrally and visit only the major tourist attractions. Longer stay tourists by comparison visit a greater range of attractions and explore more peripheral regions.
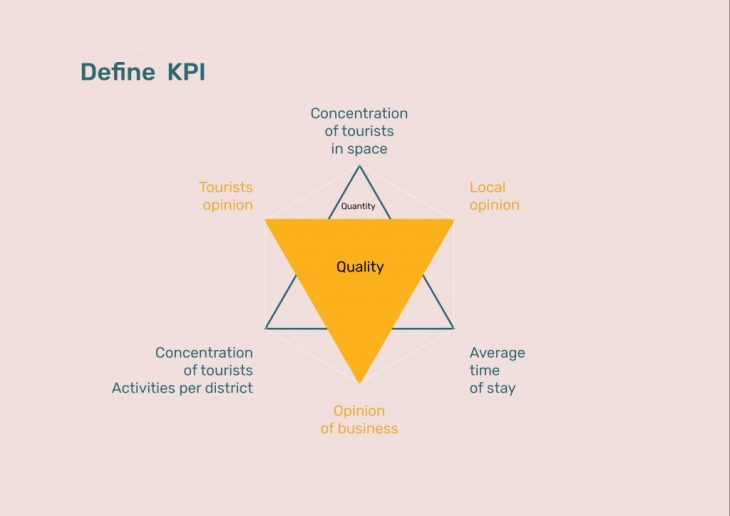
To measure the success of this proposal. We defined 6 KPI ?s. Quantitative KPI ?s: Concentration of tourist in space, Average time of stay and Concentration of tourist activities per district. Qualitative KPI ?s consisting of tourist opinion, local opinion and opinion of business.You can’t move La Sagrada Familia but you can move experiences.
Experience More is a project of IaaC, Institute for Advanced Architecture of Catalonia
developed at Master in City & Technology in (2018/2019) by:
Students: Natalie Adhiambo Ouma, Wei Wei, Jaroslaw Kowalski
Faculties: Luis Falcon, Diego Pajarito