EVOLUTIVE COCOON
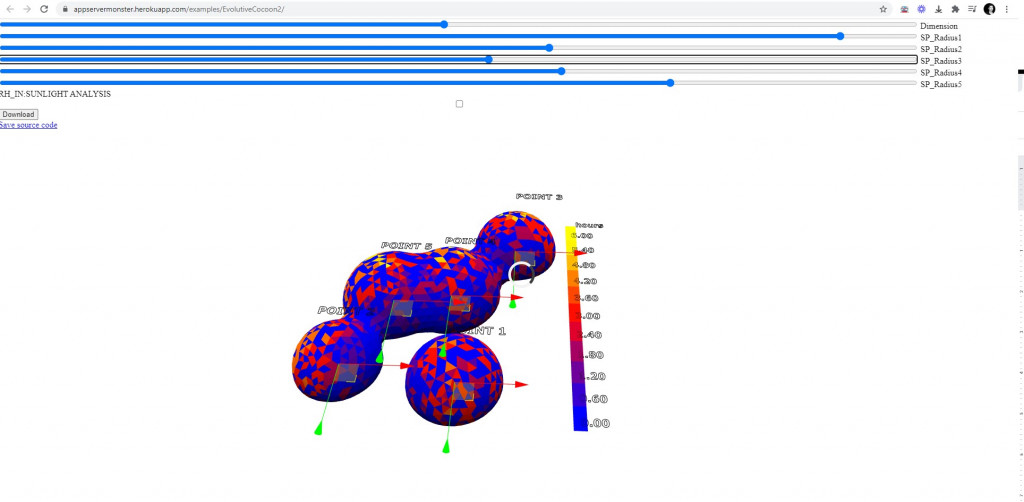
The objective of the Evolutive cocoon is to allow the user to play the configuration of 5 domes and its analysis on the web.
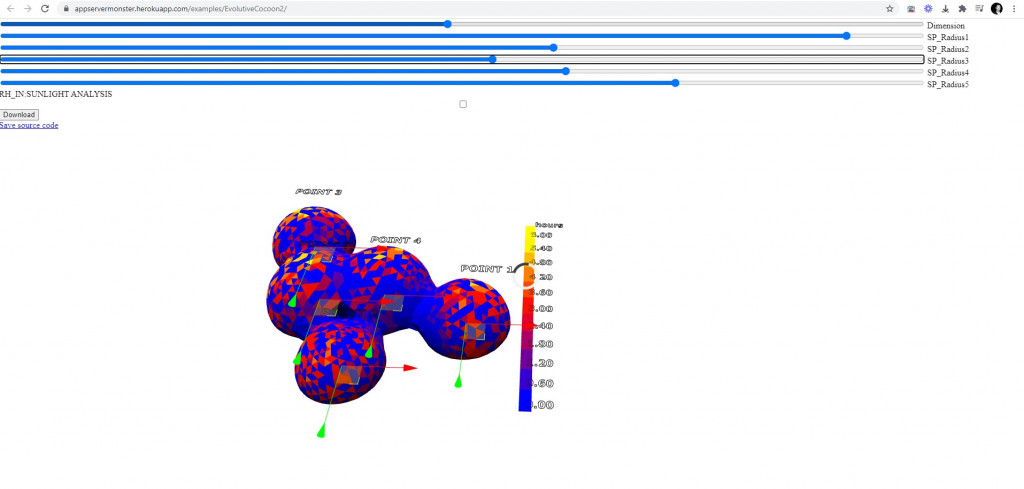
The Evolutive cocoon can be controlled by 5 points on the web which is working in the Rhino App-server. Users can see different configurations of 5 domes by changing points position and radius of domes. But also, solar hour analysis is shown directly after changing point positions. 
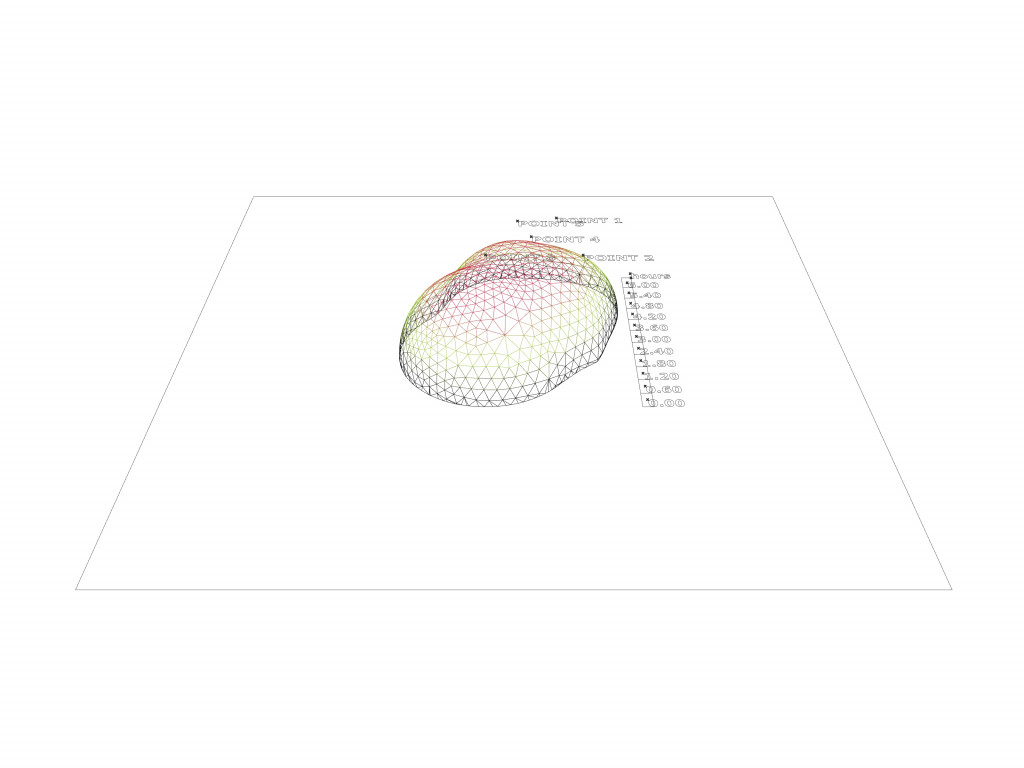
When user check the ‘Sunlight Analysis’ box, we can see the curve of those domes which represent structure and the 5 points still can be moved.
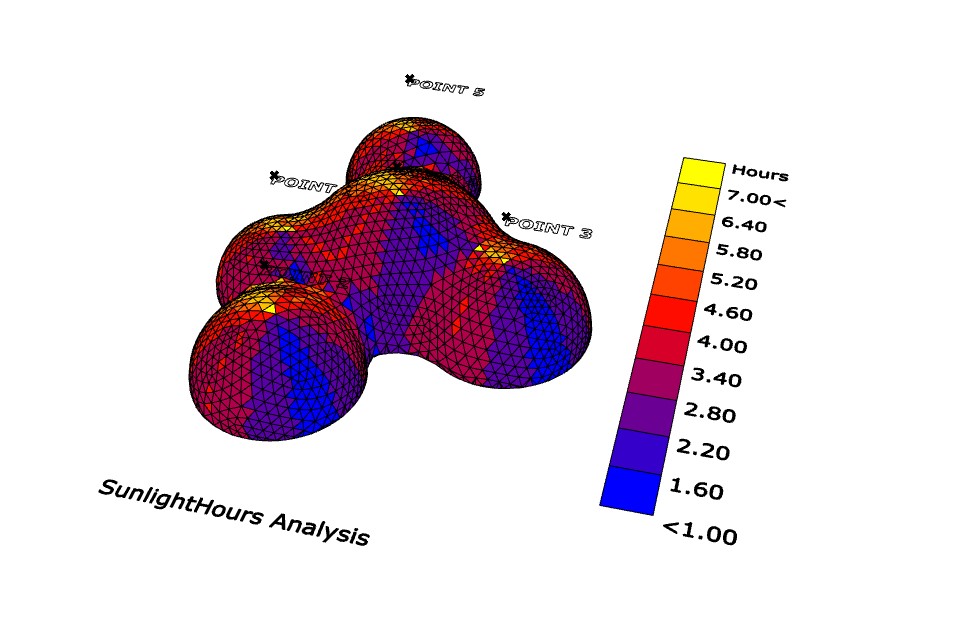
We can see direct sun hour analyse represented by 11 different colors. The yellow is the most exposed area over 7 hours and the blue is the least exposed area against the sun. This direct data can be used to find out the most optimized form for gaining electricity from solar panels.
Let’s play with points !
Click ‘HERE’ to play and control