Environmental analysis
Gathering environmental data plays a crucial role in understanding urban conditions. Water, and air quality, noise and light pollution are factors that impact citizens’ lives a lot. Environmental monitoring is a sophisticated process that becomes a challenge for decision makers and designers. Our urban conditions change several times during the day and don’t allow us to react immediately. So, the process of collecting data and analyzing it leads us to some conclusions through statistics. We can not predict the future changes but monitoring environmental behavior helps us to assume about the possible scenarios. The challenge that is associated with analyzing environmental data is that designers by themselves are not able to fully understand the meaning of what they see. So, many specialists from diverse spheres such as ecologists, physicists, geoscientists, engineers and others have to work together to analyze and correctly interpret the data. Today varios of different methods, devices and indicators are developed to capture passing conditions and record them. Let’s have a look at some of them.
Ajuntament.Barcelona.cat provides data about air and noise air pollution including NO2 and PM10. The monitoring allows, first of all, to provide the framework knowledge of the state of the territory, to then have sufficient tools to prevent, prioritize and act with the aim of maintaining and improving the environmental conditions of the city, as key factors of ‘a good quality of life. Maps of the page express a set of detailed information on the environmental quality to which the city is subject. In this way we are able to know the level of pollution anywhere in the city (on the street of our house, in a specific park, etc.), selecting the polluting agent that is considered in each case.

Air pollution. NO2 concentration.Barcelona
Noise pollution is a set of maps that serve to globally assess the population’s exposure to noise produced by different sources of noise in a given area. In addition, they are the basis for the elaboration of action plans. They are developed every 5 years and are used as a management tool for the improvement and recovery of acoustic quality where necessary and to protect good acoustic quality in quiet environments. Maps consist of a graphic representation of the sound levels of the city. It can be represented:
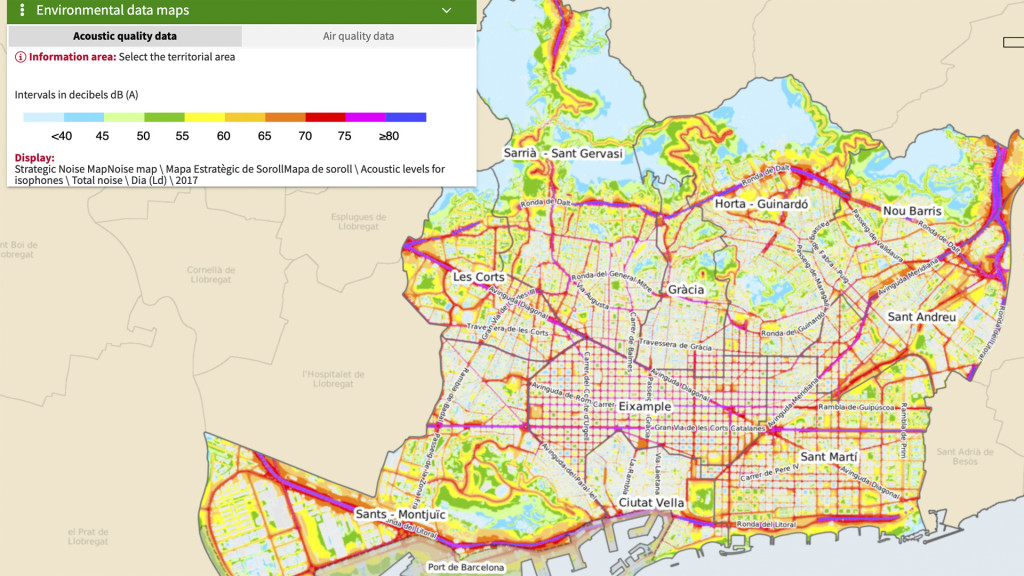
Noise level. Barcelona
Additional value of environmental facilities that are located in each district is promoting a culture of sustainability among citizens. People’s involvement is essential in attempts to improve neighborhood and city.
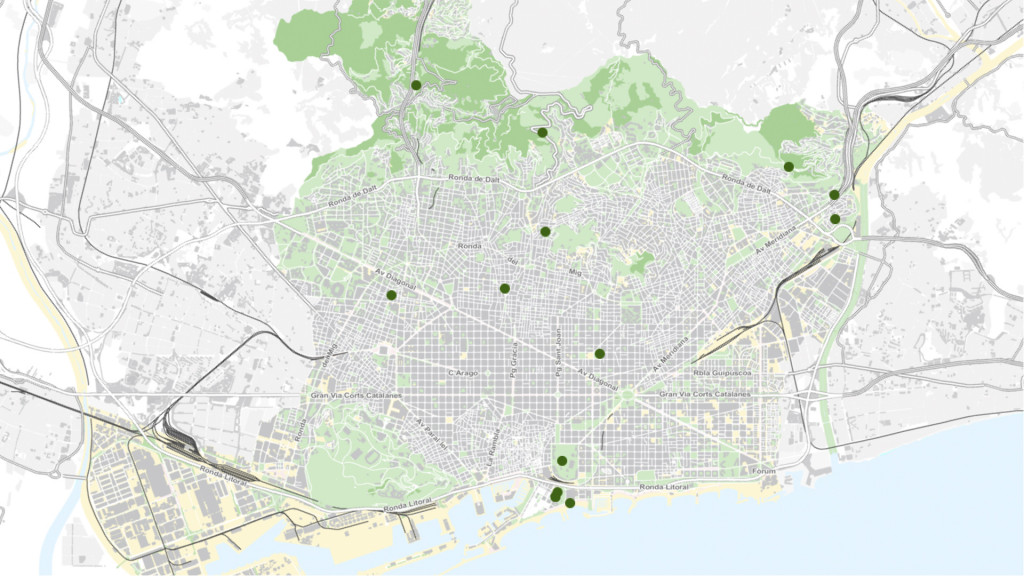
Environmental facilities. Barcelona
Smart citizen kit is another tool that has been developed as part of the iSCAPE project under European Community’s H2020 and helps citizens to monitor urban situations. Data about air quality and temperature, sunlight, humidity, pressure etc. All collected data gathered on the platform and can be downloaded for different purposes ranging from citizen science and educational activities to more advanced scientific research.
CanAir is a citizen science project using mobile and static sensors to measure air quality with cell phones and low-cost technology. By using mobile app and CANAirIO devices citizens can build a network, an air quality map that will allow them to know what they are breathing and how they can improve life quality. With the data collected it is possible to independently validate official air quality numbers, because what can be measured can be improved.
SenseBox originated in Germany, also a good example of citizen science tool. With the support of the Federal Ministry of Education and Research, the project aims to reach as many citizens as possible. School education also actively integrated in the process of involving and raising awareness among people. In addition, OpenStreetMap will be expanded with additional new functions including data from senseBoxes.
According to the survey among MACT students the most popular variables that students consider in their projects are wind speed and direction, temperature, relative humidity and air pollution. These variables are easier to understand and analyse, sometimes we even don’t need a specialist’s assistance to read these data. Open data portals and government agencies are highly used by students as they are usually free and considered as reliable. However, those sources usually provide just a general overview and are not enough for deep learning.
Space-time analysis
Space-time analysis is dedicated to give a broad understanding in events and environmental behavior. Knowledge about how situations or physical events change in time and space gives us the possibility to identify capacity and extreme values. So we are protected from critical situations as we are acknowledged about that kind of possibility. For example, having data about the temperature regime in Barcelona during the last 10 years helps us to be prepared for the possibility of water shortage caused by extremely hot conditions.
Social relationship
Social relationships are very important when we talk about spatial data, they are highly influenced by environmental and economic conditions. A lot of cases illustrate this. For instance, the number of the Covid 19 outbreaks in New York city depends mostly on average income and household sizes. The biggest hot spots include areas of Bronx, Queens and Staten island.
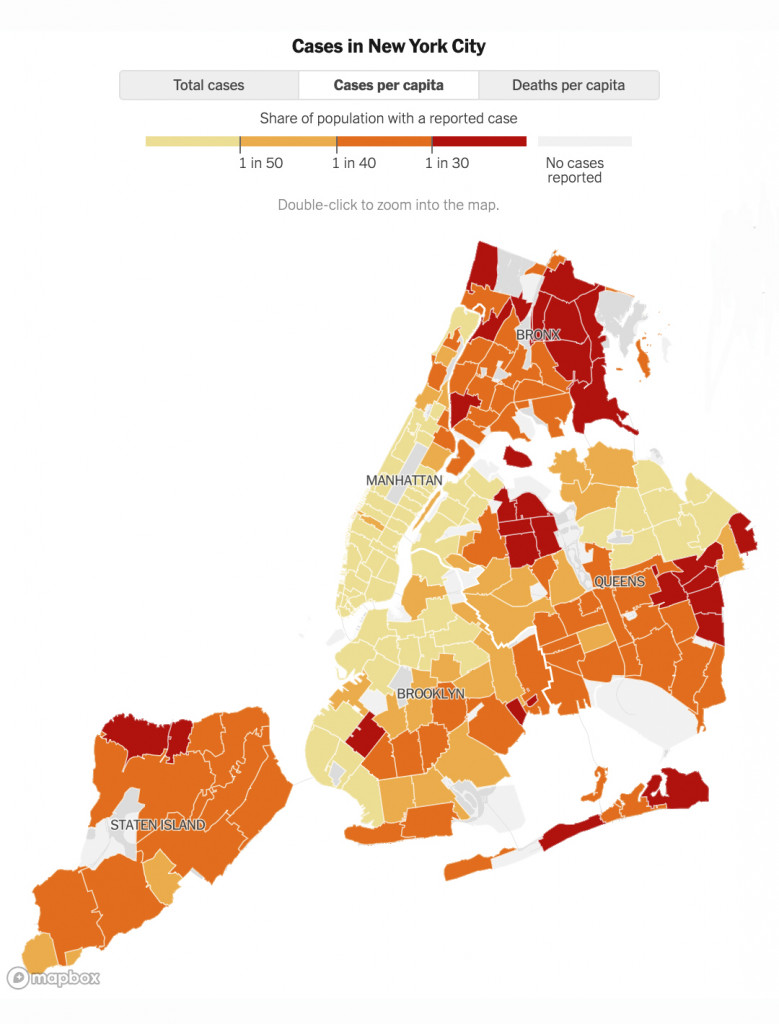
Covid 19 outbreaks by district. New York.
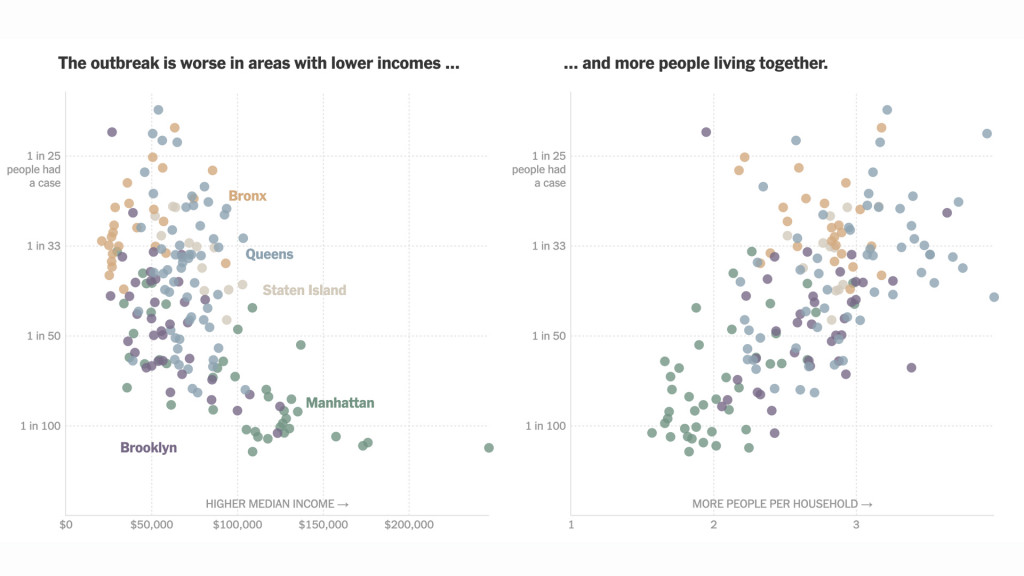
Covid 19 outbreaks depends on income and household size
As far as we are concerned, environmental data plays a major role in urban life. It is important to involve citizens in ideas of sustainability and provide them with actual conditions in a city. Gathering and analyzing environmental data requires a lot of specialists from different spheres to work together. It is a big challenge, however, the team of designers, scientists, citizens and decision makers can improve our cities and big data helps them to proceed.
References:
https://ajuntament.barcelona.cat/mapes-dades-ambientals/soroll/ca/
https://canair.io/
https://docs.smartcitizen.me/Smart%20Citizen%20Kit/
https://sensebox.de/
https://www.nytimes.com/interactive/2020/nyregion/new-york-city-coronavirus-ca
ses.html
Environmental analysis. Methods, devices and indicators is a project of IAAC, Institute for Advanced Architecture of Catalonia developed at Master in City & Technology, in 2019 by:
Students: Linara Salikhova, Andrew Saltzman, Michelle Rodriguez
Faculty: Diego Pajarito