E-CONNECTIVITY WAVES
E-connectivity waves is the visualization of the ecological performance of possible corridors for pollination in the in the plana of the Vallès, up Barcelona city. To see how the connectivity works inside the area, we used Circuitscape program to define the paths. But the main question is: which are the paths that provide better ecological connection from all the branches that have been created by Circuitscape?
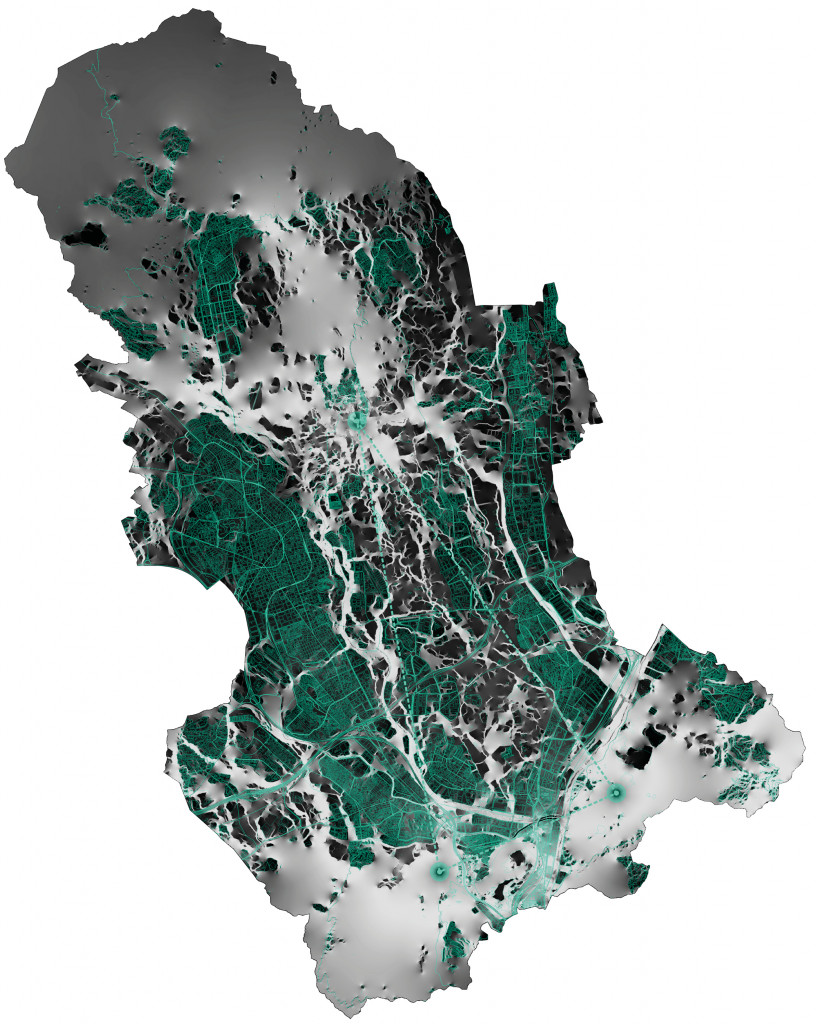
Circuitscape: Ecological potential corridors
This land is between 3 main natural parks (Sant Llorenc del Munt i l’Obac, Serralada Marina and Collserola) and two rivers (riera de Caldes and Ripoll river). The idea is to create an ecological corridor that connects the 5 different natural areas ) by using the nature in between them and the high amount of abandoned crops are in this territory.
The aim of this exercise is to visualize this ecological performance in 3 dimensions using the numerical data created by the program by coding a heatmap of the ecological performance. Since our intervention will be done in the abandoned crops as central point of the project, the other purpose of this exercise is search for a correlation between the area of the abandoned crops and their connectivity, in order to see which ones are better to intervene depending on this parameters.
Data Collection
By using the Circuitscape output, we merge the shapefile of abandoned crops and natural areas as centroids in qgis. Afterwards, the ecological performance of each area is calculated by using Zonal statistics. The output is that each polygon of the shapefile recevies a value between 0 and 0.1 as an indicator. This data and the area of each polygon will be the data used for the map and the chart of analysis
Methodology
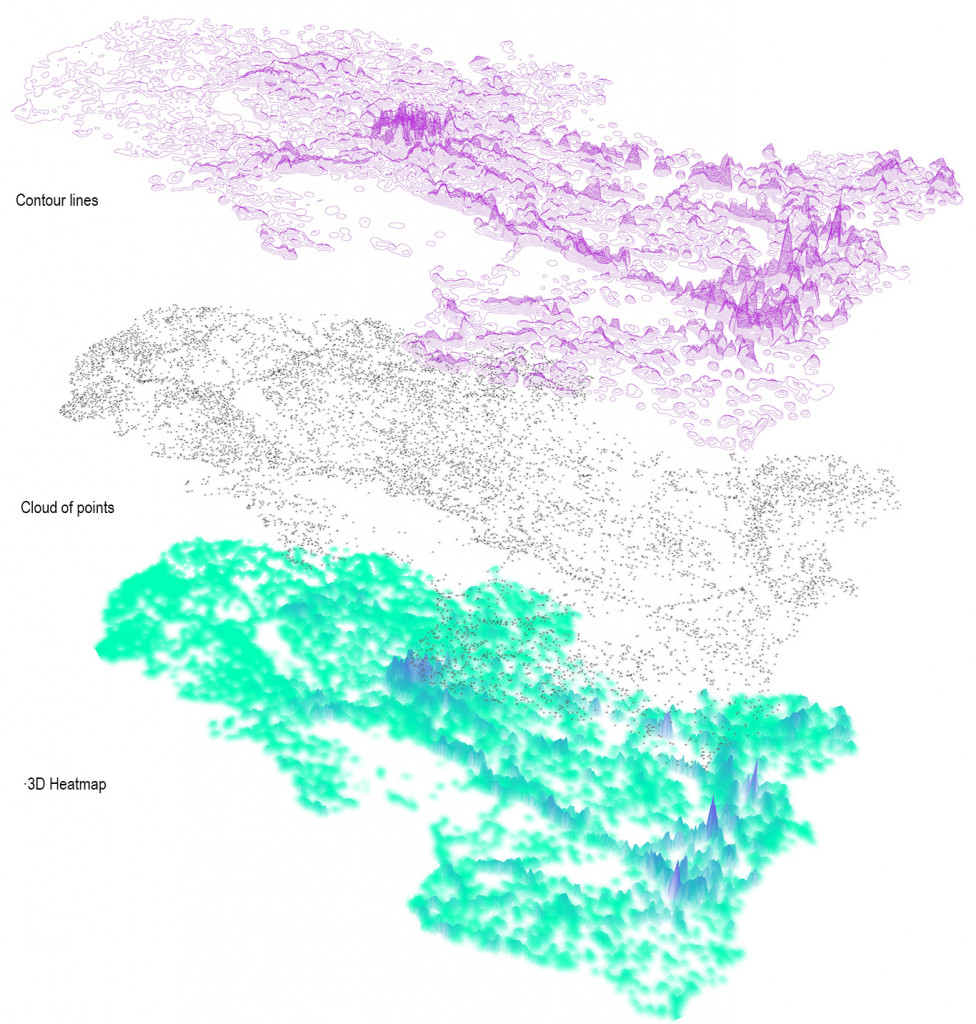
The idea is to create a heatmap in 3D to look for the best paths of the Circuitscape branches. For achieving it, we will have to create a procedure in Grassopper.
- Create points from a mesh that is capable to recognize the closest points of the elements that want to be analyzed (natural areas and abandoned crops). By using KDTree a cloudpoint is constructed.
- Attributing to this cloudpoints the values of the Circuitscape data collection and creating a 3 Dimensional model of this heatmap based on ecological connectivity.
- Creating the contourlines of the 3D heatmap to visualize the best paths of ecological connectivity.
Methodology visualization
Process
- The mesh subdivision was chosen when it arrived to an equilibrium.
- The range of the influence for the output of the cloud points was selected when it managed to represent the connected densities.
- The heights of the 3D visualization were chosen for the best visualization purpose.

Process of creation
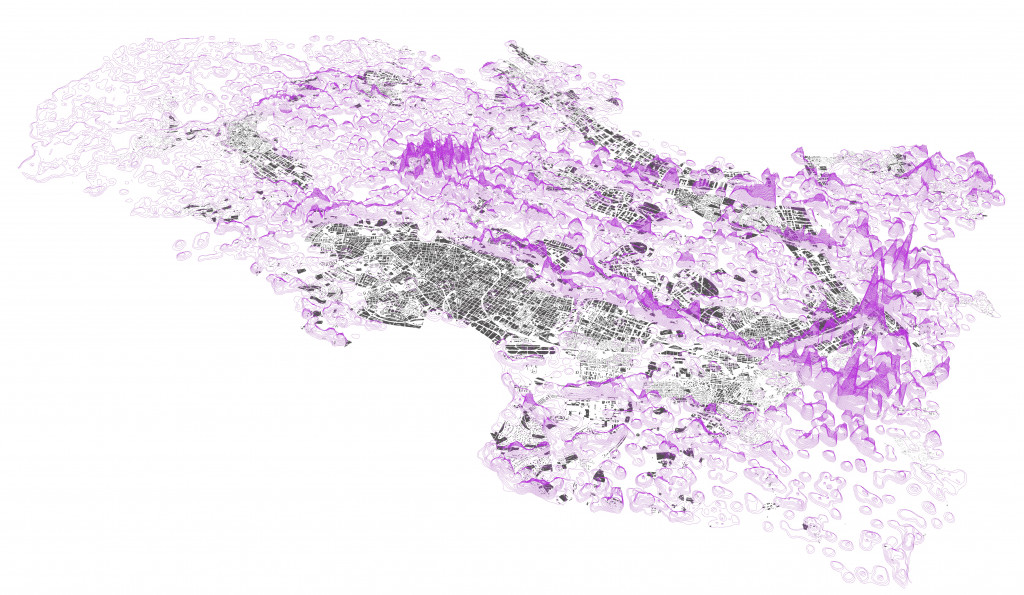
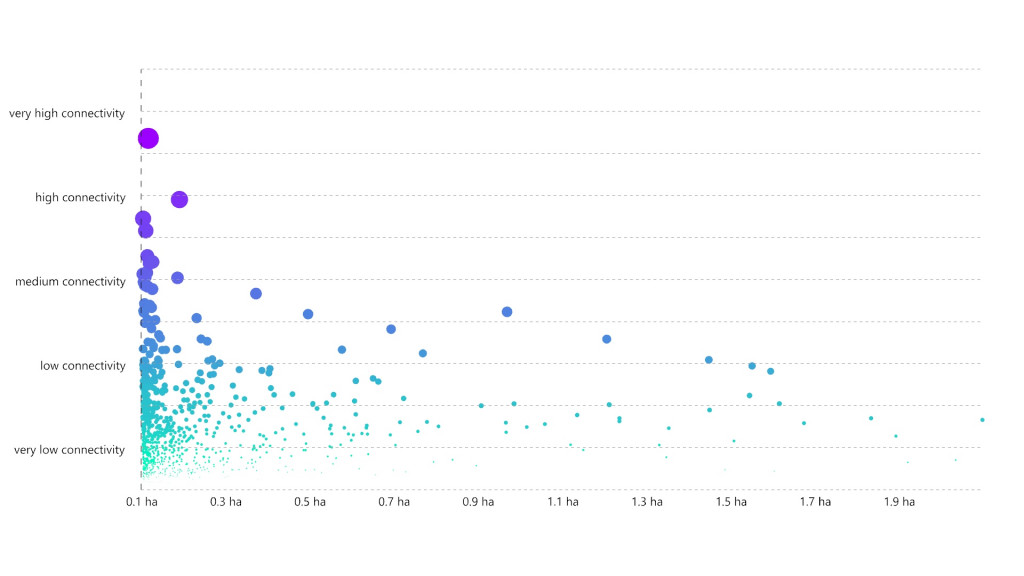
Output
- The first output is the 3 dimensional model of the ecological connectivity. Best paths inside between natural areas are highlited and help us to choose the better paths for pollination.
- The second output is the graph of correlation between the abandoned crops ecological performance and their area. As we can see, The smallest abandoned crops perform better in the ecological performance of this area.
Source: Institut Cartogràfic i Geològic de Catalunya & Circuitscape
E-connectivity waves is a project of IAAC, Institute for Advanced Architecture of Catalonia developed at Master in City & Technology in 2020/21 by student: Adriana Aguirre Such, and falculty: Eugenio Bettucchi & Iacopo Neri