Paul Rudolph said, the way we move our environment directly affects our “perception of distance, attitudes and physical and social relationships”
For millenia there has been tension, a struggle, between users and designers.
Whether for the purpose of militaristic efficiency, display of governmental power, religious homage or the intent to bring order and logic to a chaotic world, planners and designers have been trying to impose rigid structure onto our urban environments.
While straight lines and orthogonal grids are often accepted by designers as a modus operandi, it often leaves something to be desired.
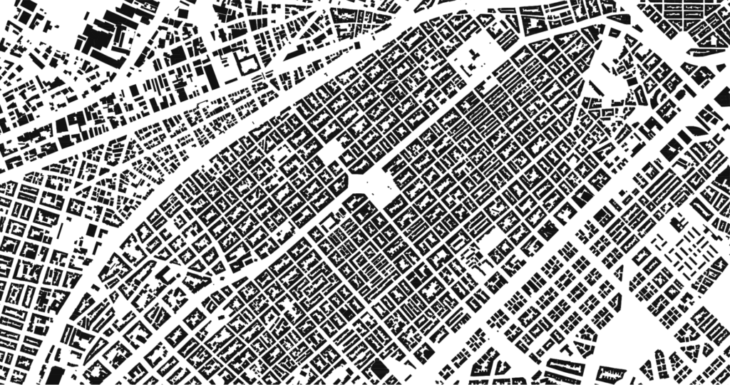

In Barcelona both scenarios can be seen, where organic growth in the middle ages gets a large expansion as it grows into an orthogonal city in the 19 Century
The metropolitan area of Barcelona is home to 3,239,337 people in a territory of 636 km2. The occupancy goes to 48% of the region built and only the 3% of this are parks.
As architects we need to create a collaborative process that goes beyond the buildings, to include the surronding infrastructure, services and landscapes.
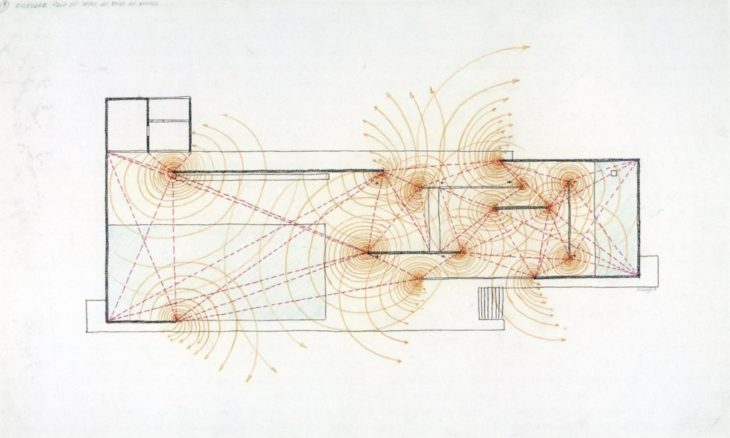
The design always came after the observation of the human behavior in the spaces. Like Paul Rudolph said in his analysis of the Barcelona Pavilion, we are looking for spatial experience but the normal speculation is very inadequate.
Looking at this figure ground relationship, accepting or ignoring the will of the users will have a knock on effect as we’re left with either the voids between obstacles for our circulation, or we can allow this to be flipped, and develop within the void created by our movement and interactions. While the stage is already set and the paths have all been already paved, there is opportunity to shift this way in thinking, starting closer to the human scale. Users are always going to look for the easier way to go from point A to point B.
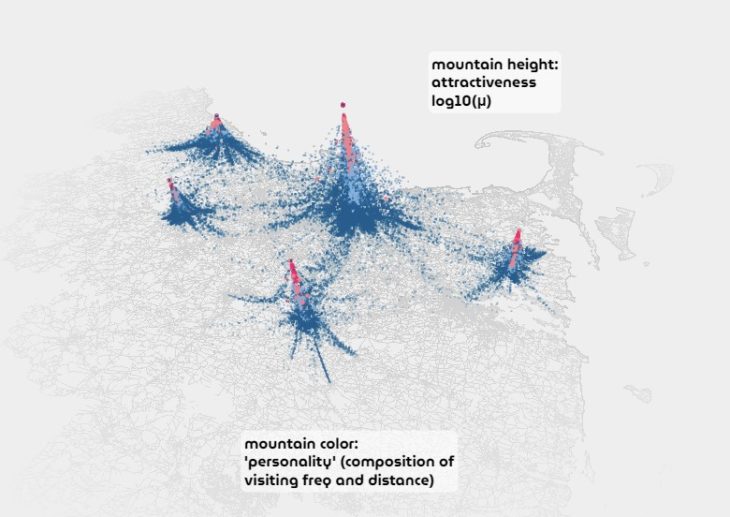
Human mobility analysis at the city scale in Boston by analyzing large-scale cell phone data. They found that the flows to all locations in a given city follow a predictable and universal pattern, that is: the number of visitors to any location decreases as the inverse square of the product of their visiting frequency and travel distance.
We want to use AI & CV to map mobility and identify negative spaces to inform urban landscapes
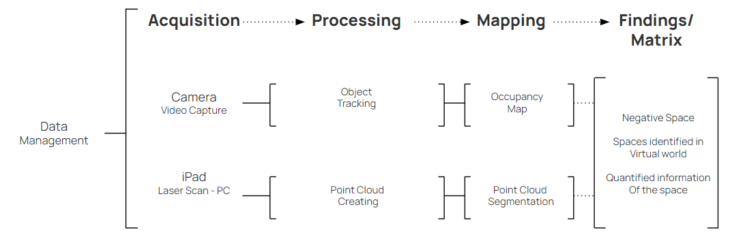
Data Management
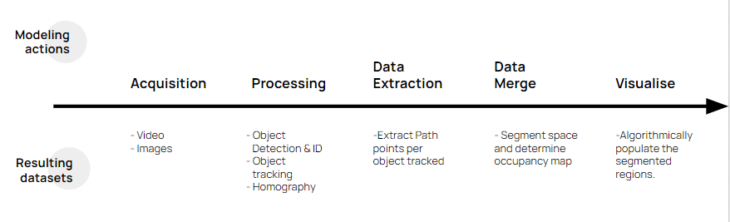
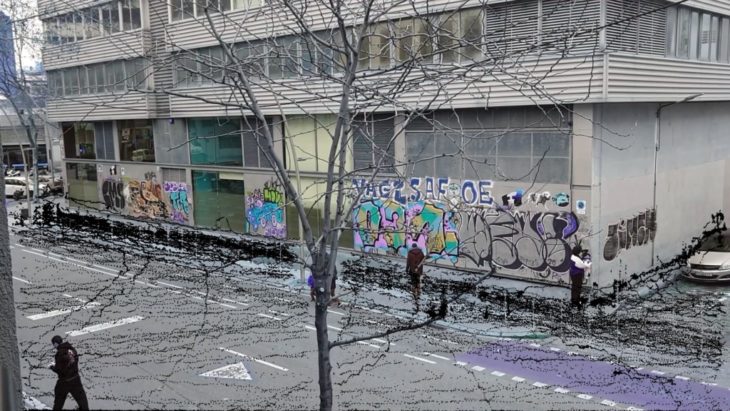
Video and point cloud documentation were implemented as methods for tracking, mapping and identifying users in the site. Video footage is recorded as raw data from a camera feed. The raw data is processed through computer vision and the vectors of people trails are extracted as coordinates. Integration of landscape form and aesthetics with landscape analysis and indexes.
Data acquisition
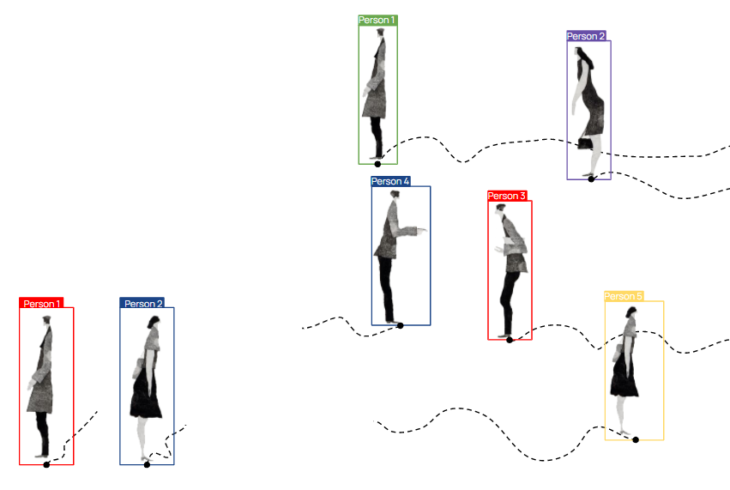
Multi target object detection using YOLOv4 with DeepSORT for data association. We link detections that belong to the same target and assign an ID to each unique object in each class.
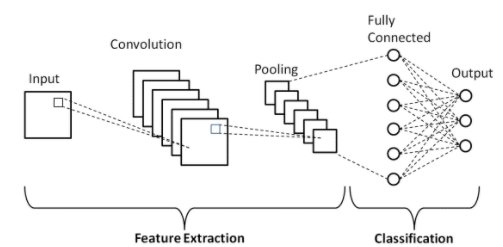
Object Detection and tracking
From the Yolo algorithm we obtain the bounding boxes of each class object. We track the bottom edge and append the coordinate values to a global variable list.
</p>
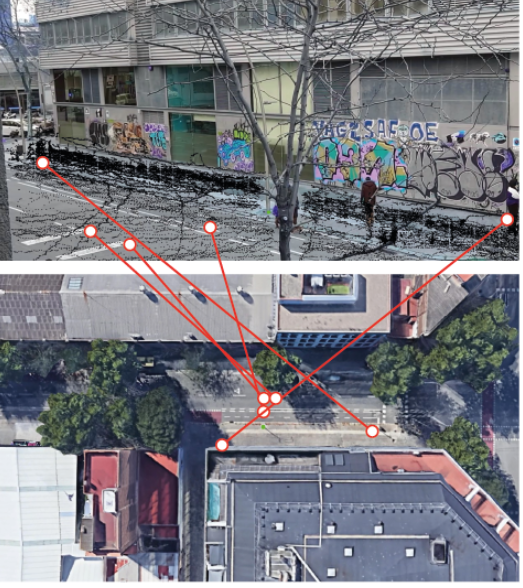
Homography
In order to generate a 2D representation of the points, one needs to find the relationship between the perspective angle of the camera and a top view representation.
Since it was impossible to get a top view image, an image was extracted from Google Earth.
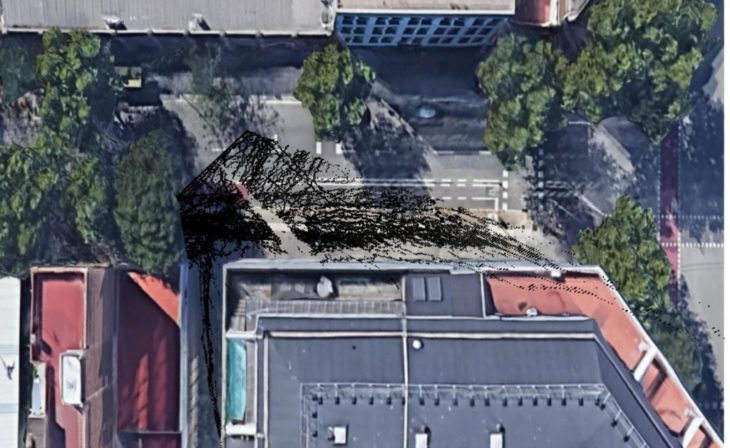
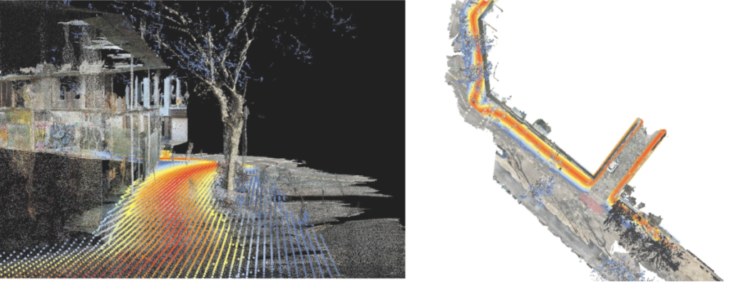
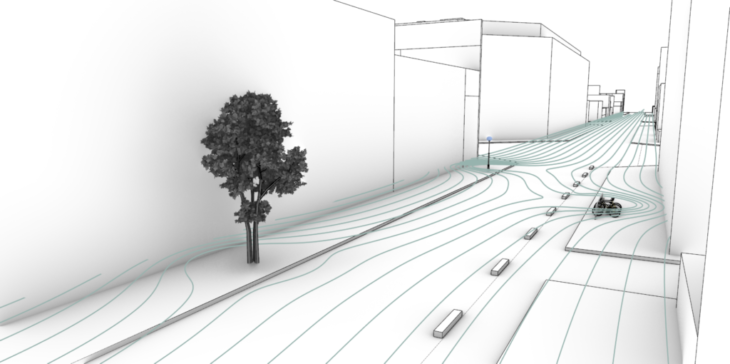
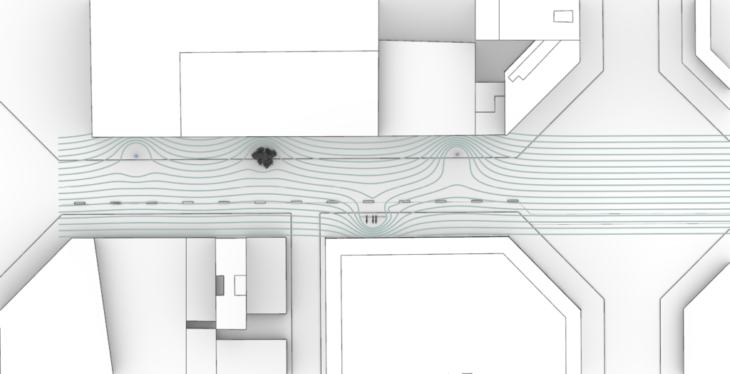
After obtaining the path points in plan view, we can iterate through the points and visualize the movement of people throughout the day. By dividing the city into grids, we can visualize the occupancy of each grid by counting the number of people passing in that grid at a certain moment.
Data management in point cloud
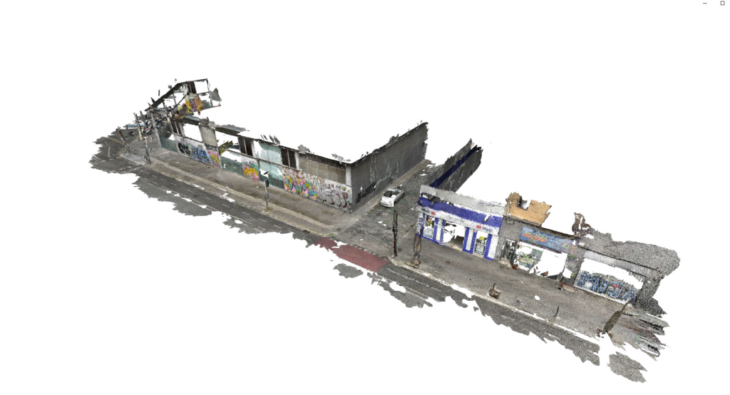
Point cloud documentation as a method for mapping and translating real 2D data into a virtual world. Acquire point cloud as raw data. The raw data is processed through Open3D for downsampling and segmentation. From the segmented planes select the working plan. Recolour the points of the working plane according to the occupancy map. Segment the recoloured point cloud to identify less used spaces
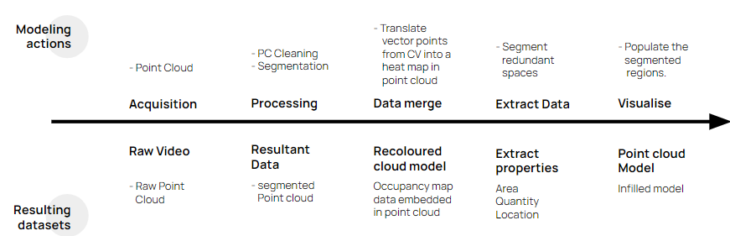
Data acquisition
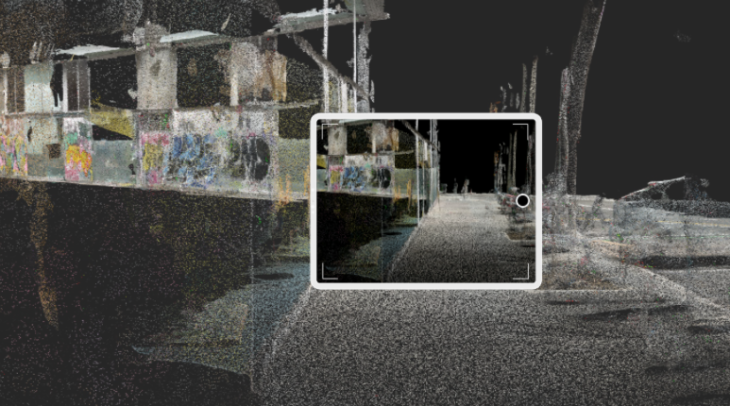
Device: Ipad LiDAR Scanner Output: Point Cloud
Segmentation
Point Cloud is downsampled using open3D. Downsampled point cloud is segmented based on planes
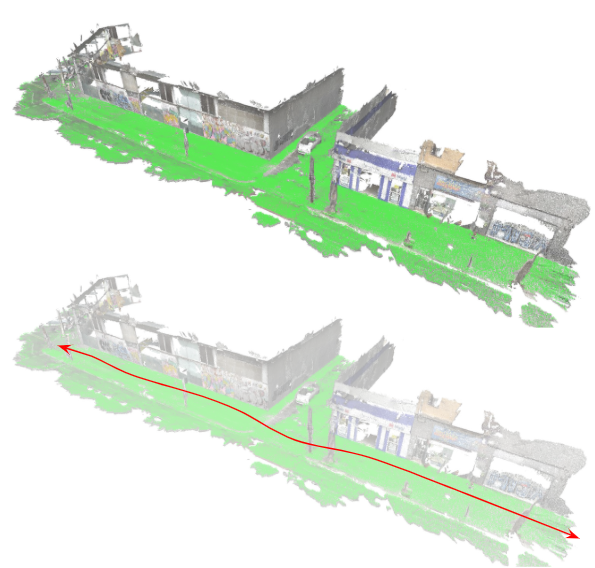
Data Merge
Segmented point cloud plane is merged with the vector data that of the computer vision to create an occupancy map.
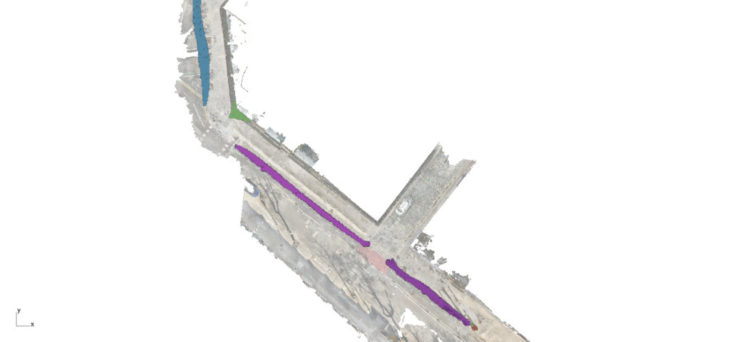
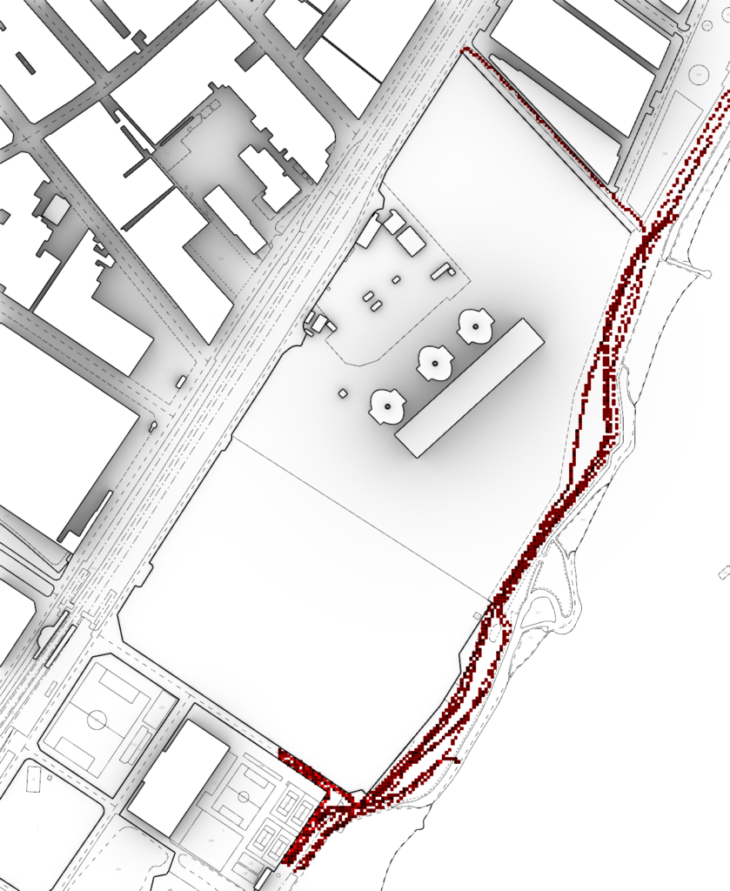
Occupancy map

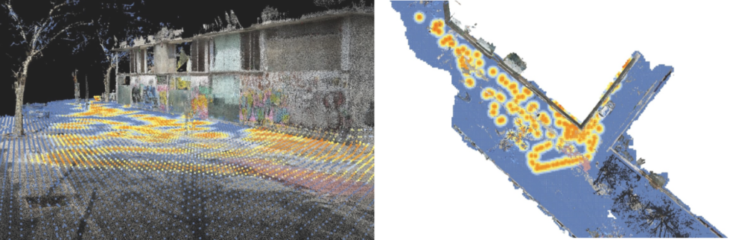
Voids
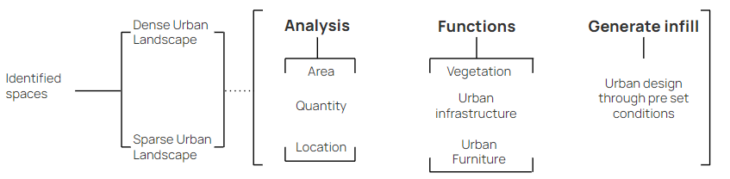
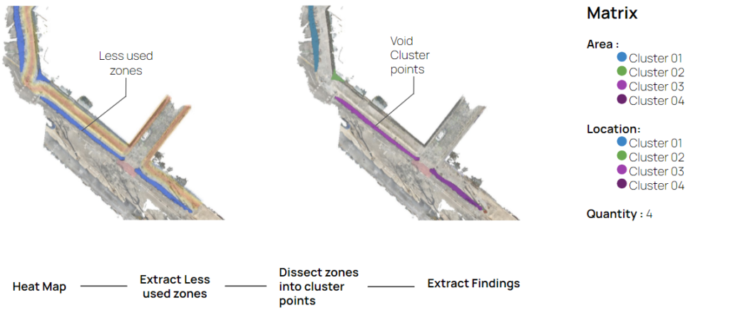
The heat map provides crucial data about less used urban spaces. These pockets of void can be segmented and it’s properties can be extracted as a matrix to aid urban retrofit.

Data Flow Diagrams
The SuperBlock
Combining data from street cameras and merging data powered by computer vision, one could begin to have an image of how space is occupied in a broader context, and get insights on how to improve it.
</p>
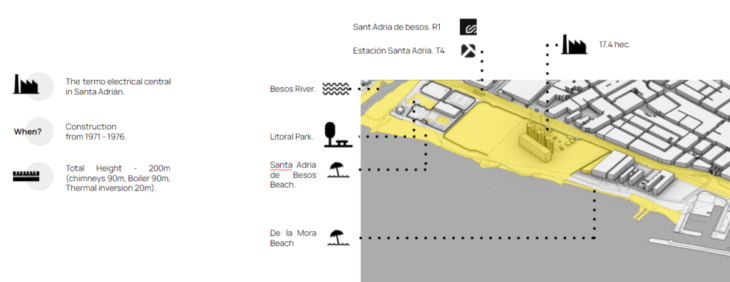
The site
Les tres Xemeneies.
Occupancy Map
Sources
-
https://schwarzplan.eu/en/
-
https://schwarzplan.eu/en/
-
https://www.amb.cat/en/web/area-metropolitana/coneixer-l-area-metropolitana/poblacio
-
https://www.amb.cat/en/web/area-metropolitana/coneixer-l-area-metropolitana/poblacio
-
The range of urban design approaches compared to other disciplines and scale, inspired by Roger Evans’ Shaping Towns presentation on scale and process (Bristol, 2012)
-
-
https://senseable.mit.edu/wanderlust/
-
https://www.giscloud.com/about-us/
-
https://senseable.mit.edu/desirable-streets/
-
http://www.icc.cat/appdownloads/
-
https://vtx.vt.edu/articles/2014/08/080514-vpa-drillfieldpaths.html
-
-
https://weburbanist.com/2015/10/20/holloway-roads-tunnels-eroded-by-peoples-passage-over-time/
Dis(Occupancy) is a project of IAAC, Institute for Advanced Architecture of Catalonia developed at Master in Robotics and Advanced Construction in 2021/2022 by:
Students: Andrea Nájera, Alfred Bowles, Shamanth Thenkan, Robert Michael.
Faculty: Aldo Sollazzo, Keith Kaseman
Assistants: Maria Espina, Oriol Arroyo