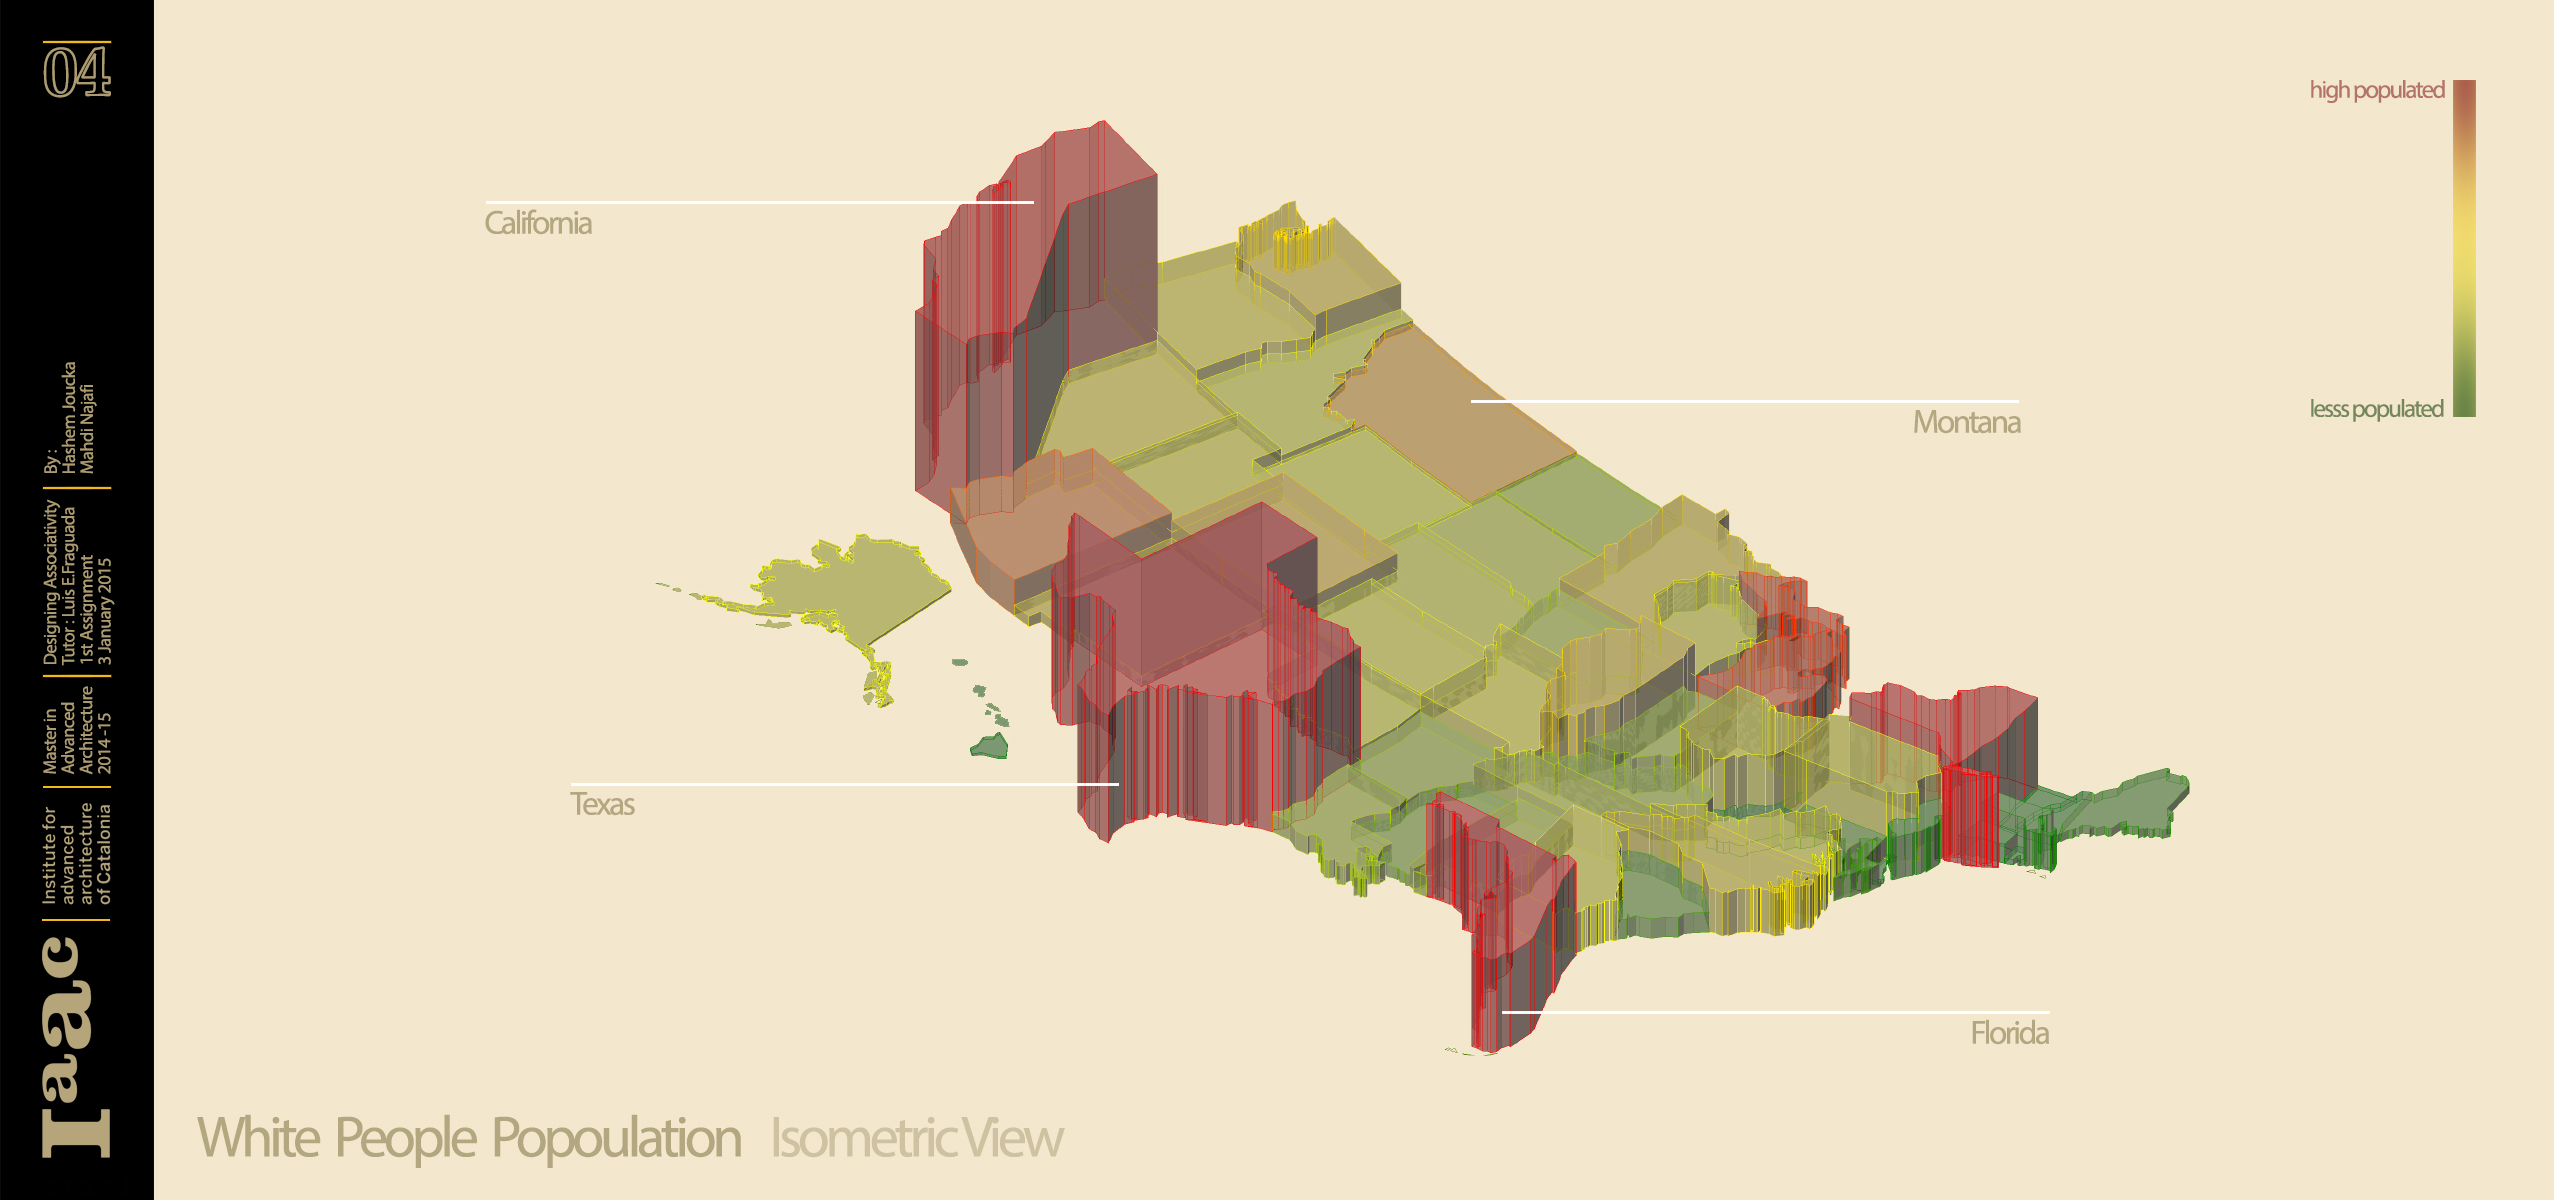
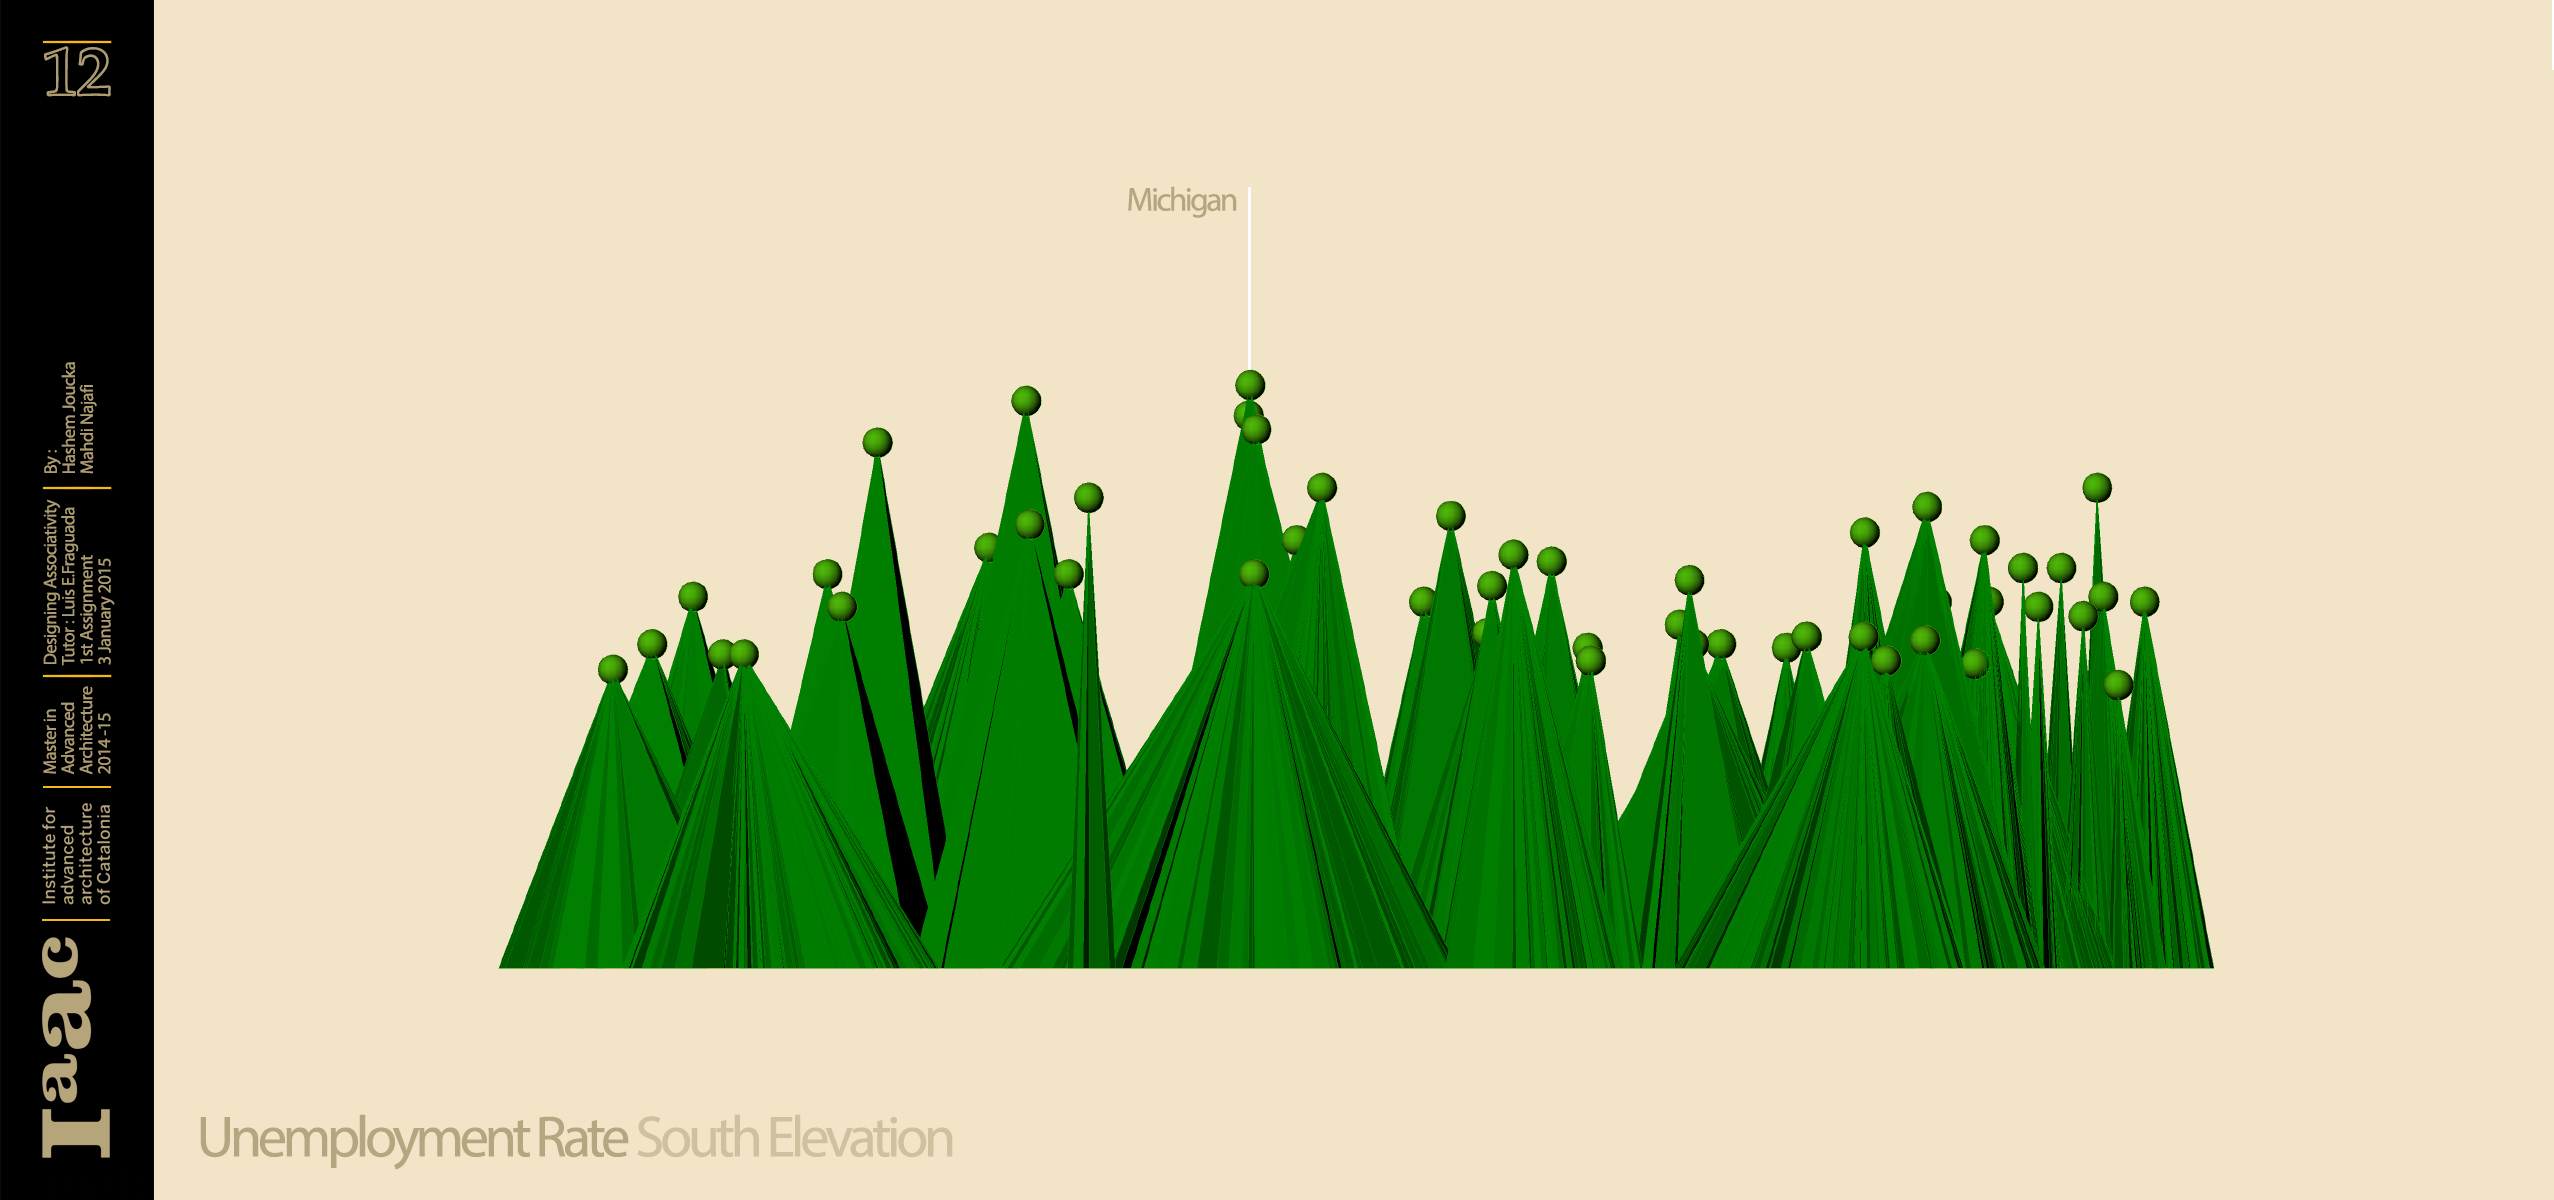
Data visualization is a set of processes which is like an umbrella that covers both information and visualization simultaneously. Data visualization is easily comparable and comprehensible and helps us build deep insights about a problem and promote clarity when it comes to finding trends and patterns to predict the future or analyze historical scenarios. This study aims to visualize 4 different sets of statistical data collected in 2008 about research conducted on the United States of America which ranks the states depending on: { White population } { African american population } { persons 25 years old and over with bachelors degree or more } { Unemployment rate } BY: HASHEM JOUCKA & MAHDI NAJAFI