Demographics of Mobility – Dubai
The aim of the project was to examine the relationship between transport inequalities and social exclusion. What leads to the transport inequalities? And what could we do to minimalize them?
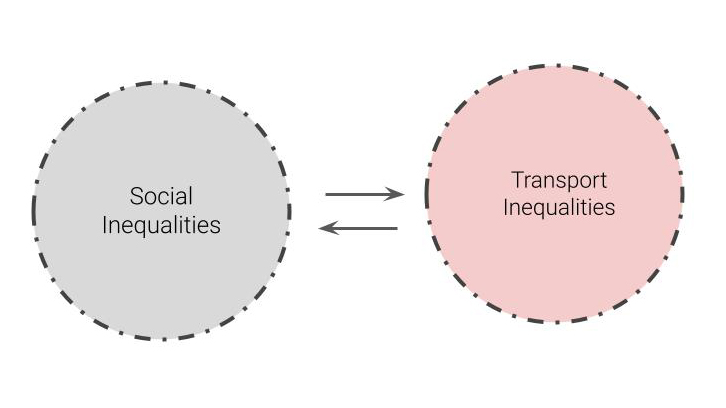
First, to understand what factors and indicators are connected to transport poverty, after number of readings we have created a list of indicators and we divided them into two categories. First category, social disadvantages, includes: unemployment, poor academic level, large household size and low income. The second category, transport disadvantage, includes poor services, lack of bicycle lines, high cost of fares and insufficient network.![]()
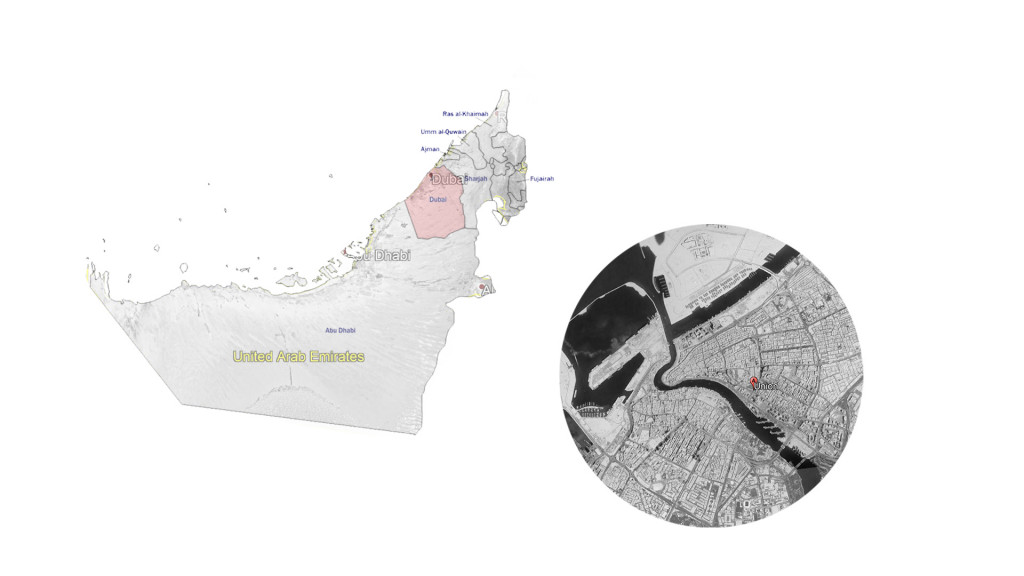
For our site we chose Dubai.
We started from Analyzing the whole city through Statistic analysis. When looking at vehicle usage, we can clearly see that only 14% of people are using public transport, 12% of citizens are mostly walking and 0 % are using bicycle.
We have also mapped the density and income on the map of Dubai. The relation between those 2 factors is strong. The most populated district are the poorest one.
When studying the mobility map, another interesting fact appears- the poorer area (right site of the canal) there is low number of bicycle paths in compare to richer area (left site of the canal).
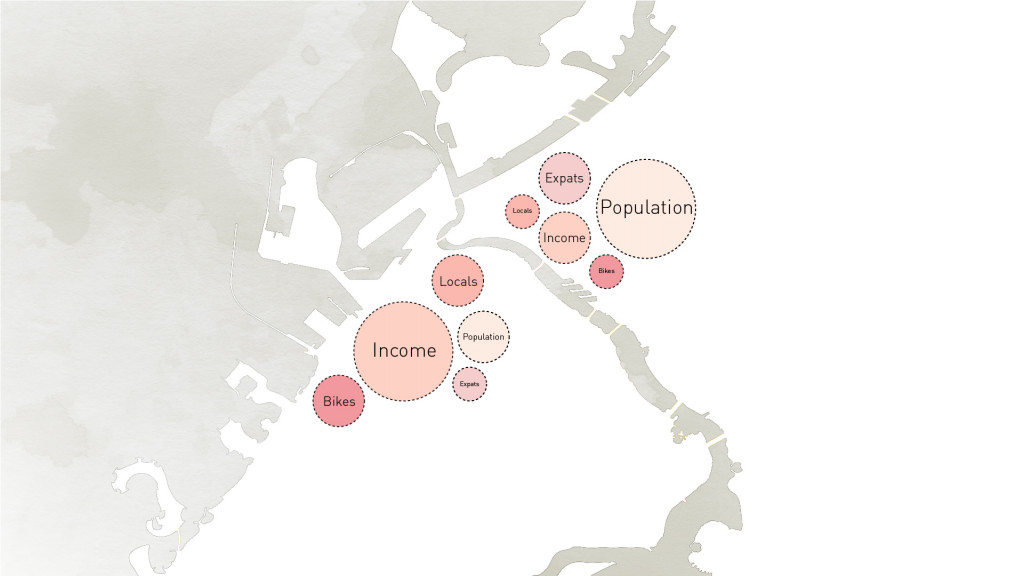
Given all these statistical and territorial analysis we were able to extract some information on the transport poverty that exists in this area. The image below shows a diagrammatic representation of the inequalities in the city.
After this analysis the choice of the site was clear. Union Metro Station , the place which is located in the poorest area, but is also a crucial transfer point for the people coming to down town from many different directions.

There are 2 metro lines (A and B), transfer bus station ( for the people coming from surrounding cities such as a Sarjah), number of parking for the people arriving by car and changing here to subway.
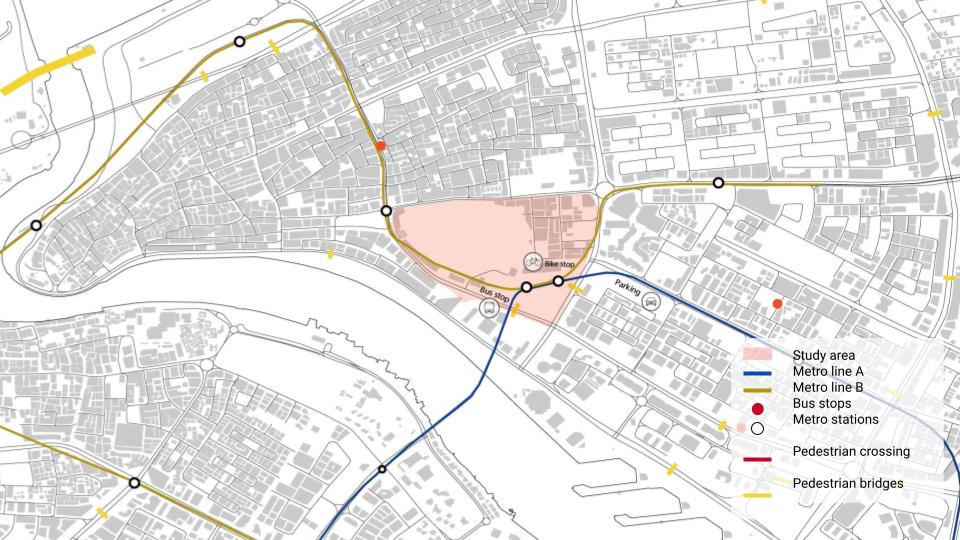
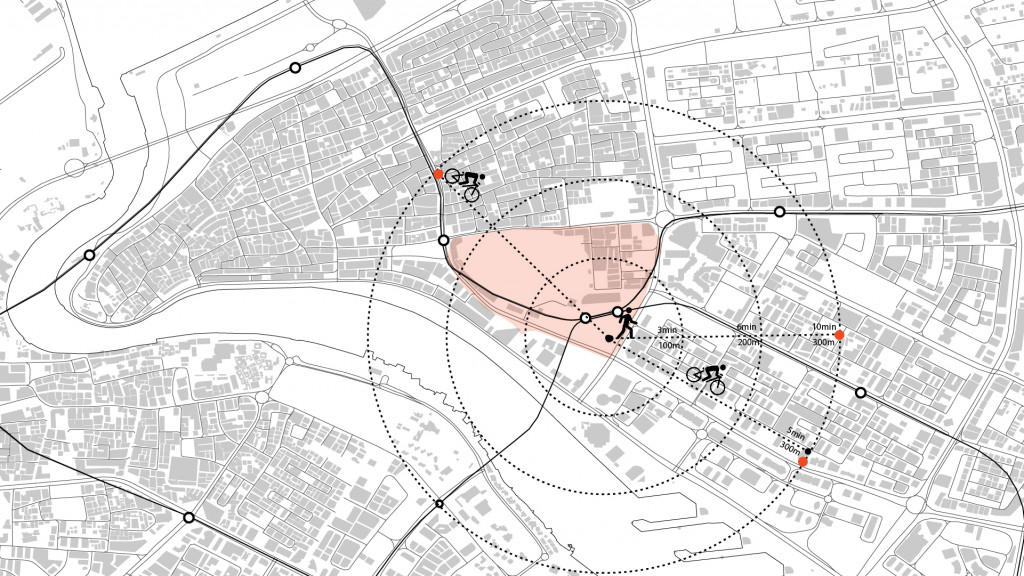
The station is surrounding by highway and busy streets, there is lack of pedestrian crossing, people need to often add 5-10 minutes of walk to rich the station , or risk their lives crossing the streets illegally.
Our proposal is to introduce soft mobility solutions, from pedestrian crossing to bike line and through introducing those small interventions we understand that this will facilitate the multimodal mobility and allow more quality in transport
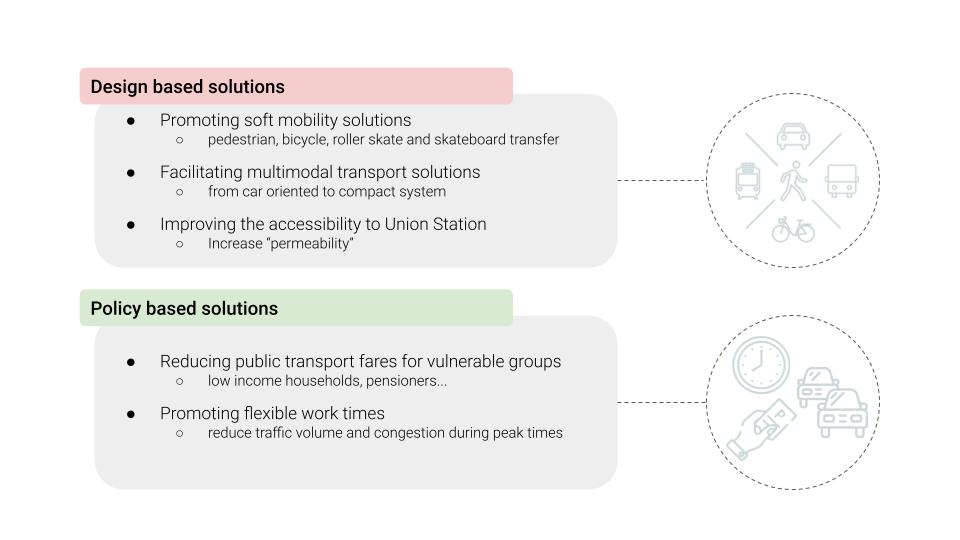
By introducing a new pedestrian crossing, reducing a speed limits, adding a bike lines, the connection would be improved a lot. We had introduced 3 interventions from the site.
1.) We can see that there is lack of crossing. People are crossing the street in random places which is dangerous for the and also can cost a high fine. Our proposal is to introduce a crossings every 200 m
2.) Reducing the speed from 60 km/h to 40 km/h, adding crossing and introducing a new bike line( as there is enough space)
3.)On the picture we see a man riding his bike on the pedestrian’ path. It is dangerous for pedestrian and for him. As intervention we put a bicycle line, making the bikers road safer and giving the pavement back to pedestrian
Demographic of MOBILITY – Dubai is a project of IAAC, Institute for Advanced Architecture of Catalonia developed at Master in City & Technology in 2020/21 by students: Hebah Qatanany ,Marta Galdys, Kshama Patil, Riccardo Palazzolo Henkes and faculty: Francesca Arcuri & Federico Parolotto.