ABSTRACT
The aim of the project is to explore the different possible solutions for the transformation and optimisation of the urban tissue of Delhi North East with Wallacei. The tool based on the biological principles of evolution allows the analysis and the design of those solutions, the optimisation was based on the problems faced by the city, such as the lack of public space, the uncontrolled increase in population and the lack of basic services such as water.
INTRODUCTION
Delhi North East is a city located in India, is known for being one of the most populated cities in India, the uncontrolled growth of the urban sprawl due to lack of urban planning, has generated that the city today has to face several problems such as lack of public space for being a very dense city, insecurity, environmental problems such as high rates of pollution, extreme temperatures and the lack of basic resources such as water, electricity and sewerage.
As a first step of the project an area of approximately 75 meters radius was selected, the selected site has common elements of the place, such as high density, makeshift terraces, big urban sprawl and lack of public space between houses. This model serves as the basis or Primitive phenotypes for the design.
Problems Delhi North East
CONCEPT
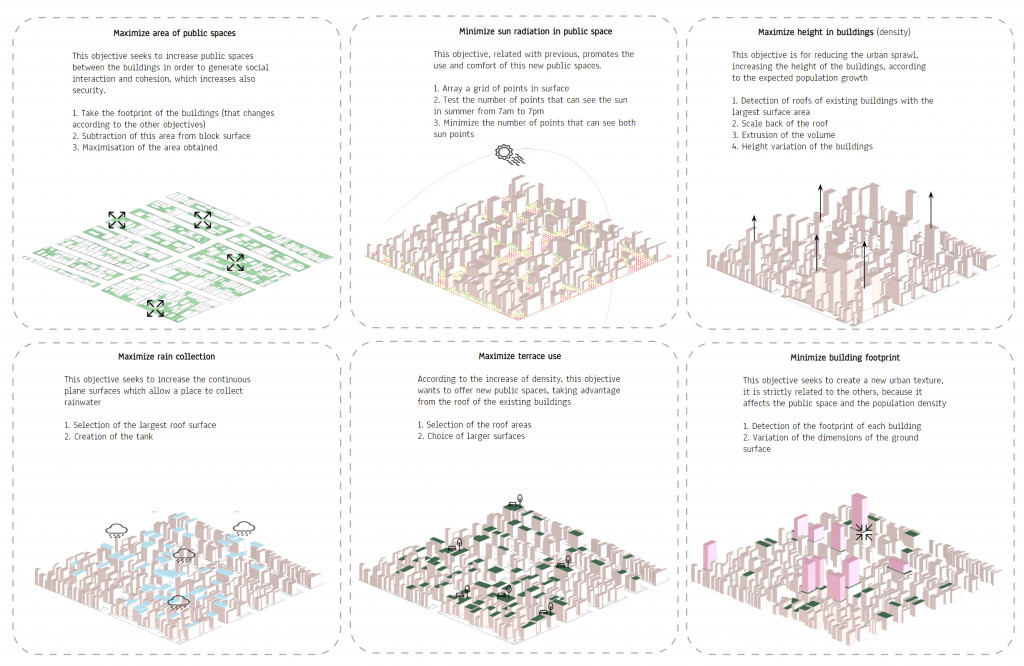
The project is based on the following objectives or Fitness objectives determined by the analysis explained above, these are maximize public space area, minimize sun radiation in public space, maximize rain collection, maximize height in buildings (density), minimize building footprint and maximize terrace as a meeting space for the residents of Delhi.
Fitness objectives are linked to genes, which are the parameters used to define or measure the range of the intervention to be performed. The Evolutionary Matrix explains how each gene controls each fitness criteria.
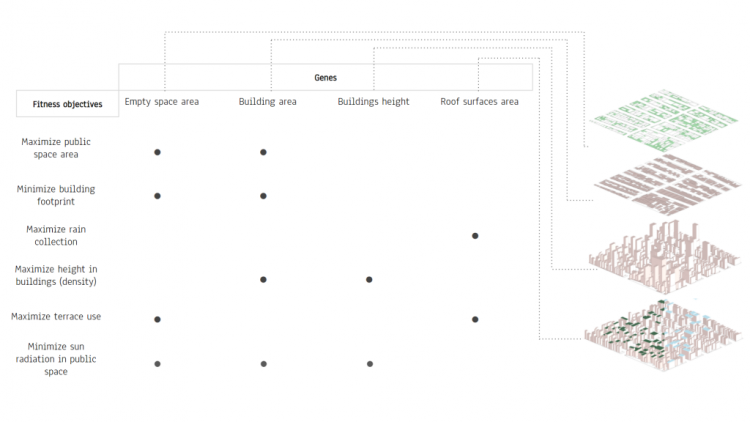
Evolutionary Matrix
METHODOLOGY
An intervention phasing is developed based on the fitness objectives. The existing residual spaces were used and increased in size based on the footprint of the existing buildings, for the increase in density the existing buildings were used as a base and those with a larger surface area were selected for the increase in density in height with the new towers new towers with a maximum of 8 stories, as part of the design the terraces with a larger area become meeting spaces and are the base of the new towers proposed for the increase in density. The new buildings are used as elements to protect the solar radiation of the new public spaces and public terraces, for the collection of rainwater tanks are located in the buildings with greater surface area on the roof, these tanks are proposed as communal to supply an alternative supply to the public water network to all citizens and for the maintenance of the new green spaces.
Methodology – Intervention
SIMULATION
As part of the process in the use of Wallacei, several simulations were carried out to analyse the conflicts that existed between the different fitness objectives, for the analysis the graphs provided by Wallacei were used in each simulation, these allowed to detect the conflicts of the different options, in addition to the graphs, each 3D model generated by the programme was analysed to understand which is the worst and best solution according to the evolution.
As part of the exploration of the tool at the beginning we combined four fitness objectives and the five objectives were integrated, this process allows to find the best solution between them, these experiments allowed us to adjust the genes according to the conflicts that the program showed in the graphs.
Simulation 1
The objectives for the first simulation were four: maximization of the area of public spaces, minimization of solar radiation, maximization of rain water collection and maximization of density (maximization of buildings heights). As part of the analysis, the Pareto Front Solutions were exported to understand all the possible variables of the model that the tool generated in the simulation.
Pareto Front Simulation 1
The results in the graphs show a series of solutions that could be considered acceptable, because in the standard deviation graph we can notice a jump of the curve on the left from the first generations to the latest and the general trends appear quite good. the only anomaly can be highlighted in the graph of the trend of the standard deviation, because at the end it has a strange and unexpected increase.
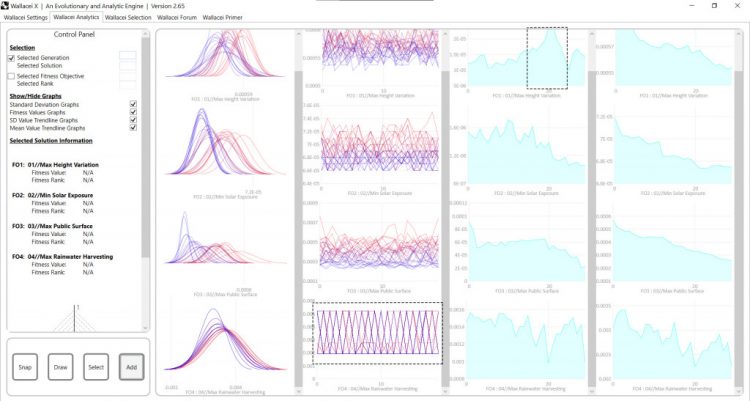
Graphs Simulation 1
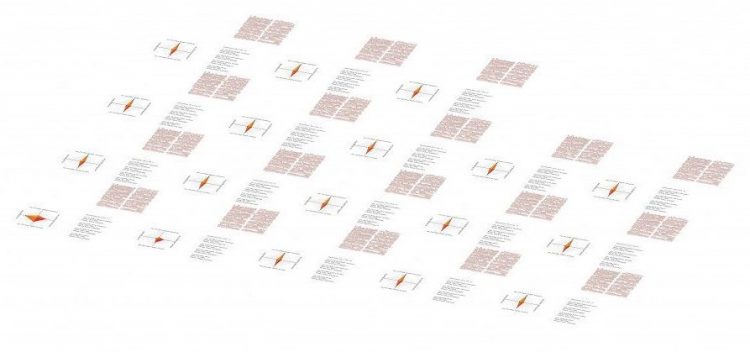
After several simulations we were able to select the best options according to each fitness objective analysed, this analysis allowed us to select which model meets the design parameters we are looking for.
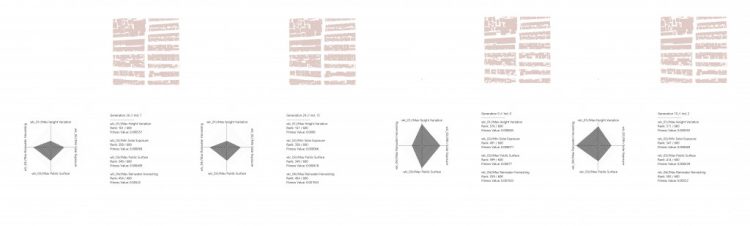
Best Solution per each objective simulation 1
Simulation 2
The second simulation includes a new set of five objectives, such as the maximization of the area of public spaces, the maximization of rain water collection, the maximization of density, the minimization of the footprint of the buildings and the maximization of the use of terraces as new public spaces.
We ran this simulation two times, with a different number of solutions in order to explore and understand better the evolutionary engine, in the first case, the population size of the simulation was composed of 5000 individuals, while in the second case it was made up of 7200 individuals. The increase of the population could allow us to reach a better optimization for the proposals.
In this first case, if we look at the graphs and the trend of the curves, it is possible to notice that for the first three objectives, the results appear pretty good, while for the last two, the evolution of the population does not go as expected.
Simulation-2-1
In this second case, if we look at the graphs and the trend of the curves, it is possible to notice that for the first and last objectives, the results appear pretty good, while for the last three, the evolution have some conflicts. This analysis with a high population allowed us to have better results than the previous ones as we can see that there are conflicts in the objectives as mentioned above but as part of the spatial analysis there are more visible and quantifiable options, so that as designers we can choose the best option based on our criteria as designers.
Simulation 2-2
As a final part we used the Wallacei cluster option in the second simulation, this option allows us to visualise and analyse the best option according to the tool, it fulfils all the criteria of the fitnes objects. This solution is based on finding a middle point between the objectives set. In this case we analysed the option of two clusters, the two resulting options were very different which gave us a satisfactory result, these different solutions can be applied in different parts of the city of Delhi, creating a diversity of design fulfilling the desired objectives.
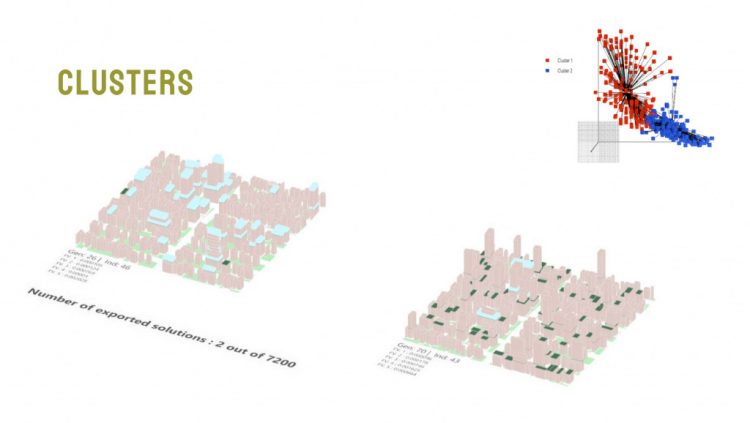
Cluster
CONCLUSION
In conclusion, Wallacei can be a tool with a great potential in urban design as its theory based on the evolutionary computation allows the different designers to have an infinite range of possibilities, which can be measured with graphs and analysed volumetrically which is even useful to socialise and indicate the ideas to governments or even citizens, as part of citizen participation. In the case of Delhi, the final result of the clusters confirms the potential of this tool, since as designers we can implement these optimal models in the urban context, the results allow us to propose diverse spaces in the city, which meet the objectives set out in the design, to improve the quality of life of the citizens of North East Delhi.
Delhi Restatement is a project of IAAC, Institute for Advanced Architecture of Catalonia developed at Master in City & Technology in 2020/21 by students: Miguel Tinoco, Matteo Murat and Kevin Aragón and faculty: Milad Showkatbakhsh