Data Workflows: Stalking Yourself
Today, most of us have access to some device that is capable of tracking movement through GPS. While the data which results is of a very simple nature (latitude, longitude, timestamp), there is a lot to discern about where we spend our time, how we get to places, and even perhaps, places we go that we’d rather keep secret.
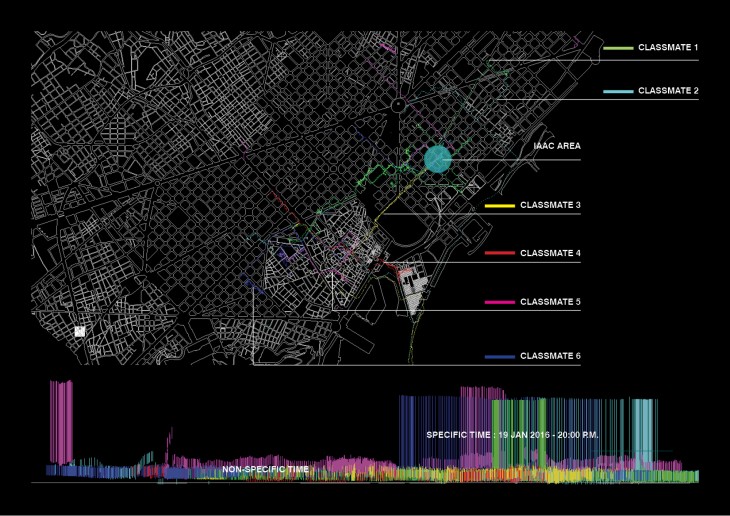
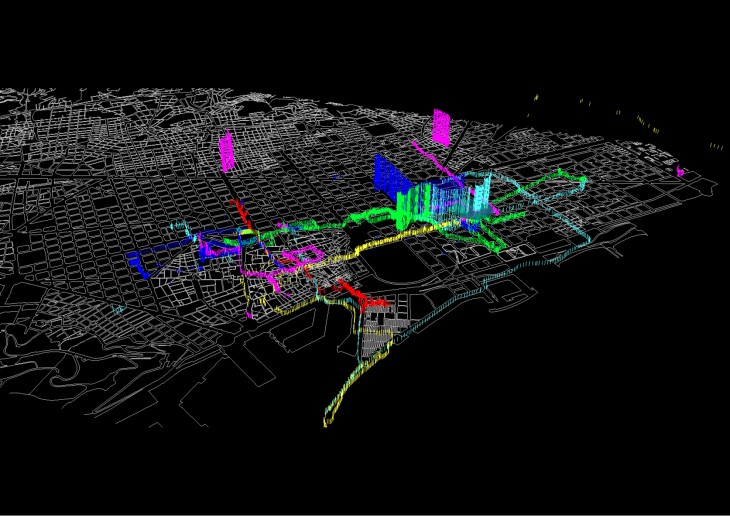
The map represent the tracking data of 6 classmates through the lines showing how they travel around Barcelona and go to IaaC.
Diagram below the map show how to specify the data in order to see
the people who attended the IaaC lecture series through the long lines by selecting the tracking points that have time data which are 19 JAN 2016 – 20:00 p.m.
(lecture series day)
Conclusion
For the hypothesis about who attended to the lecture series, the long lines in the circular area show the classmate 2 (blue color) went to IaaC on 19 JAN 2016 – 20:00 p.m. but someone also went around the IaaC area at that time.
However, the map can not show the precise data because some data on that time are missing because they did not record data on that time and somehow the latitude and longitude can be shifted for instance there is no long line happen with red and yellow line and the dark blue line is not inside the IaaC area.
Data Workflows – Stalking Yourself is a project of IaaC, Institute for Advanced Architecture of Catalonia, developed at Master in Advanced Architecture in 2015/2016 by:
MAA Design Associativity 2016 : Assignment 1
Student: Inthat Ueasak-aree
Faculty: Luis E. Fraguada
Assistant: Rodrigo Aguirre