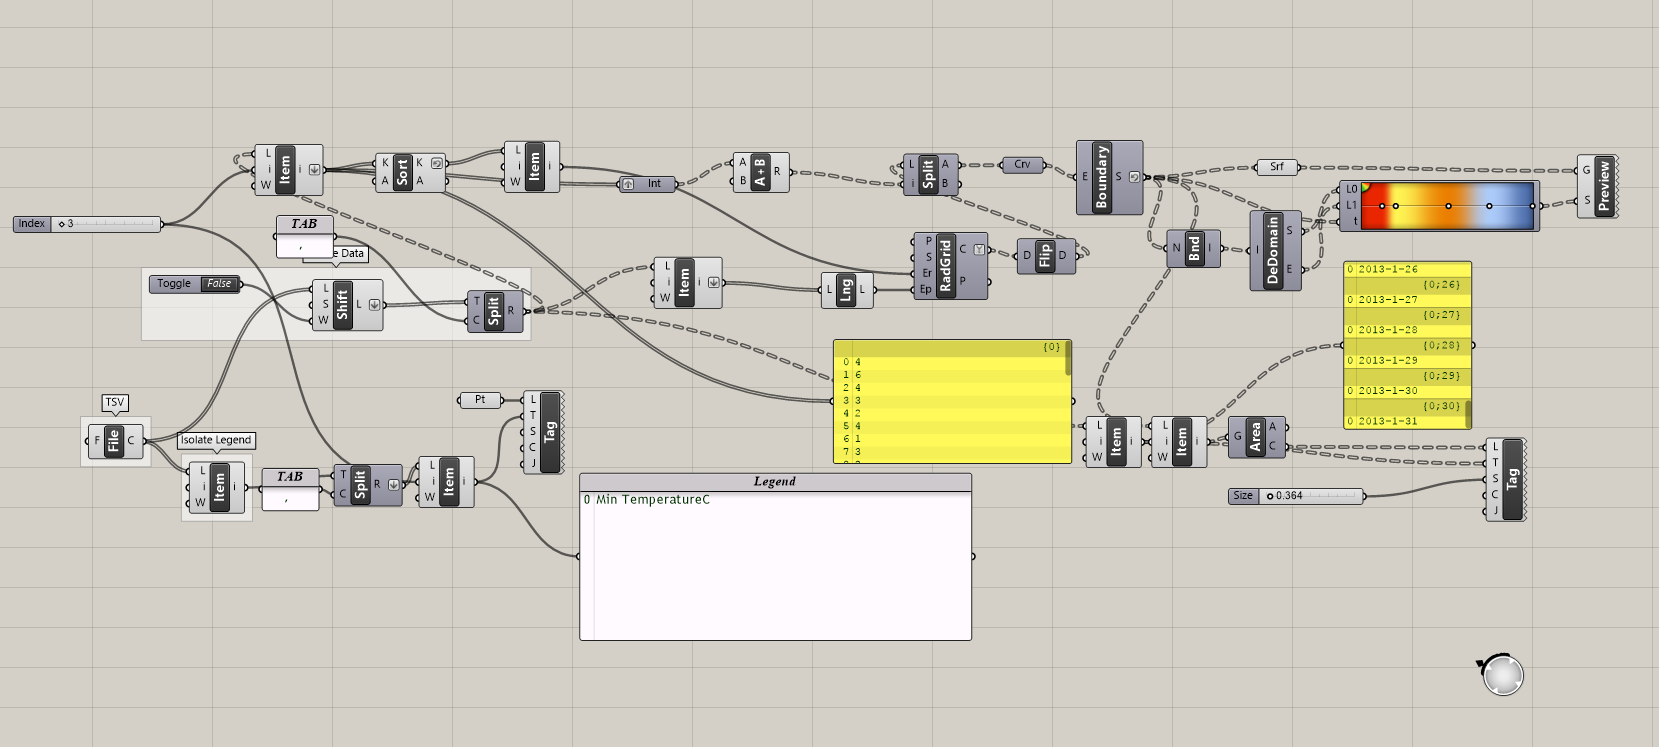
 the grasshopper definition for the data visualisation for the city of New Delhi’s climate data.
 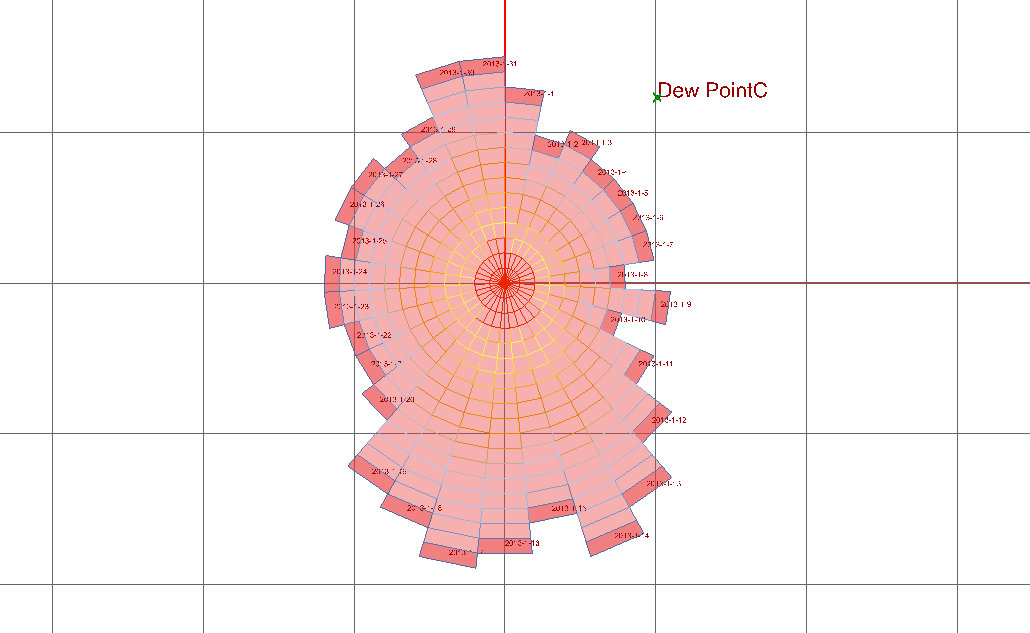 the graphic representation for the dew point temperature for one month
 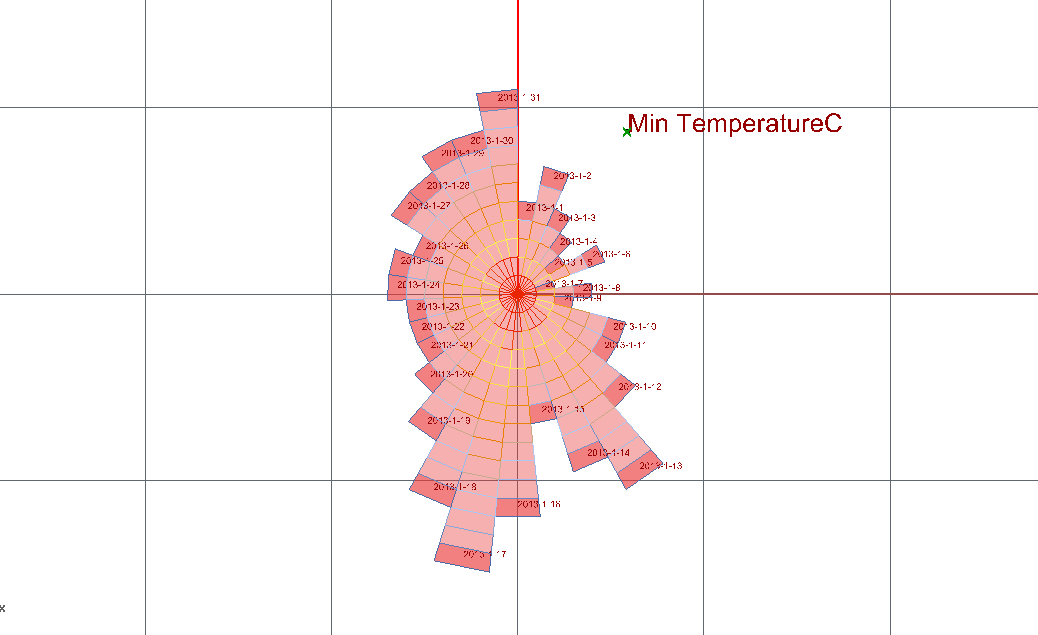 the graphic representation for the minimum temperature for one month
 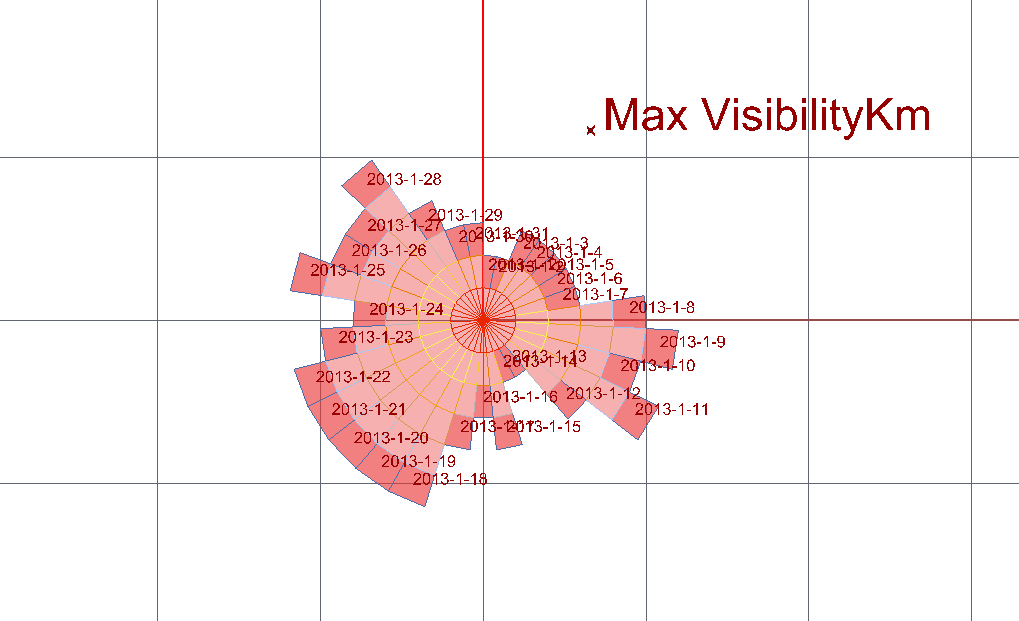 the graphic representation for the maximum visibility for one month STUDENTS: NEEL KAUL MEHMET YILMAZ AKDOGAN SHASHANK SHABADI