Data city: capturing, managing and analysing data for urban planning
Faculty: Mar Santamaria, Pablo Martinez
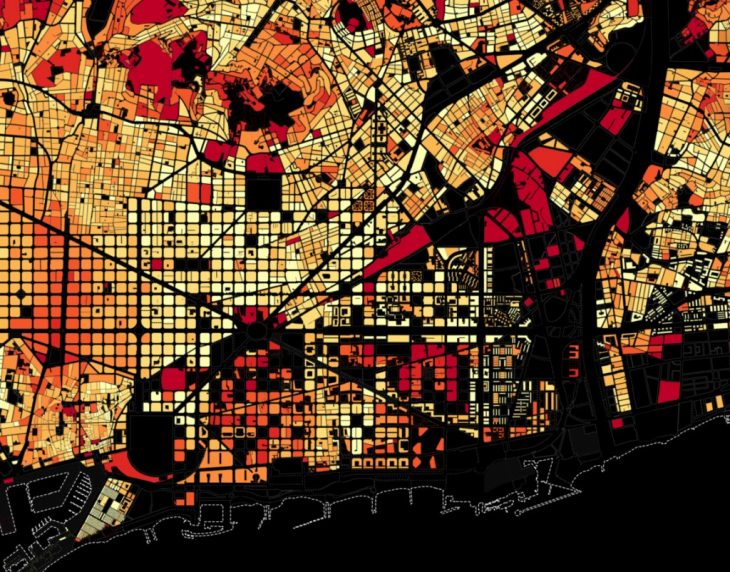
In recent years, a large body of research has investigated the potential of data visualization applied to urban design. Such proposals radically create new ways to depict subjective and objective mechanisms taking place in cities trough human-place transactions and collective dynamics -alongside the tools required to impact on them. Indeed, the analysis and visualization of Urban Big Data (citizens’ activity on social networks, traffic flows, etc.) approaches in a more accurate and flexible manner the representation and project of increasingly complex and changing urban environments. We can make visible several aspects of the city functioning that will go unnoticed by relying upon traditional cartographic information (topography, plot division, usage and neighborhood-level statistics). This ‘datification’ of the world enables the integration of multiple information in a unique representation to propose novel design strategies.
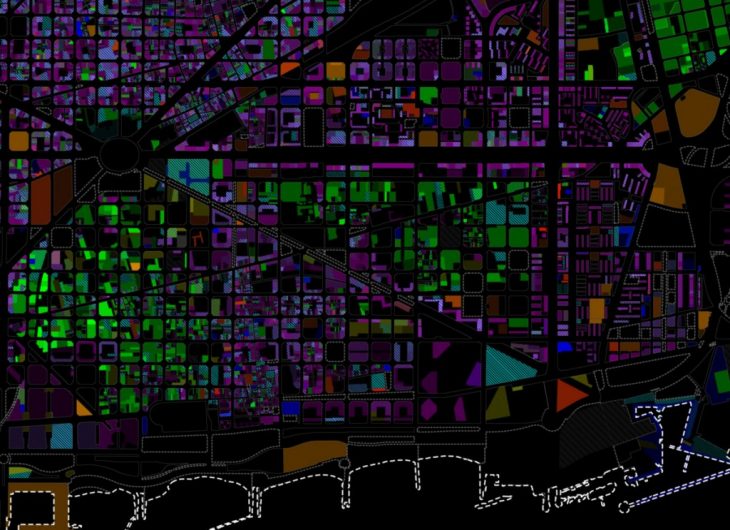
Productive City, 300.000km/s
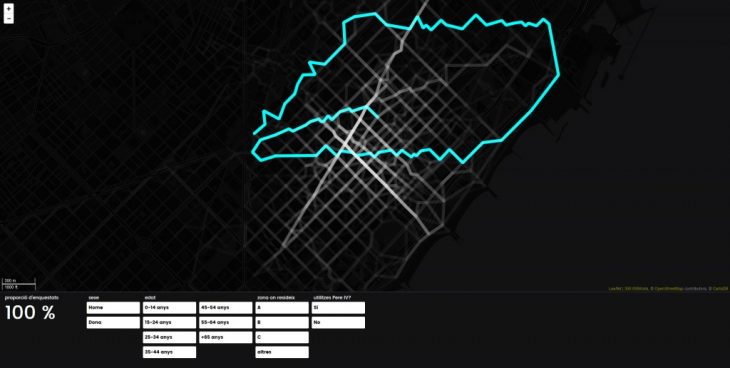
Using Barcelona as case study, in this seminar, the students will work with different tools that will allow them to analyze and extract meaningful information from large amounts of urban data. We will address the process of capturing data (on-site and digital data acquisition) and interpreting the information using diverse data sources (statistics, social networks, open data, etc.) with the ultimate aim of developing novel design strategies to apply to three future scenarios of Barcelona: high demographic grow, a new productive city and the post-car city.
Post Car City, 300.000km/s
Concepts At the end of the seminar, the student will be familiar with:
– Working with databases.
– Big data analysis.
– Gathering information (on-site and digital acquisition).
– Cartographical representation (using Open GIS).
– Spatial and temporal aggregation.
– Mathematical analysis vs graphical analysis.
– Data contextualization.
– Identification of Patterns vs exception.
– Mash-up and complementary data.
– On-site verification and reinterpretation.
Demographics, 300.000km/s