CONTEXT DECODER / MEASURING URBAN ATTRACTORS
World is getting urban and global, and this change is in progress nowadays. In order to comply with it, the architectural practice must extensively include cultural practices into its toolbox. Having started designing worldwide, architects have faced the drastic shortage of knowledge about the local cultures beyond the urban context in which they have to intervene.
Architects are using the internet-based services for different purposes, including the remote cultural surveys, but there is the uniform comprehensive method that is lacking, as well as there is no tool based on such a method. The value of the unmoderated user content for the pre-design survey must not be underestimated: actually, it is the massive array of assessments, emotions and remarks, from which one can extract the most vivid essence of the local urban lifestyle. However, a tool to surf through all the sheer amount of data is necessary and here the possibilities provided by the AI come into play. Since the architect is dealing with data obtained from cloud-based sources rather than from his own senses, data science must be applied to processing and analysis of this data. The key reason for it is the amount of data available: it is clearly bigger than any human brain is able to process in a reasonable amount of time.
Our hypothesis is that there exists a correlation between special urban fabric and social behavior patterns. Our studio project, called “Context decoder”, attempts to create such a method and such a tool. It combines several components, which have existed separately for quite a long time already, into an integral instrument with new possibilities. Our tool is intended to draw connections between the urban fabric and society, analyzing the similarities and correlations between input features to give designers a deeper comprehension of the place. The objective is to achieve holistic context interpretation for the selected location by using spatial or non-spatial factors.
The tool we are developing is aimed at building up the relation between the field conditions and the agents behavior within it.
The project was developed in 3 processes including:
- Define Methodology and Data Selection
- Analysis and Machine Learning for clustering
- Integration to Application
DEFINE METHODOLOGY & DATA SELECTION
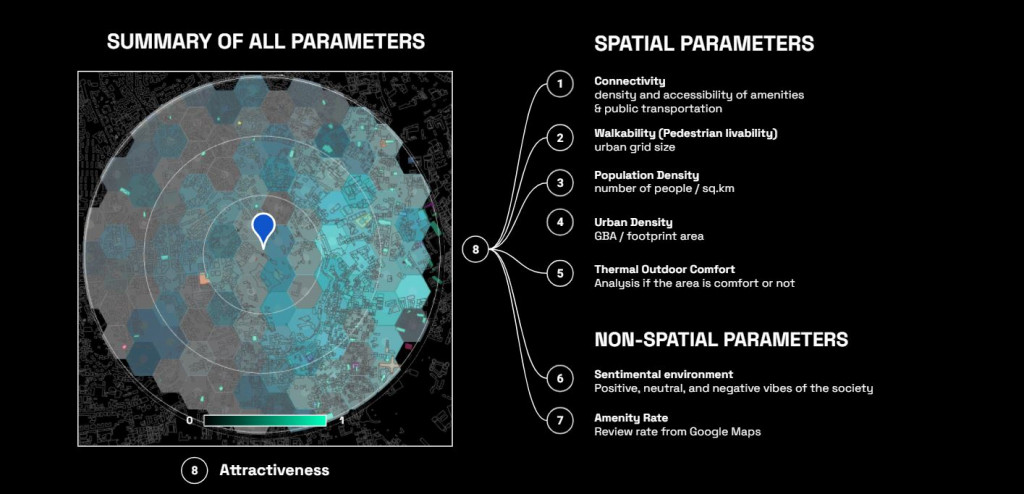
The project dataset was consisted of 7 different data from open-sources online where can be categorized into 2 types: Spatial data and Non-Spatial data.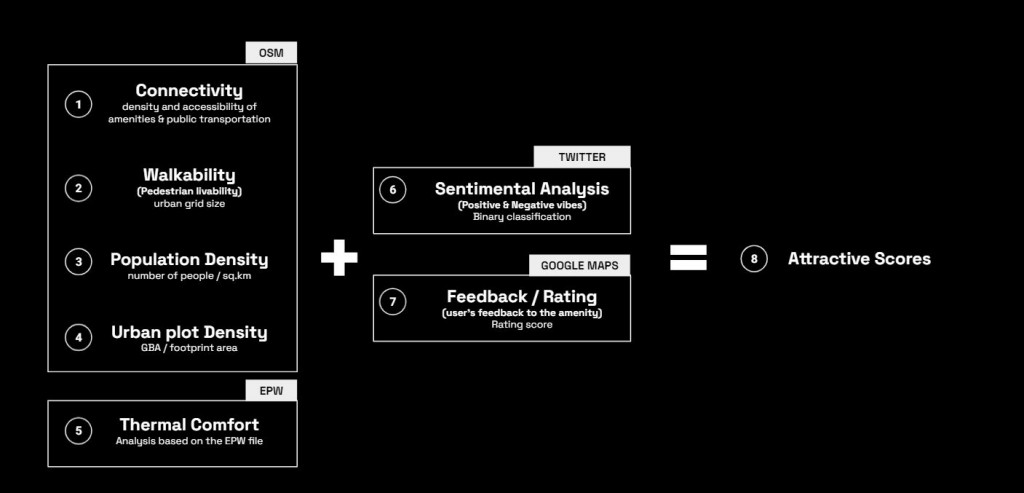
The data for Context Decoder tool consist of 2 environmental fields including Urban field (Spatial parameter) and Social field (Non-Spatial Parameter):
That we have developed the calculation table and parameter scores on the table sheet below.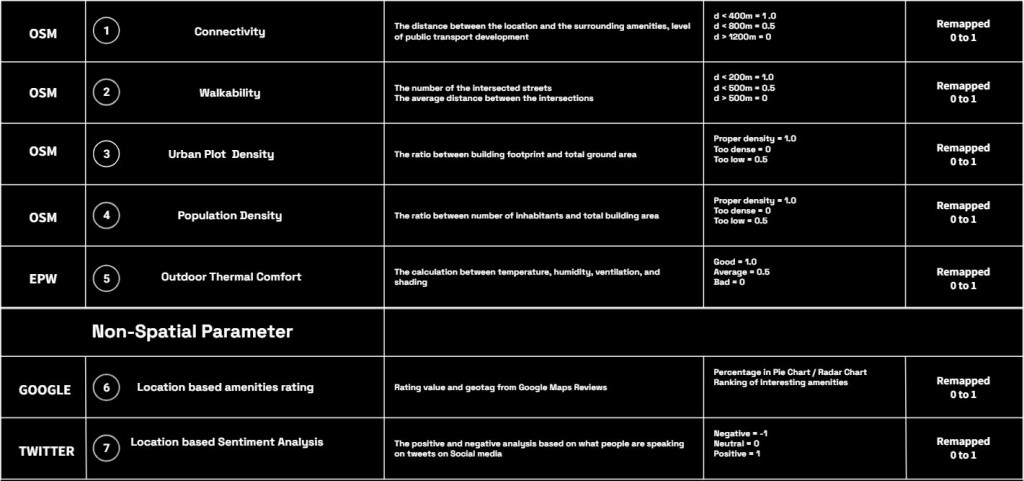
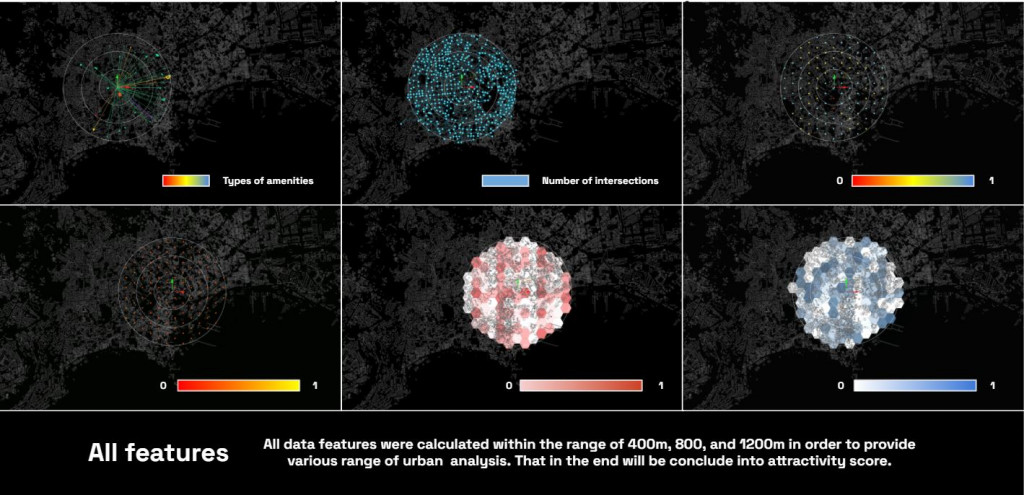
All 7 data were combined to calculate the attractivity score and these context data will be developed in the next process of analysis for clustering.
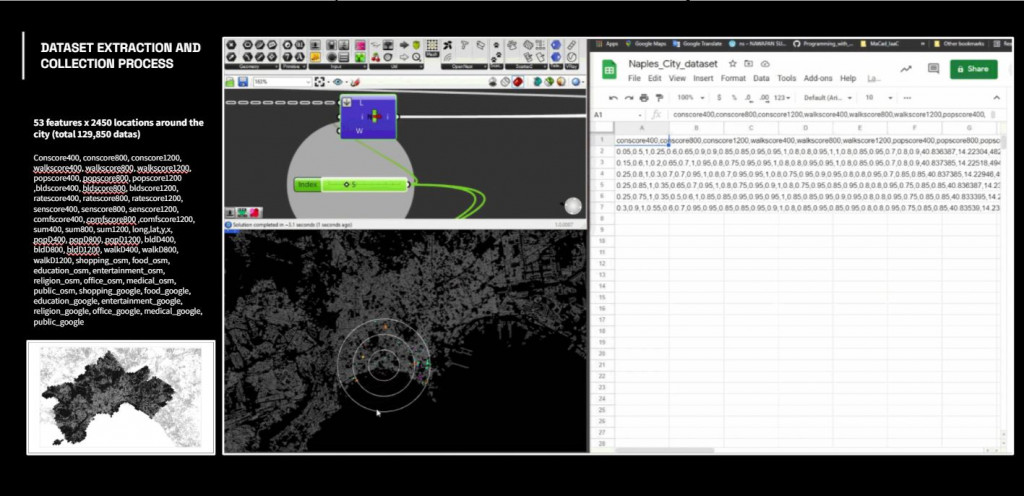
And in the end of data creation, the data were linked and collected to Googlesheet to be used for Analysis and Machine Learning.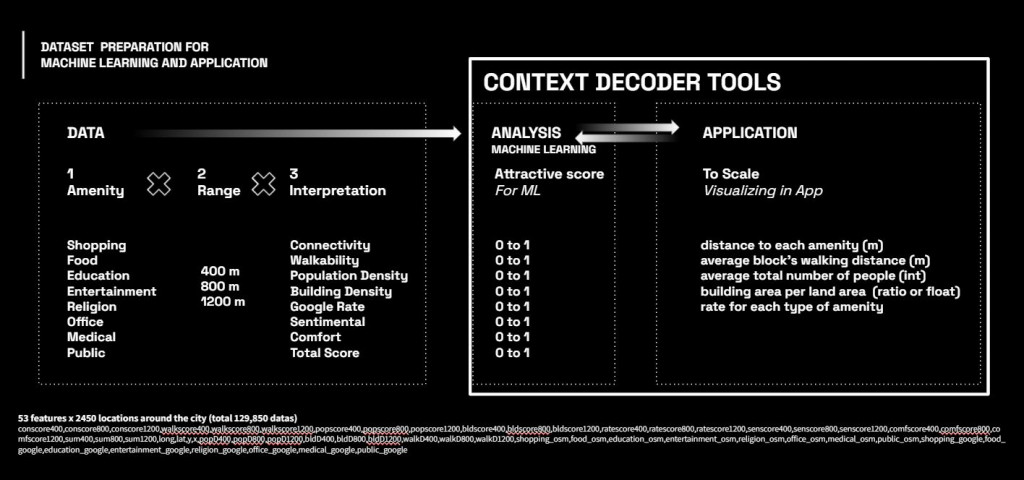
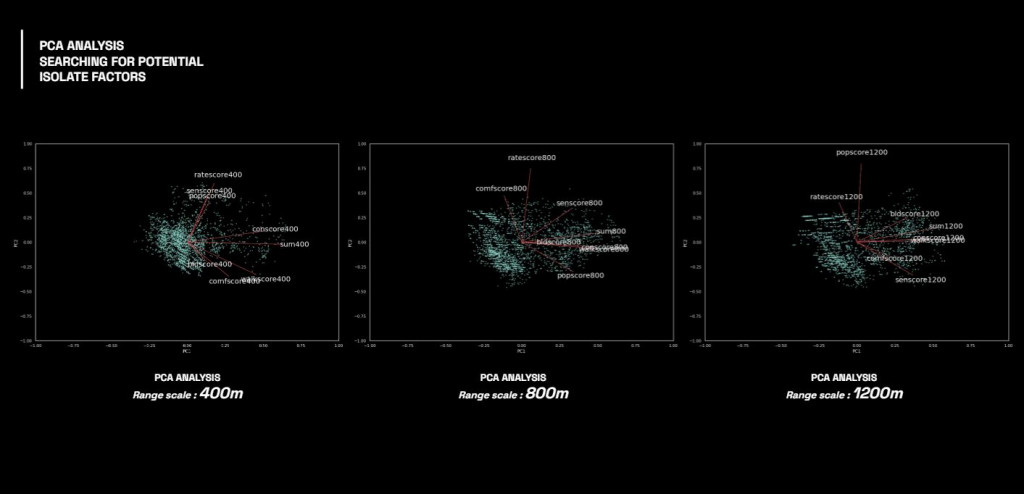
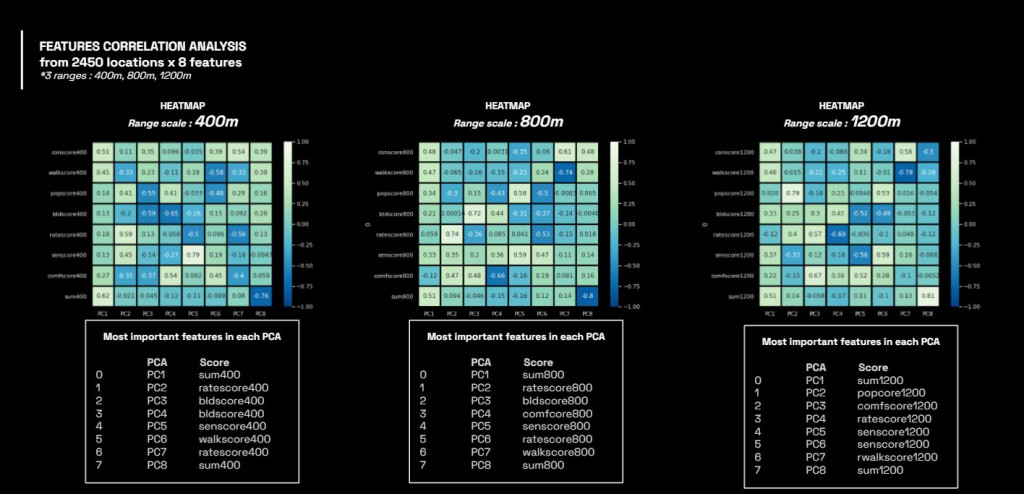
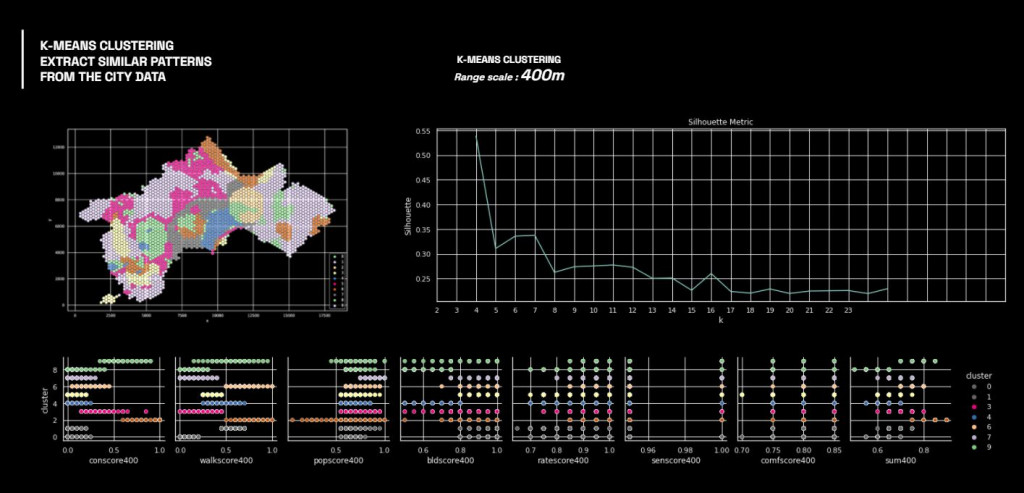
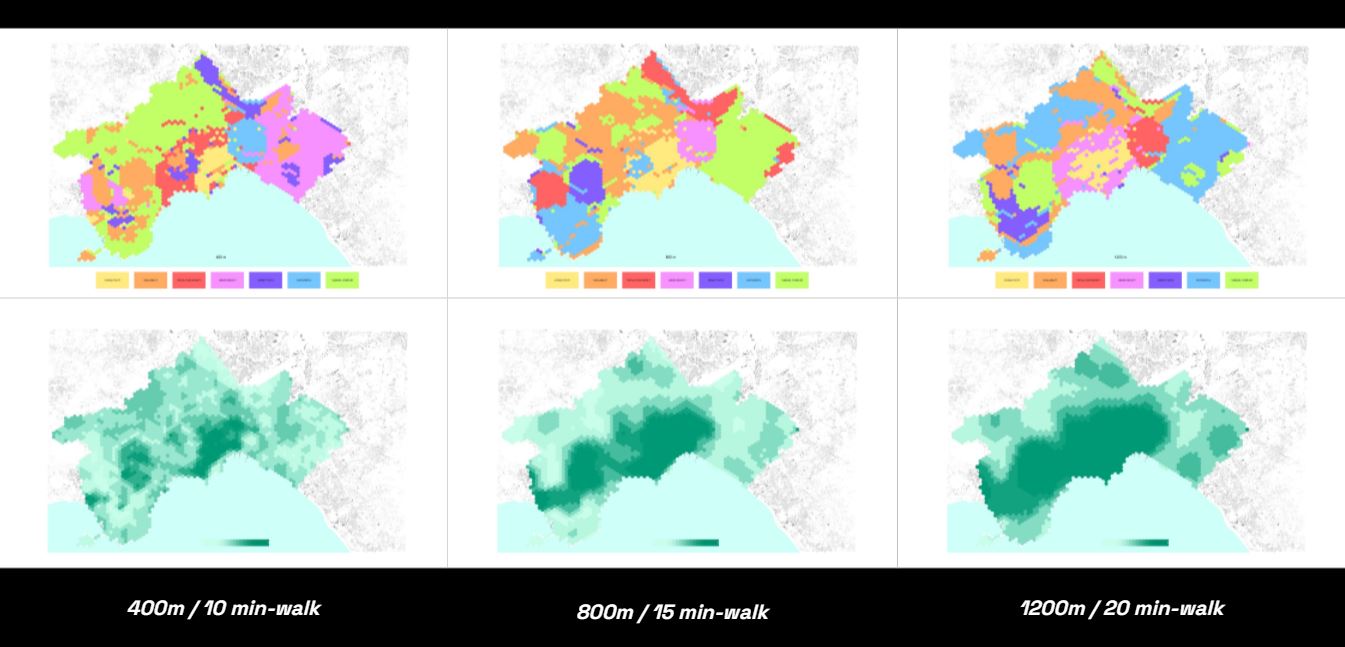
For this analysis the project were looking at 3 different scale including:
- 400m (10 min-walk)
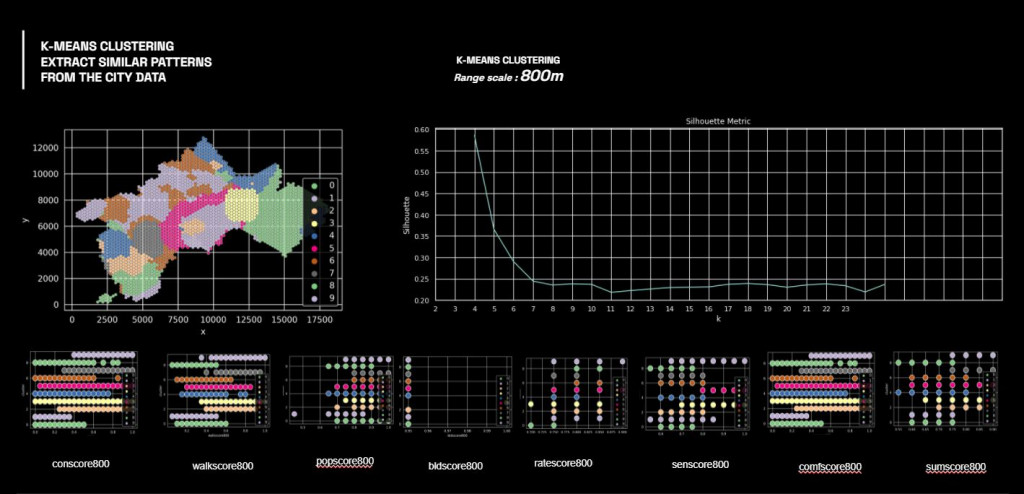
- 800m (15 min-walk)
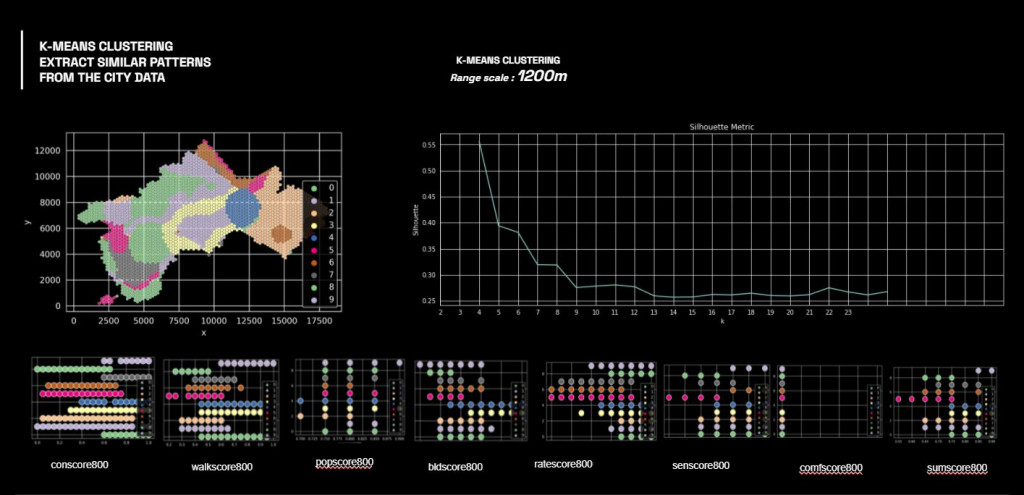
- 1200 (20 min-walk)
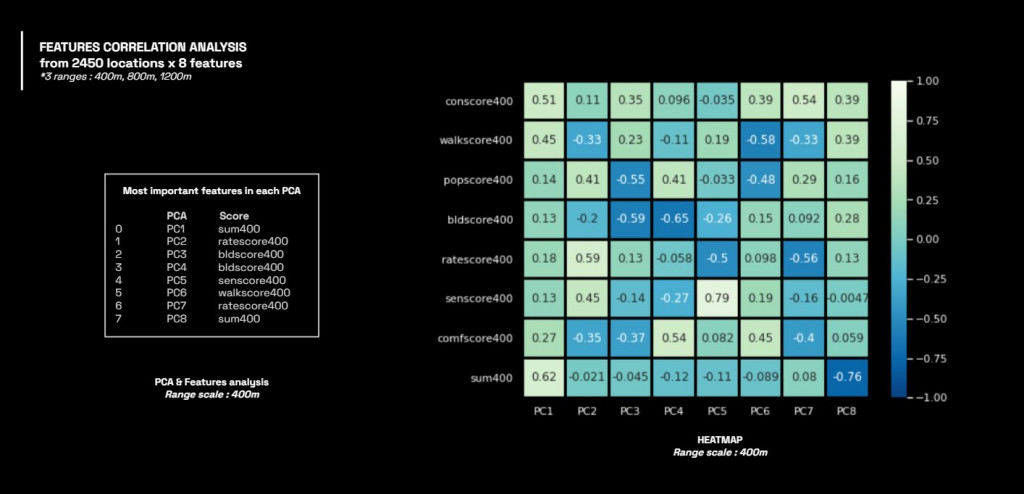
And multiply with amenity metric, in the end the project contains 53 features with 2450 locations which equal to 129,850 datas
ANALYSIS AND MACHINE LEARNING FOR CLUSTERING
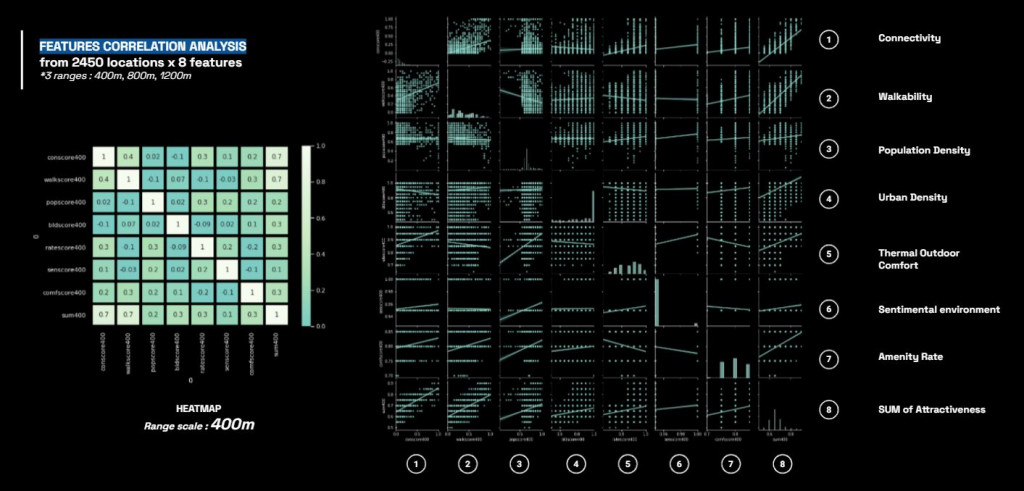
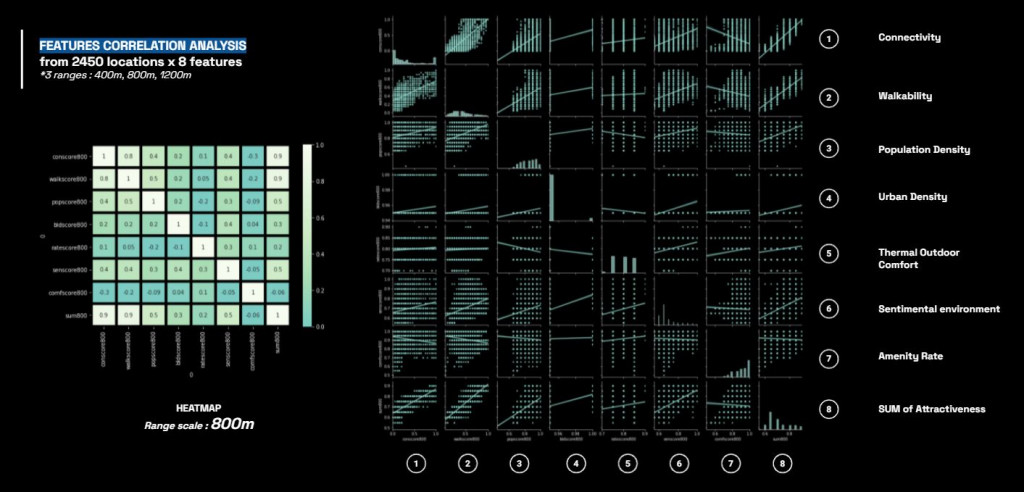
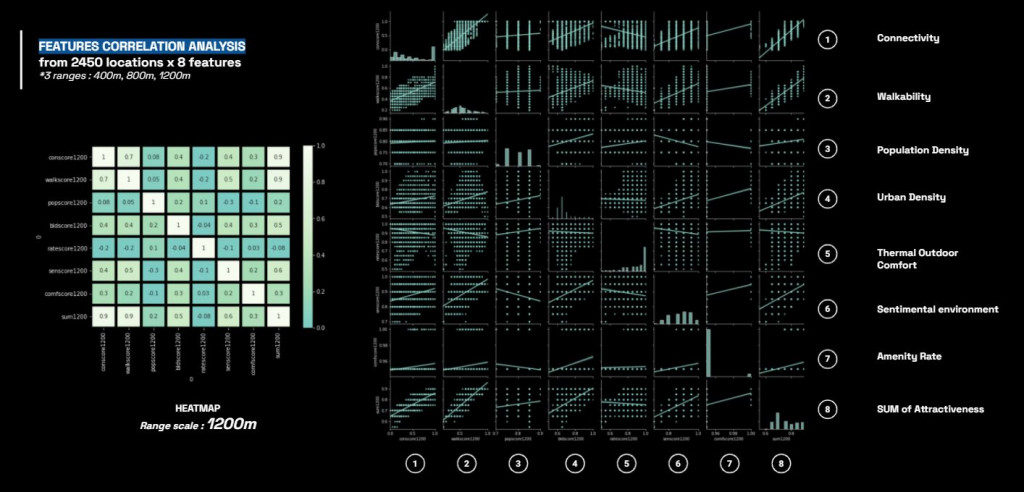
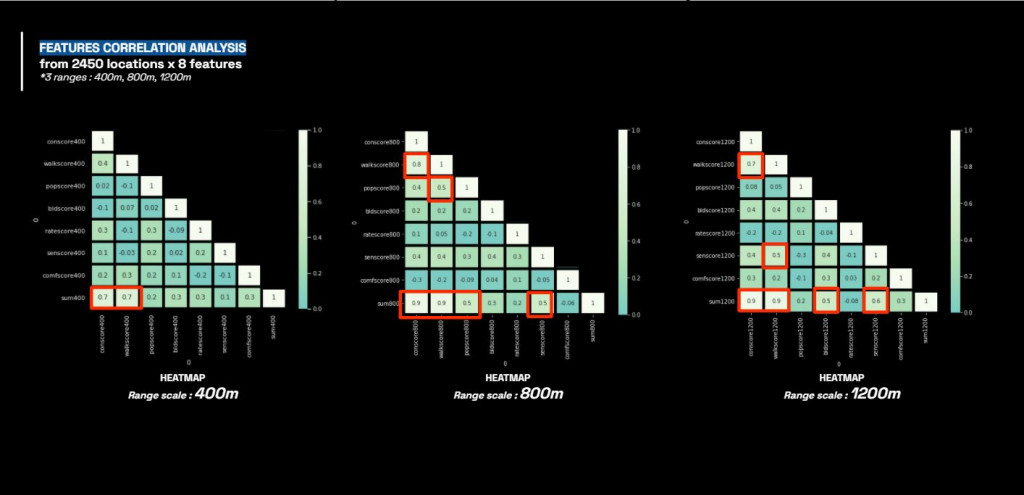
After analysis, the heatmap show the correlation of the features according to the range scale.
Moreover, by analyzing with PCA, we can see this clearer as a group of similar score ranges.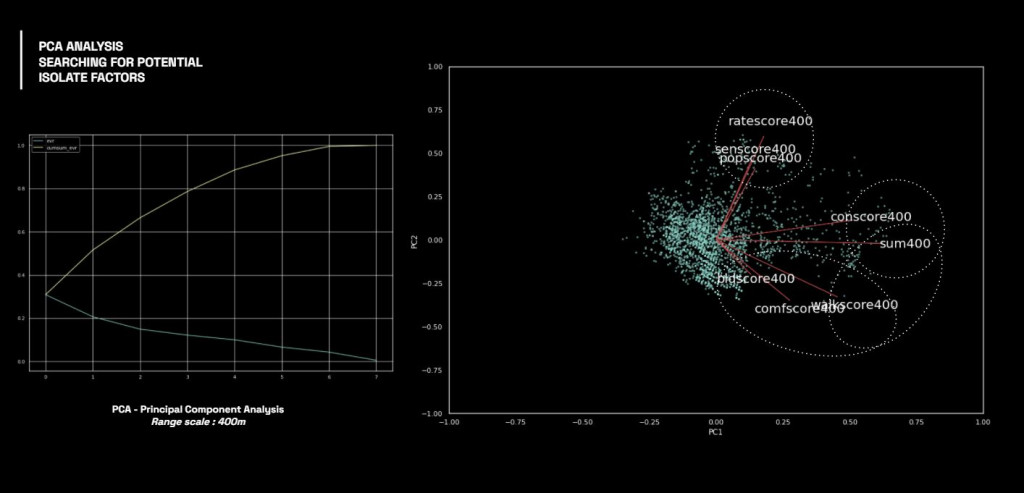
K-means and Clustering
Next process is to use this data analysis for K-means clustering to map the location and see them in similarity in term of both urban and social parameter.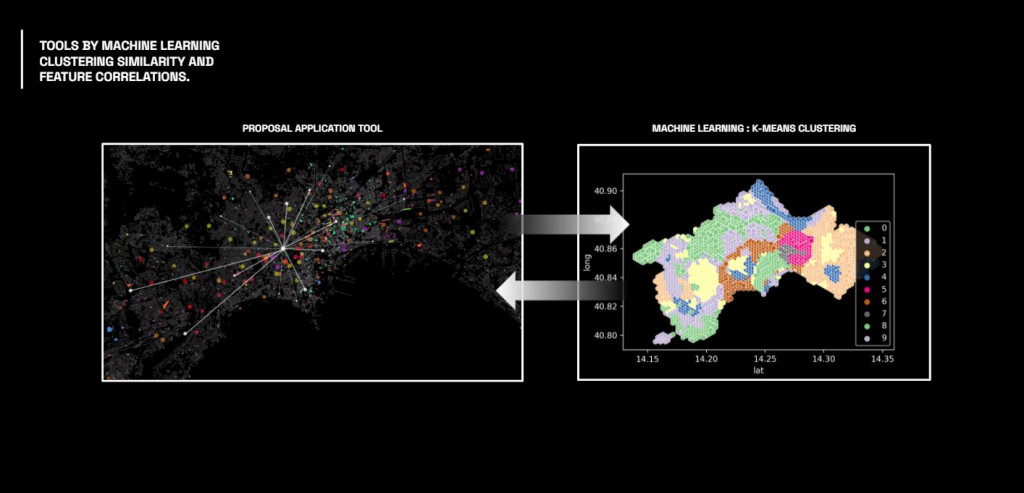
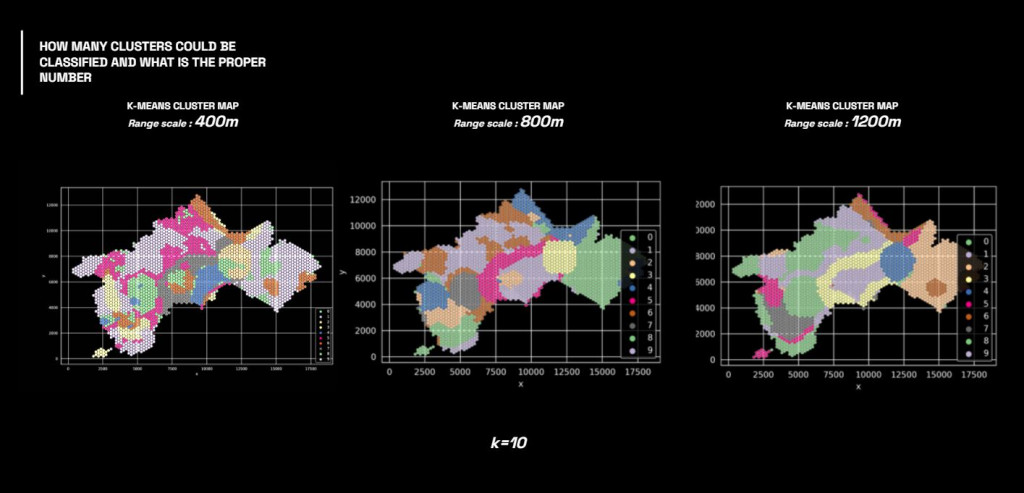
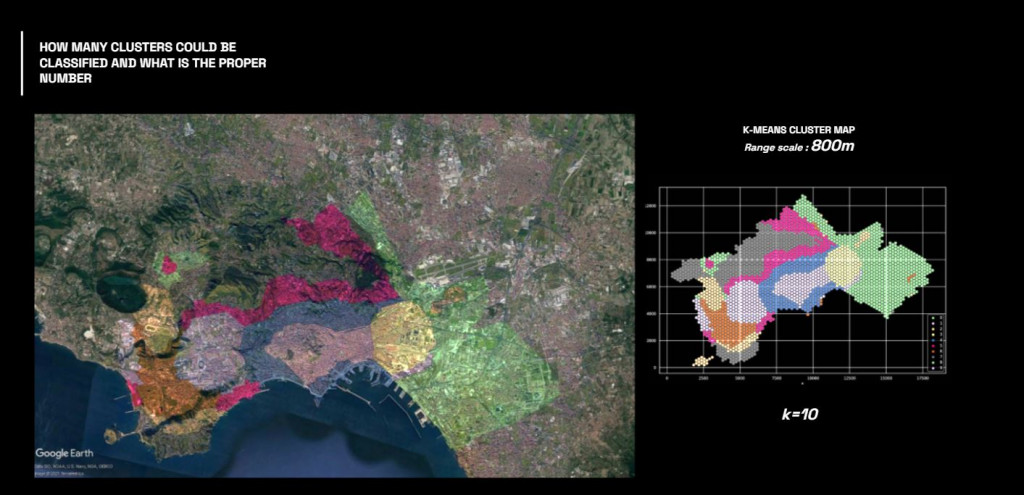
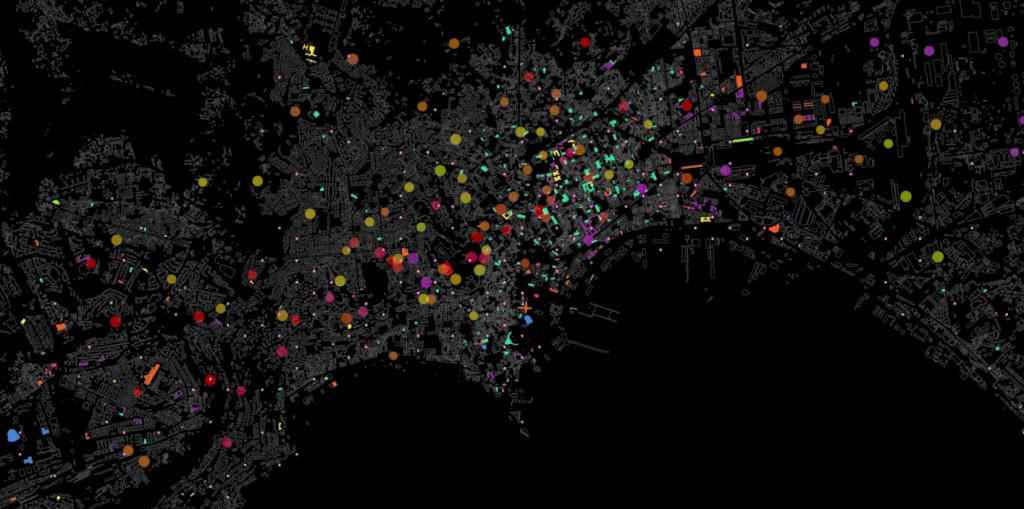
By overlaying the cluster map on the city map, we can understand the similar areas identified in different patches.
As one of our colleague is a local, many areas that considered as similar have been well grouped together, such as the green cluster, which found similarities between the former industrial area and the residential expansion district, in terms of attractiveness. While surprisingly by the relationship between the areas identified by the magenta cluster, because they got lowest score of some features but they are very attractive in term of nature connection.
Therefore this allows us to interpret the data in different way, that the location that have less score(or less data) can be attractive too, but only in term of natural appealing.
However speaking about attractiveness, we are not only take aesthetics, or nature, but we are considering all 7 aspects from user opinions and urban fabrics.
So to conclude this analysis, our tools can be developed and interpret in more holistic meanings than just attractiveness.
INTEGRATION TO APPLICATION
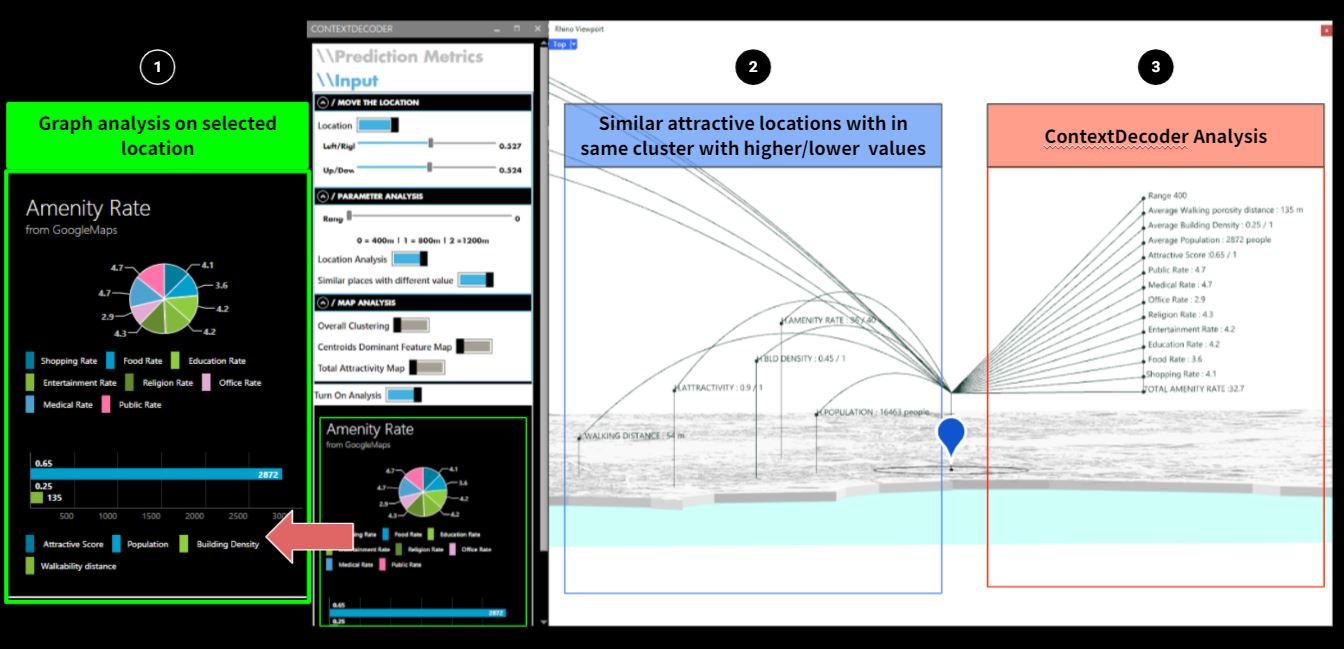
In this local application, we have developed the visualization for data in 5 different types including
1. graph, 2. similar attractive locations, 3. context decoder, 4. Clustering map, and 5. Attractive Map
And also Please find our online application on the like below: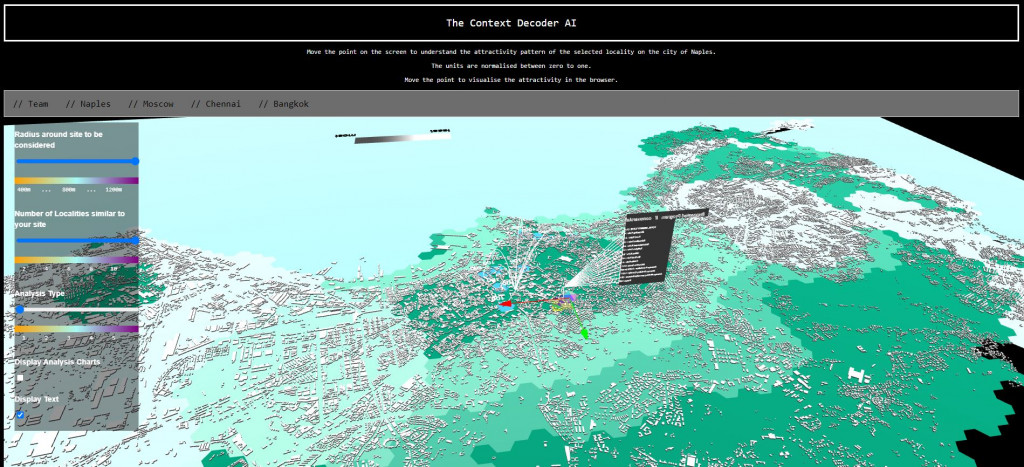
https://contextdecoder.herokuapp.com/examples/ContextDecoder/
Video demonstration:
https://drive.google.com/file/d/1UYNf041Im5SKQvgkSL4n0XczfMzJD2rr/view?resourcekey
Github:
https://github.com/keshavanarayan/ContextDecoderAI
Context Decoder is a project of IAAC, Institute for Advanced Architecture of Catalonia developed in the
Master in Advanced Computation for Architecture & Design in 2020/21
Students: Keshava Narayan Karthikeyan, Laura Marsilo, Nataliya Voinova, Nawapan Suntorachai
Faculty: Angelos Chronis and Lea Khairallah