ABSTRACT
World is getting urban and global, and this change is in progress nowadays. In order to comply with it, the architectural practice must extensively include cultural practices into its toolbox. Having started designing worldwide, architects have faced the drastic shortage of knowledge about the local cultures beyond the urban context in which they have to intervene.

Another important novelty is that nowadays we are receiving 99% of information from the internet. Designing without even visiting the project site has become a common practice, especially in the ideas competitions. We are briefed by the Internet, in which the representation of the whole world is being stored and permanently updated. We must admit its influence on the “physical reality” through human activity – we are already reshaped by this tool. The Internet is an apparatus and its importance can’t be neglected.
Architects are using the internet-based services for different purposes, including the remote cultural surveys, but there is the uniform comprehensive method that is lacking, as well as there is no tool based on such a method. The value of the unmoderated user content for the pre-design survey must not be underestimated: actually, it is the massive array of assessments, emotions and remarks, from which one can extract the most vivid essence of the local urban lifestyle.
However, a tool to surf through all the sheer amount of data is necessary and here the possibilities provided by the AI come into play. Since the architect is dealing with data obtained from cloud-based sources rather than from his own senses, data science must be applied to processing and analysis of this data. The key reason for it is the amount of data available: it is clearly bigger than any human brain is able to process in a reasonable amount of time.
Our hypothesis is that there exists a correlation between special urban fabric and social behavior patterns. Our studio project, called “Cultural decoder”, attempts to create such a method and such a tool. It combines several components, which have existed separately for quite a long time already, into an integral instrument with new possibilities. Our tool is intended to draw connections between the urban fabric and society, analyzing the similarities and correlations between input features to give designers a deeper comprehension of the place. The objective is to achieve holistic context interpretation for the selected location by using spatial or nonspatial factors.
We’d like to end this abstract with the quotation from Stan Allen’s paper Field conditions: “The infrastructural elements of the modern city, by their nature linked together in open-ended networks, offer another example of field conditions in the urban context. A complete examination of the implications of field conditions in architecture would necessarily reflect the complex and dynamic behavior of architecture’s users, and speculate on new methodologies of program and space.”
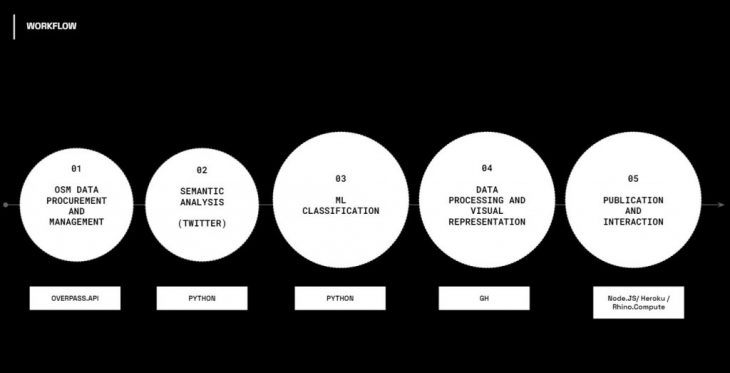
WORKFLOW
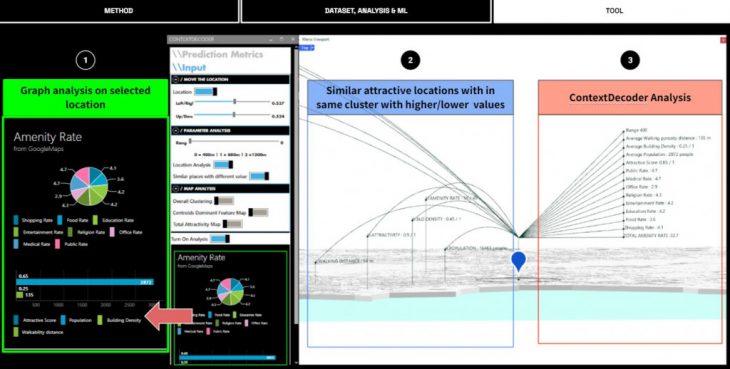
Our tool is operated on the intersection of the conventional analytical instruments of the designer – objective information about the climatic, geotechnical or other physical characteristics of the site, visuals of the design site and its surrounding etc – and the data concentrated public assessment of the area, extracted from the user data.
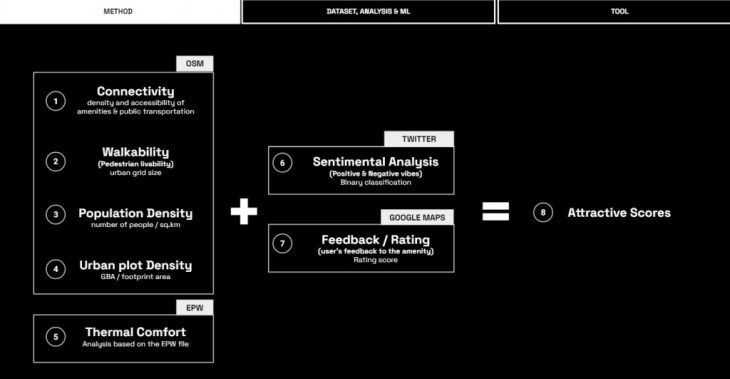
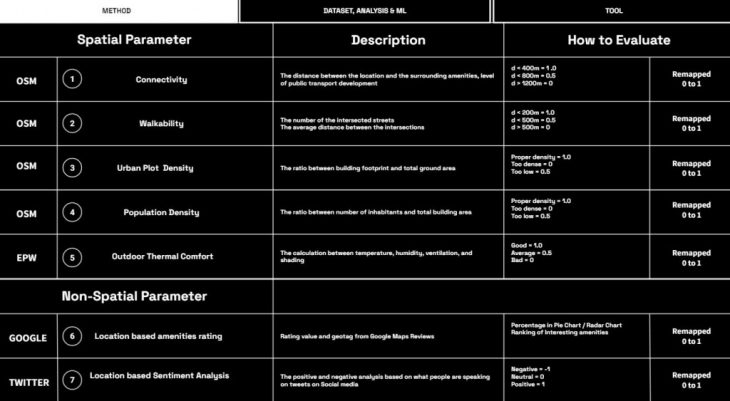
We divided our analysis into 2 parts. First we measure urban environment parameters such as distances, density, and connectivity. Then we use semantic and sentiment analysis with geotags from social media to estimate the urban environment. The result is an integral index of attractiveness. For each parameter we introduce rating as output so that in the end we have common metrics. We used the k-means clustering model to find hidden relationships and to extract similar city patterns from our data collection.
The tool we are developing is aimed at building up the relation between the field conditions and the agents behavior within it. We are measuring the following:
SPATIAL PARAMETERS
Connectivity – density and accessibility of amenities & public transportation
Walkability (Pedestrian livability) – urban grid size
Population Density – number of people / sq.km
Urban Density – GBA / footprint area
Thermal Outdoor Comfort – Analyze if the area is comfortable or not
NON-SPATIAL PARAMETERS
Sentimental environment – Positive, neutral, and negative vibes of the society
Amenity Rate – Review rate from Google Maps
CASE STUDY
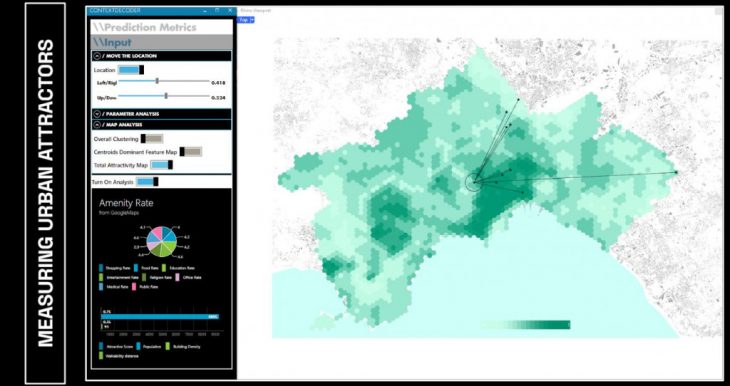
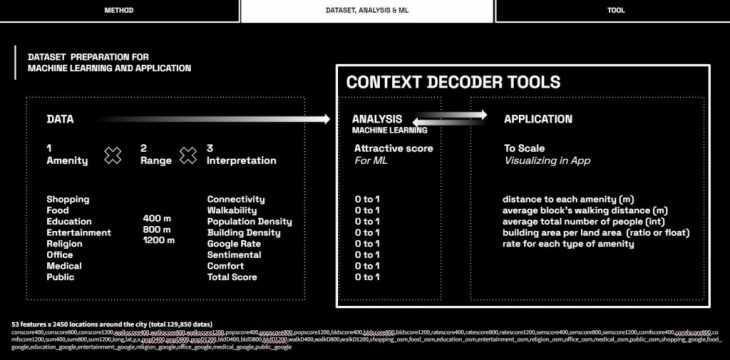
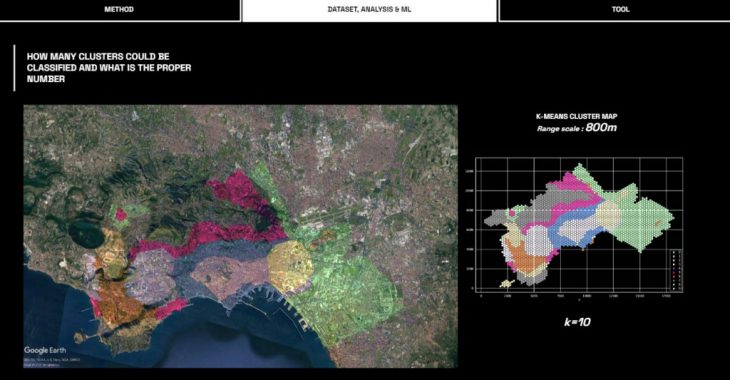
We have chosen Naples for the case study. We mapped each type of data over the city.

By overlaying them we create an interactive map of attractiveness. We have set up our formulation based on our formula sheet and collect different types of features within the radius of 400m, 800m and 1200m. For example, the connectivity score was calculated by the numbers of different types of amenities related to the distances as well as the walkability, which is counting by the number of streets to be crossed. We have collected essential data in 53 different features for 3 dimensions of amenity, ranges, and interpretation as a same remapped score between 0 to 1. In total, we have data for around 2476 point locations in the city.
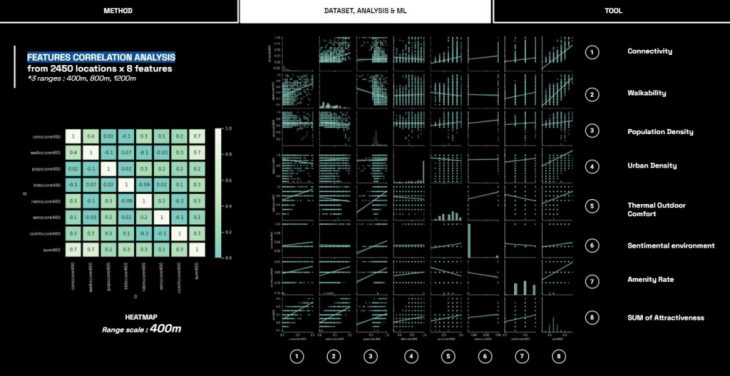
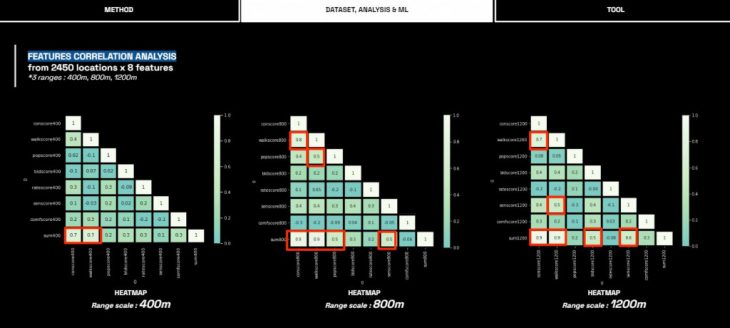
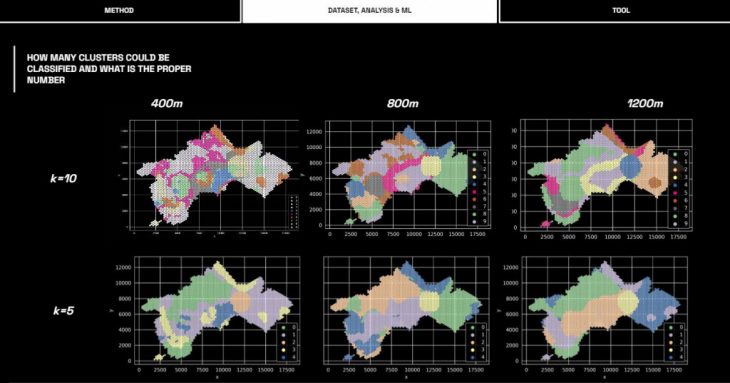
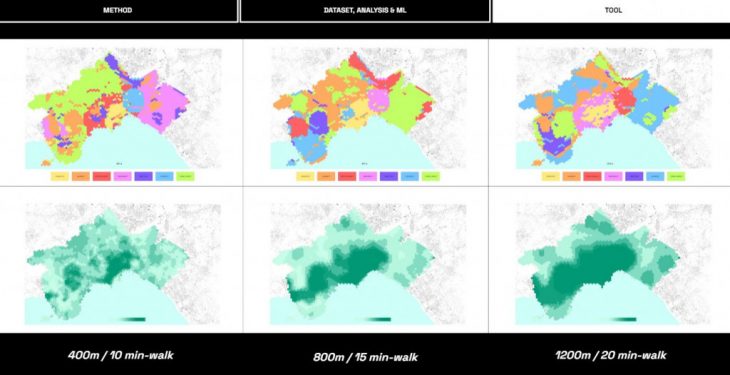
We separated our dataset in 3 different scales with 8 features analysis including 400m, 800m and 1200m, so in comparison we can see the features in correlation to each other in the different scales. Then, we analyzed the data in relation to the different ranges to understand the correlation between the data, through the pca. It is possible to group some of the features that are highly correlated into main features.
After data analysis, we used the kmeans clustering model to find hidden relationships and to extract similar city patterns from our data collection. We started with 10 clusters, as a random starting number and trained the model for each dataset related to the three ranges. For each of them we analysed the distribution of data for each features in relation to the clusters.
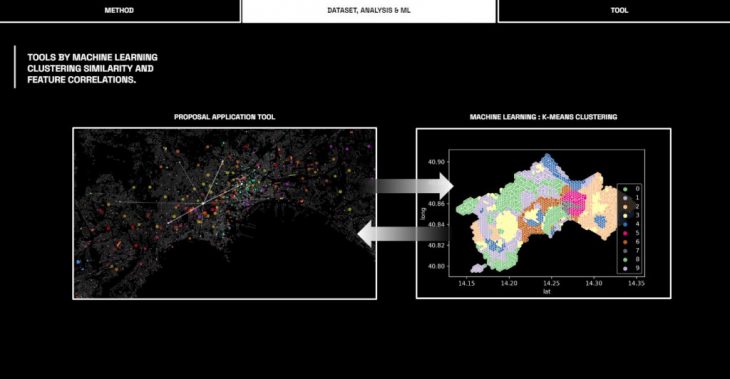
Then we trained the model according to the 5 optimal clusters, for each range. The model identifies 5 macro-areas, which are very homogeneous with each other and can well represent a first subdivision of the city. We asked ourselves if this result really represents the diversification of the city’s behaviour? We know that the k-means clustering model identifies the optimal number of clusters with respect to the similarity of the data, but we believe that a greater subdivision allows for more in-depth analysis of similar city models. Then we overlaid the cluster map on the city map to understand the similar areas identified. Reading shows that the distinct areas that make up the city are well identified, such as the green cluster, which found similarities between the former industrial area and the residential expansion districts. At the same time mapping data shows us interesting new relationships between areas that seem to have no relationship at all.
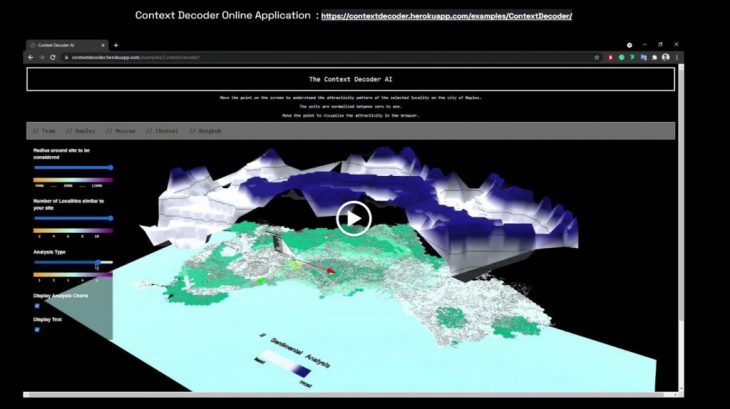
TOOL
We have built two versions of the Context Decoder – Online and Offline. The Offline version allows for more freedom to the end user: one can input own contexts, create and modify own datasets. The online version is more stable and non-editable and more useful for sharing results. Attractivity scores as being highlighted with different colours, dark being the most attractive and light being the least attractive according to our ML algorithm.
CONCLUSION
The work we have done was an experiment with data. Nowadays data created and stored digitally are getting increasingly influential in the physical world. More and more real life decisions are being taken based purely on data. The sensual experience is no more necessary for the assessment to be recognzed as correct. Virtual has been accepted as equally valid. Therefore, it is important to practice data science in any realm of human knowledge and art – just for the reason that information is no more a separate realm. IT has made the information a part of physical by the strong connection built in the increasing number of daily scenarios.
BIBLIOGRAPHY
From object to field Stan Allen
Field conditions Stan Allen
The second digital turn Mario Carpo
AI Aesthetics Lev Manovich
Intensive Science and Virtual Philosophy Manuel DeLanda
The Wasteland Management of the Image Wilderness Michael Young
MaCad AIA Studio 2020/2021
Artificial Intelligence in Architecture
Students:
Keshava Narayan
Laura Marsillo
Nataliya Voinova
Nawapan Suntorachai
Faculty:
Angelos Chronis – lead studio mentor
Lea Khairallah – studio assistant
Theory:
Zeynep Aksöz
Mark Balzar