Back on the studio we question ourselves some issues about our project related to connectivity: Who/What/How do we connect; What are the issues with this connection?; What data to collect and how?; How do we use the data?. The conclusions and ways taken to realize some of the answers are shown in the next images.
 Clic on the image to see the video.
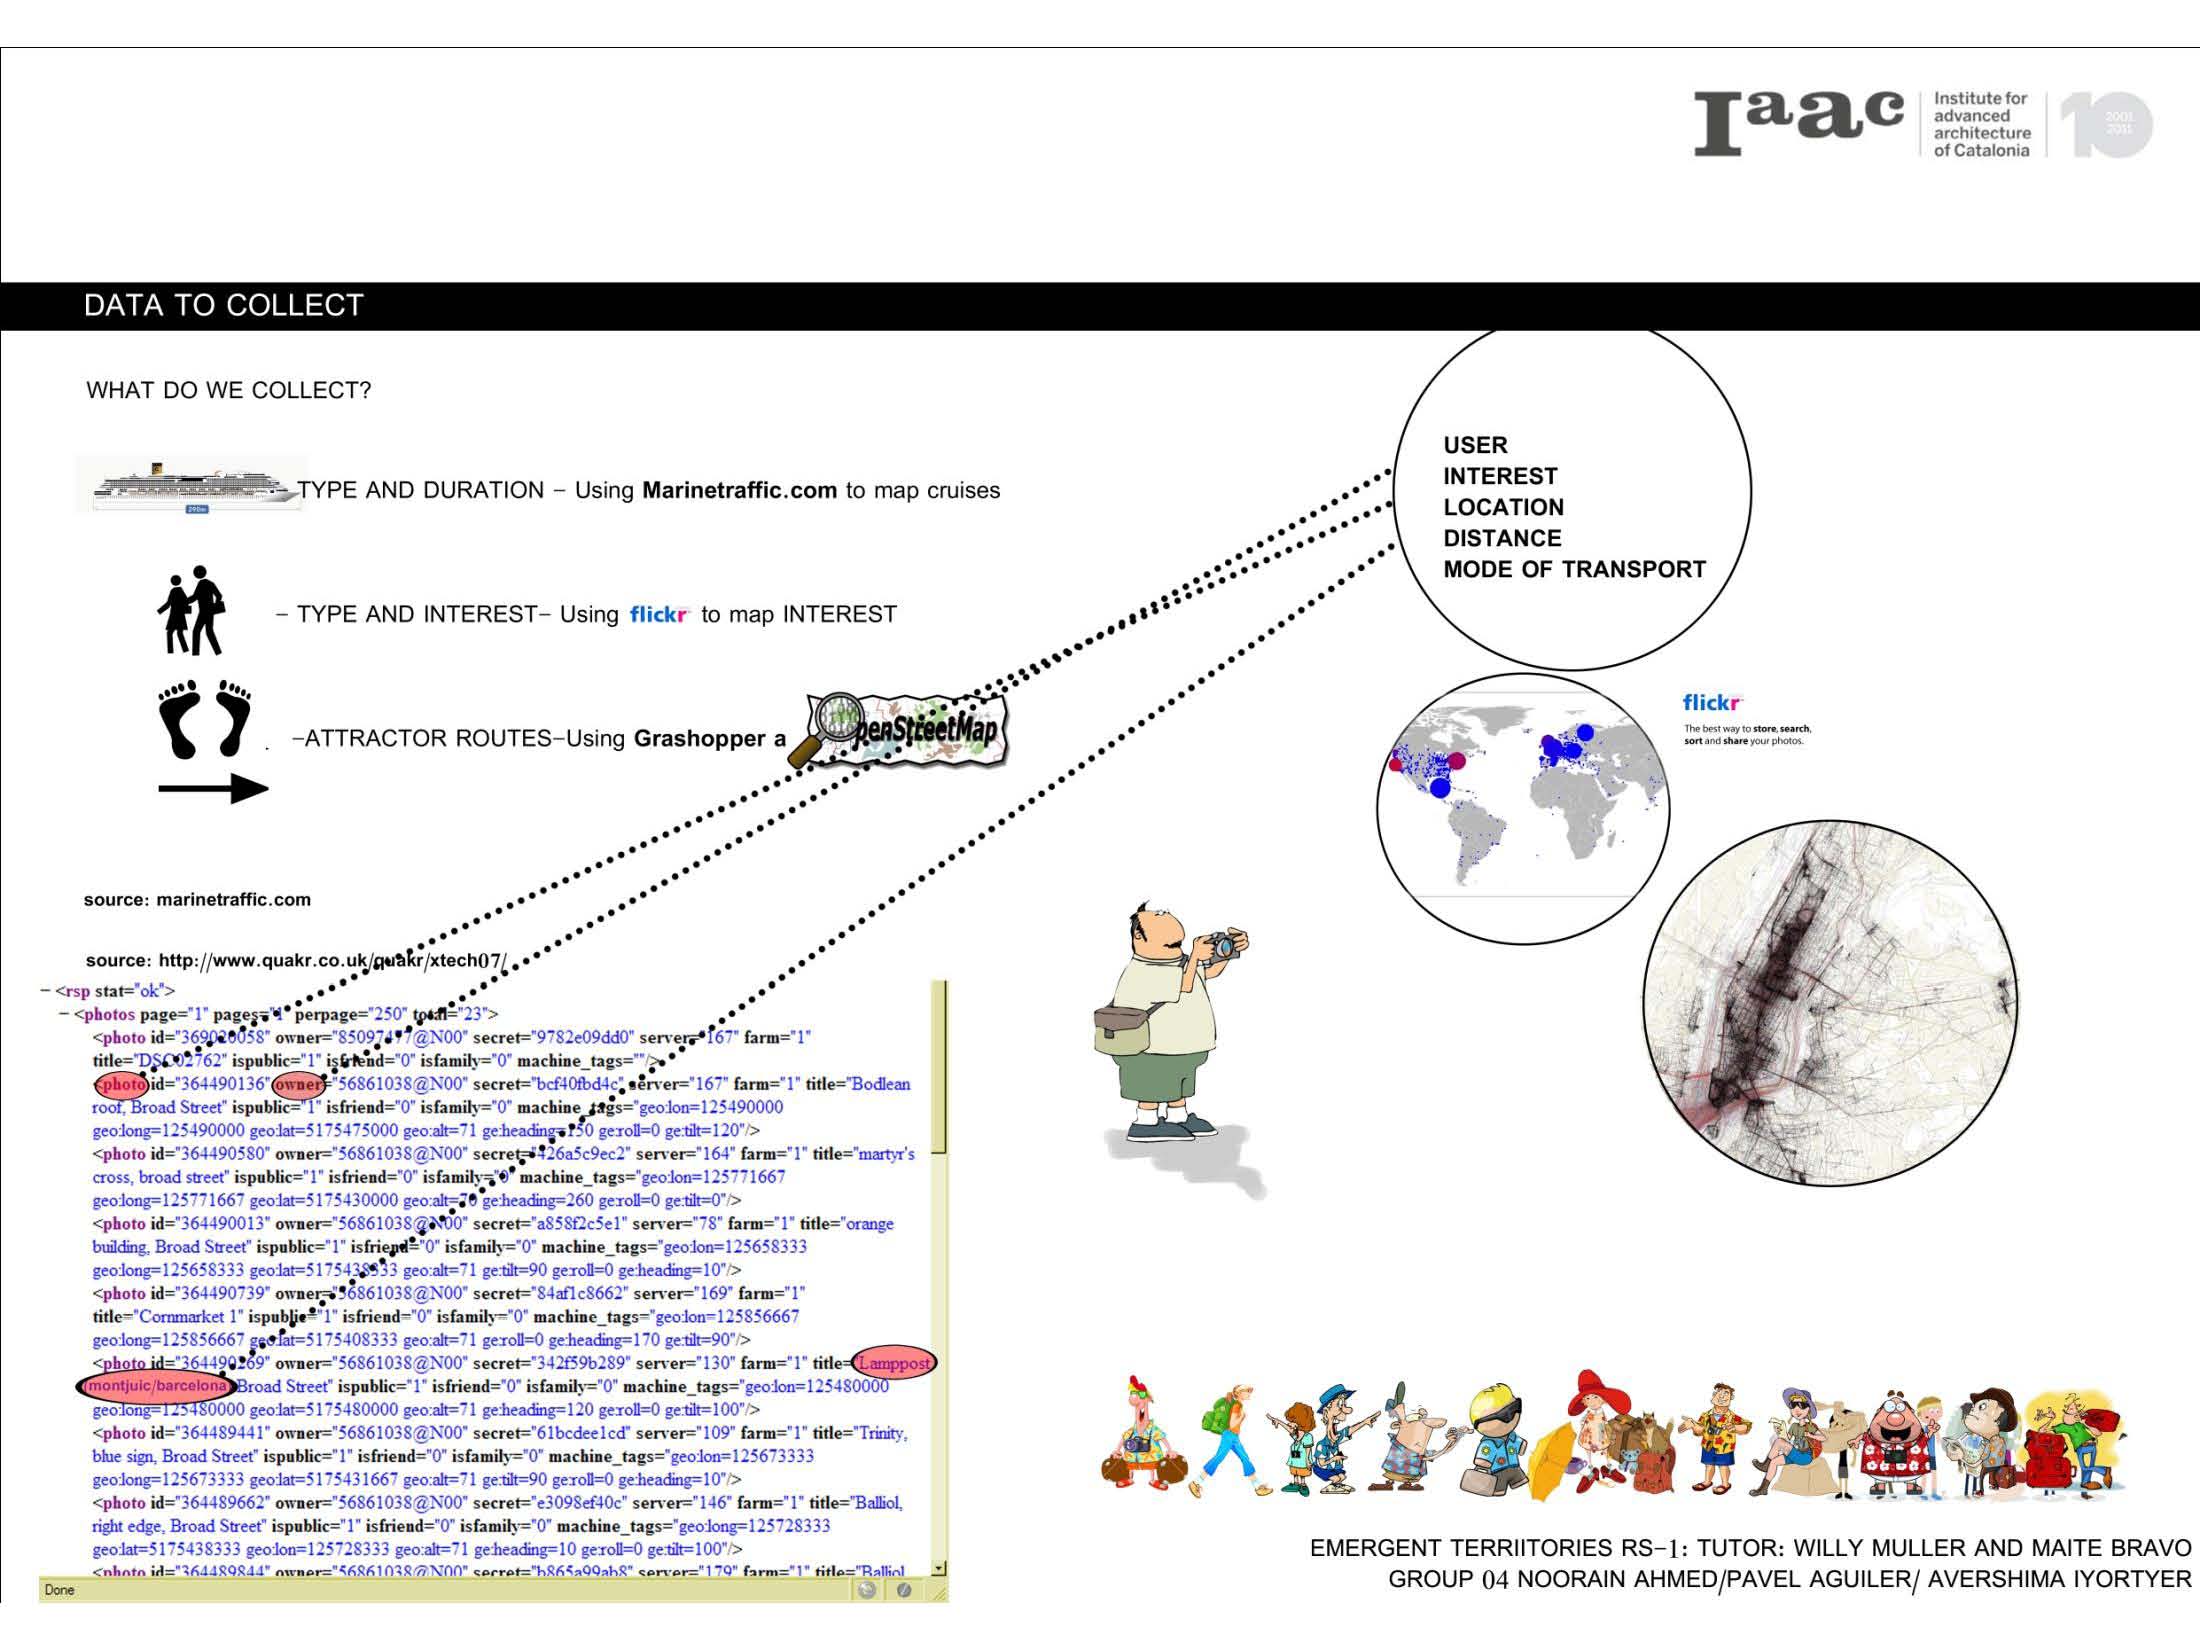
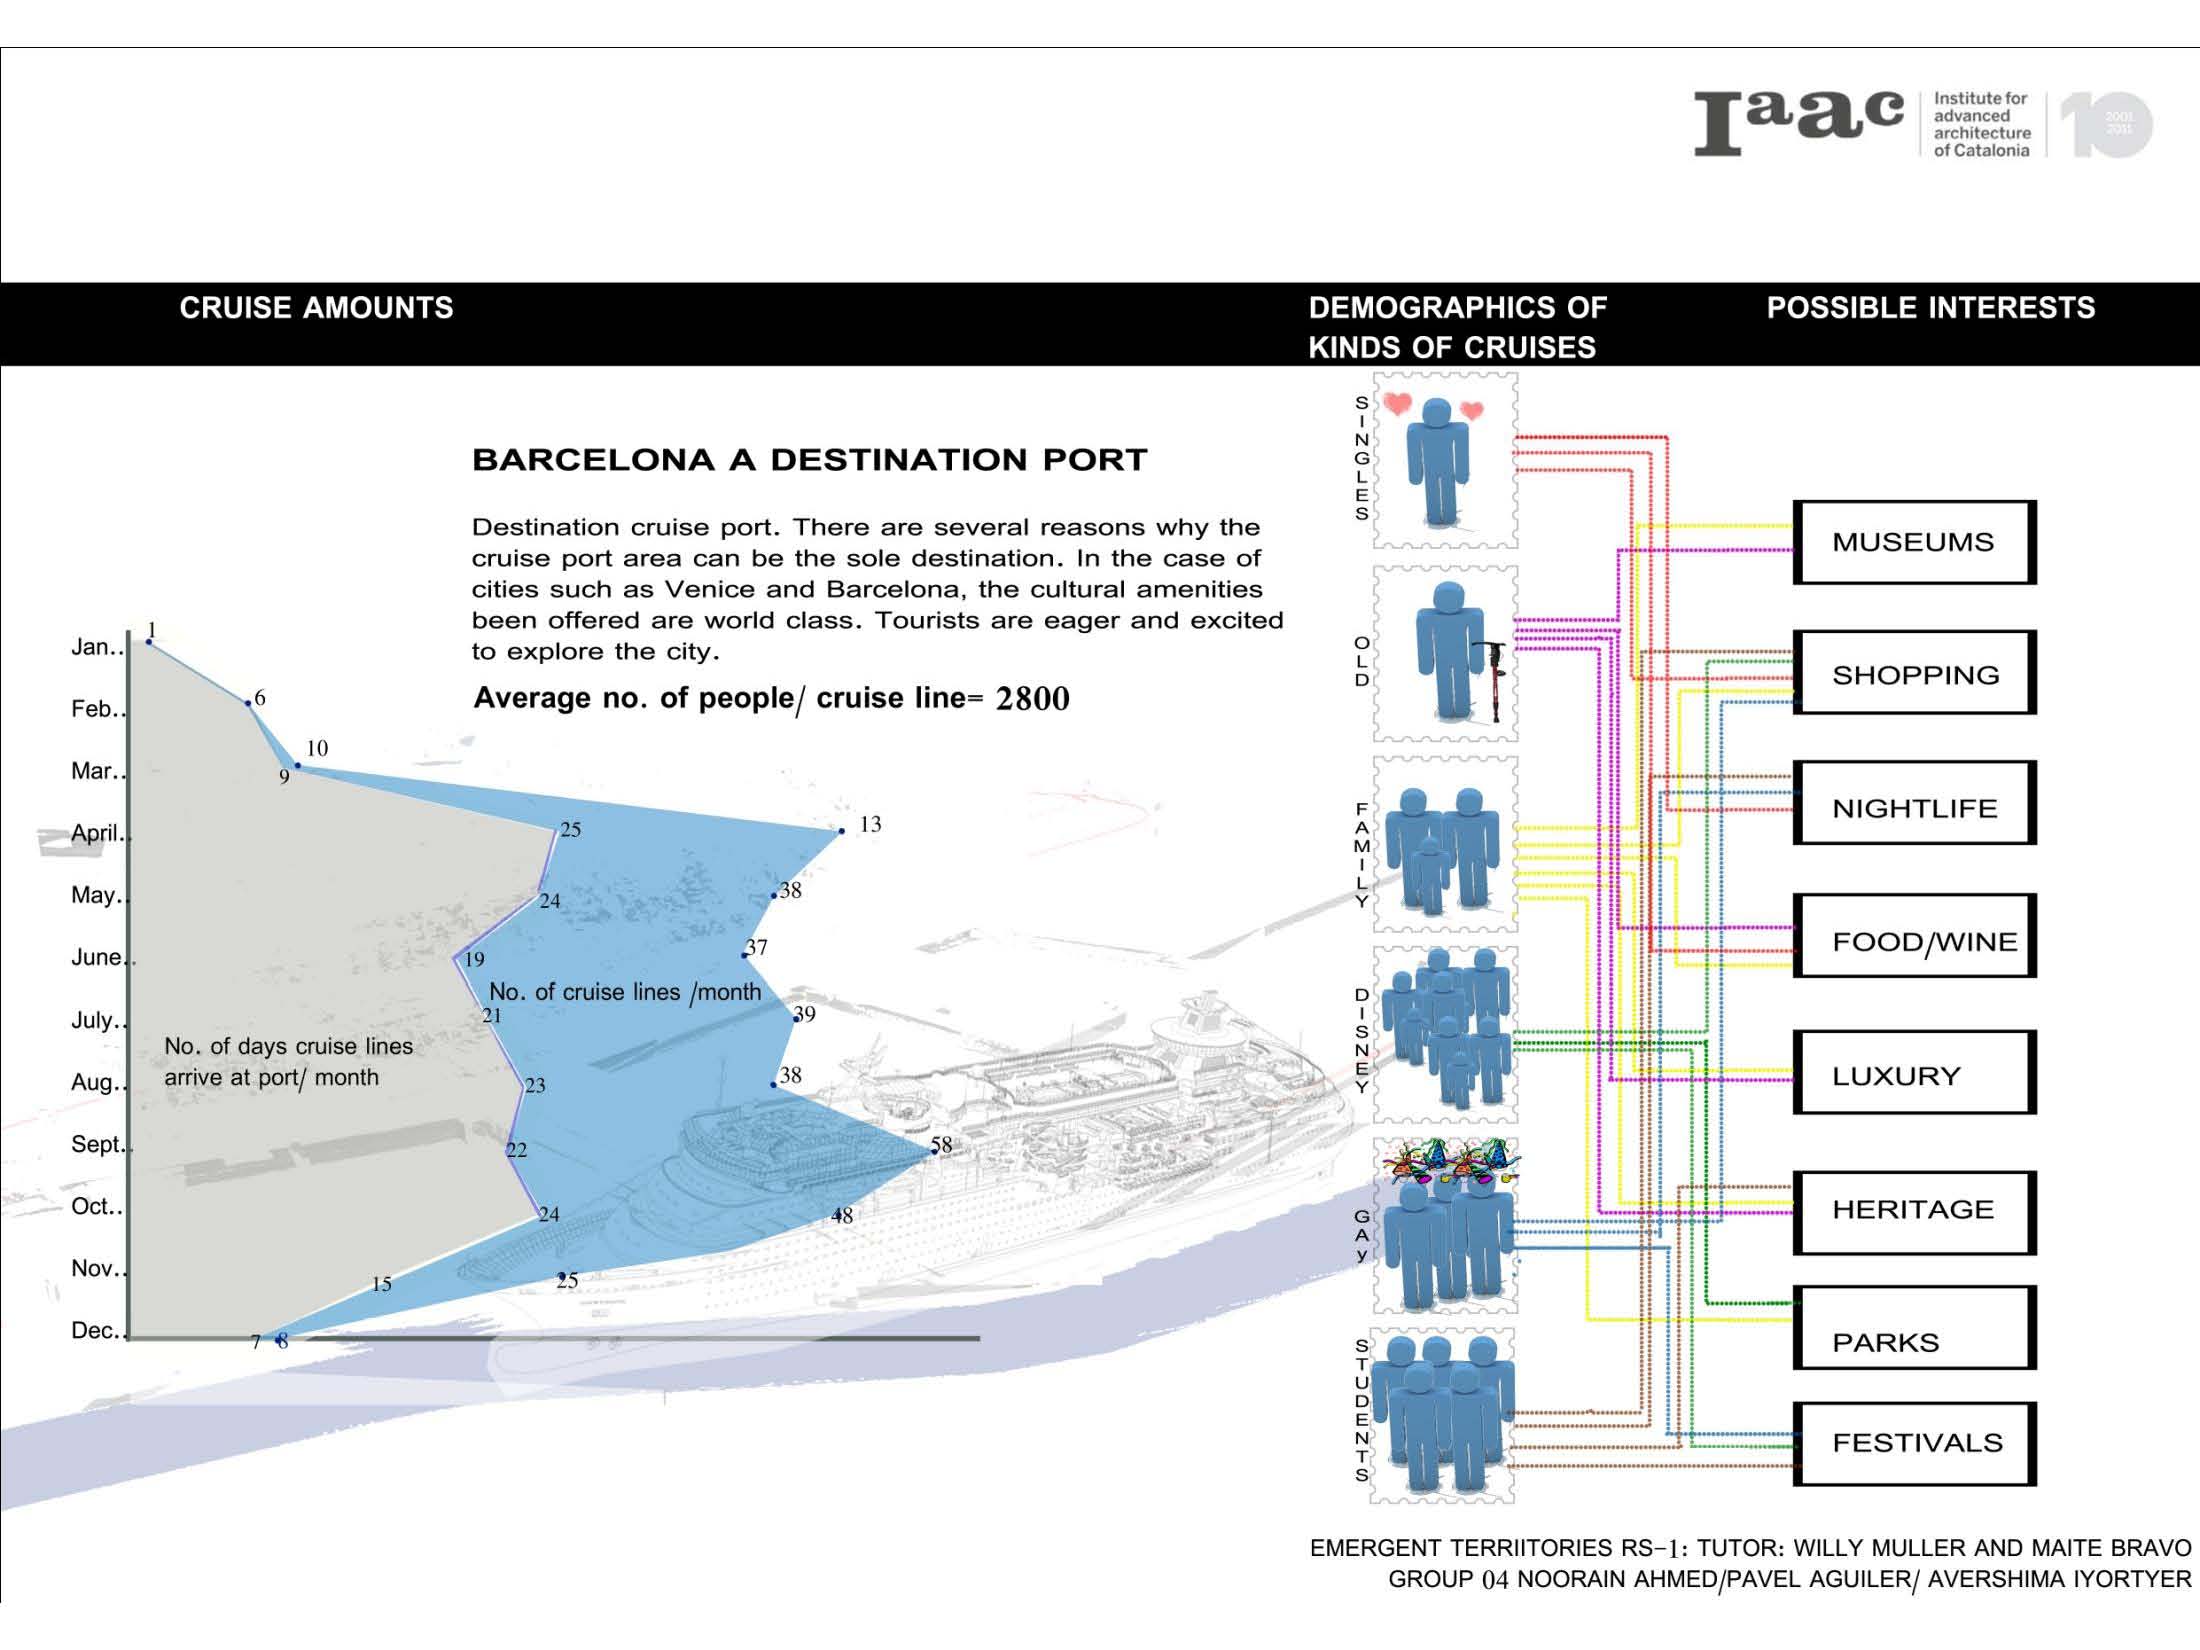
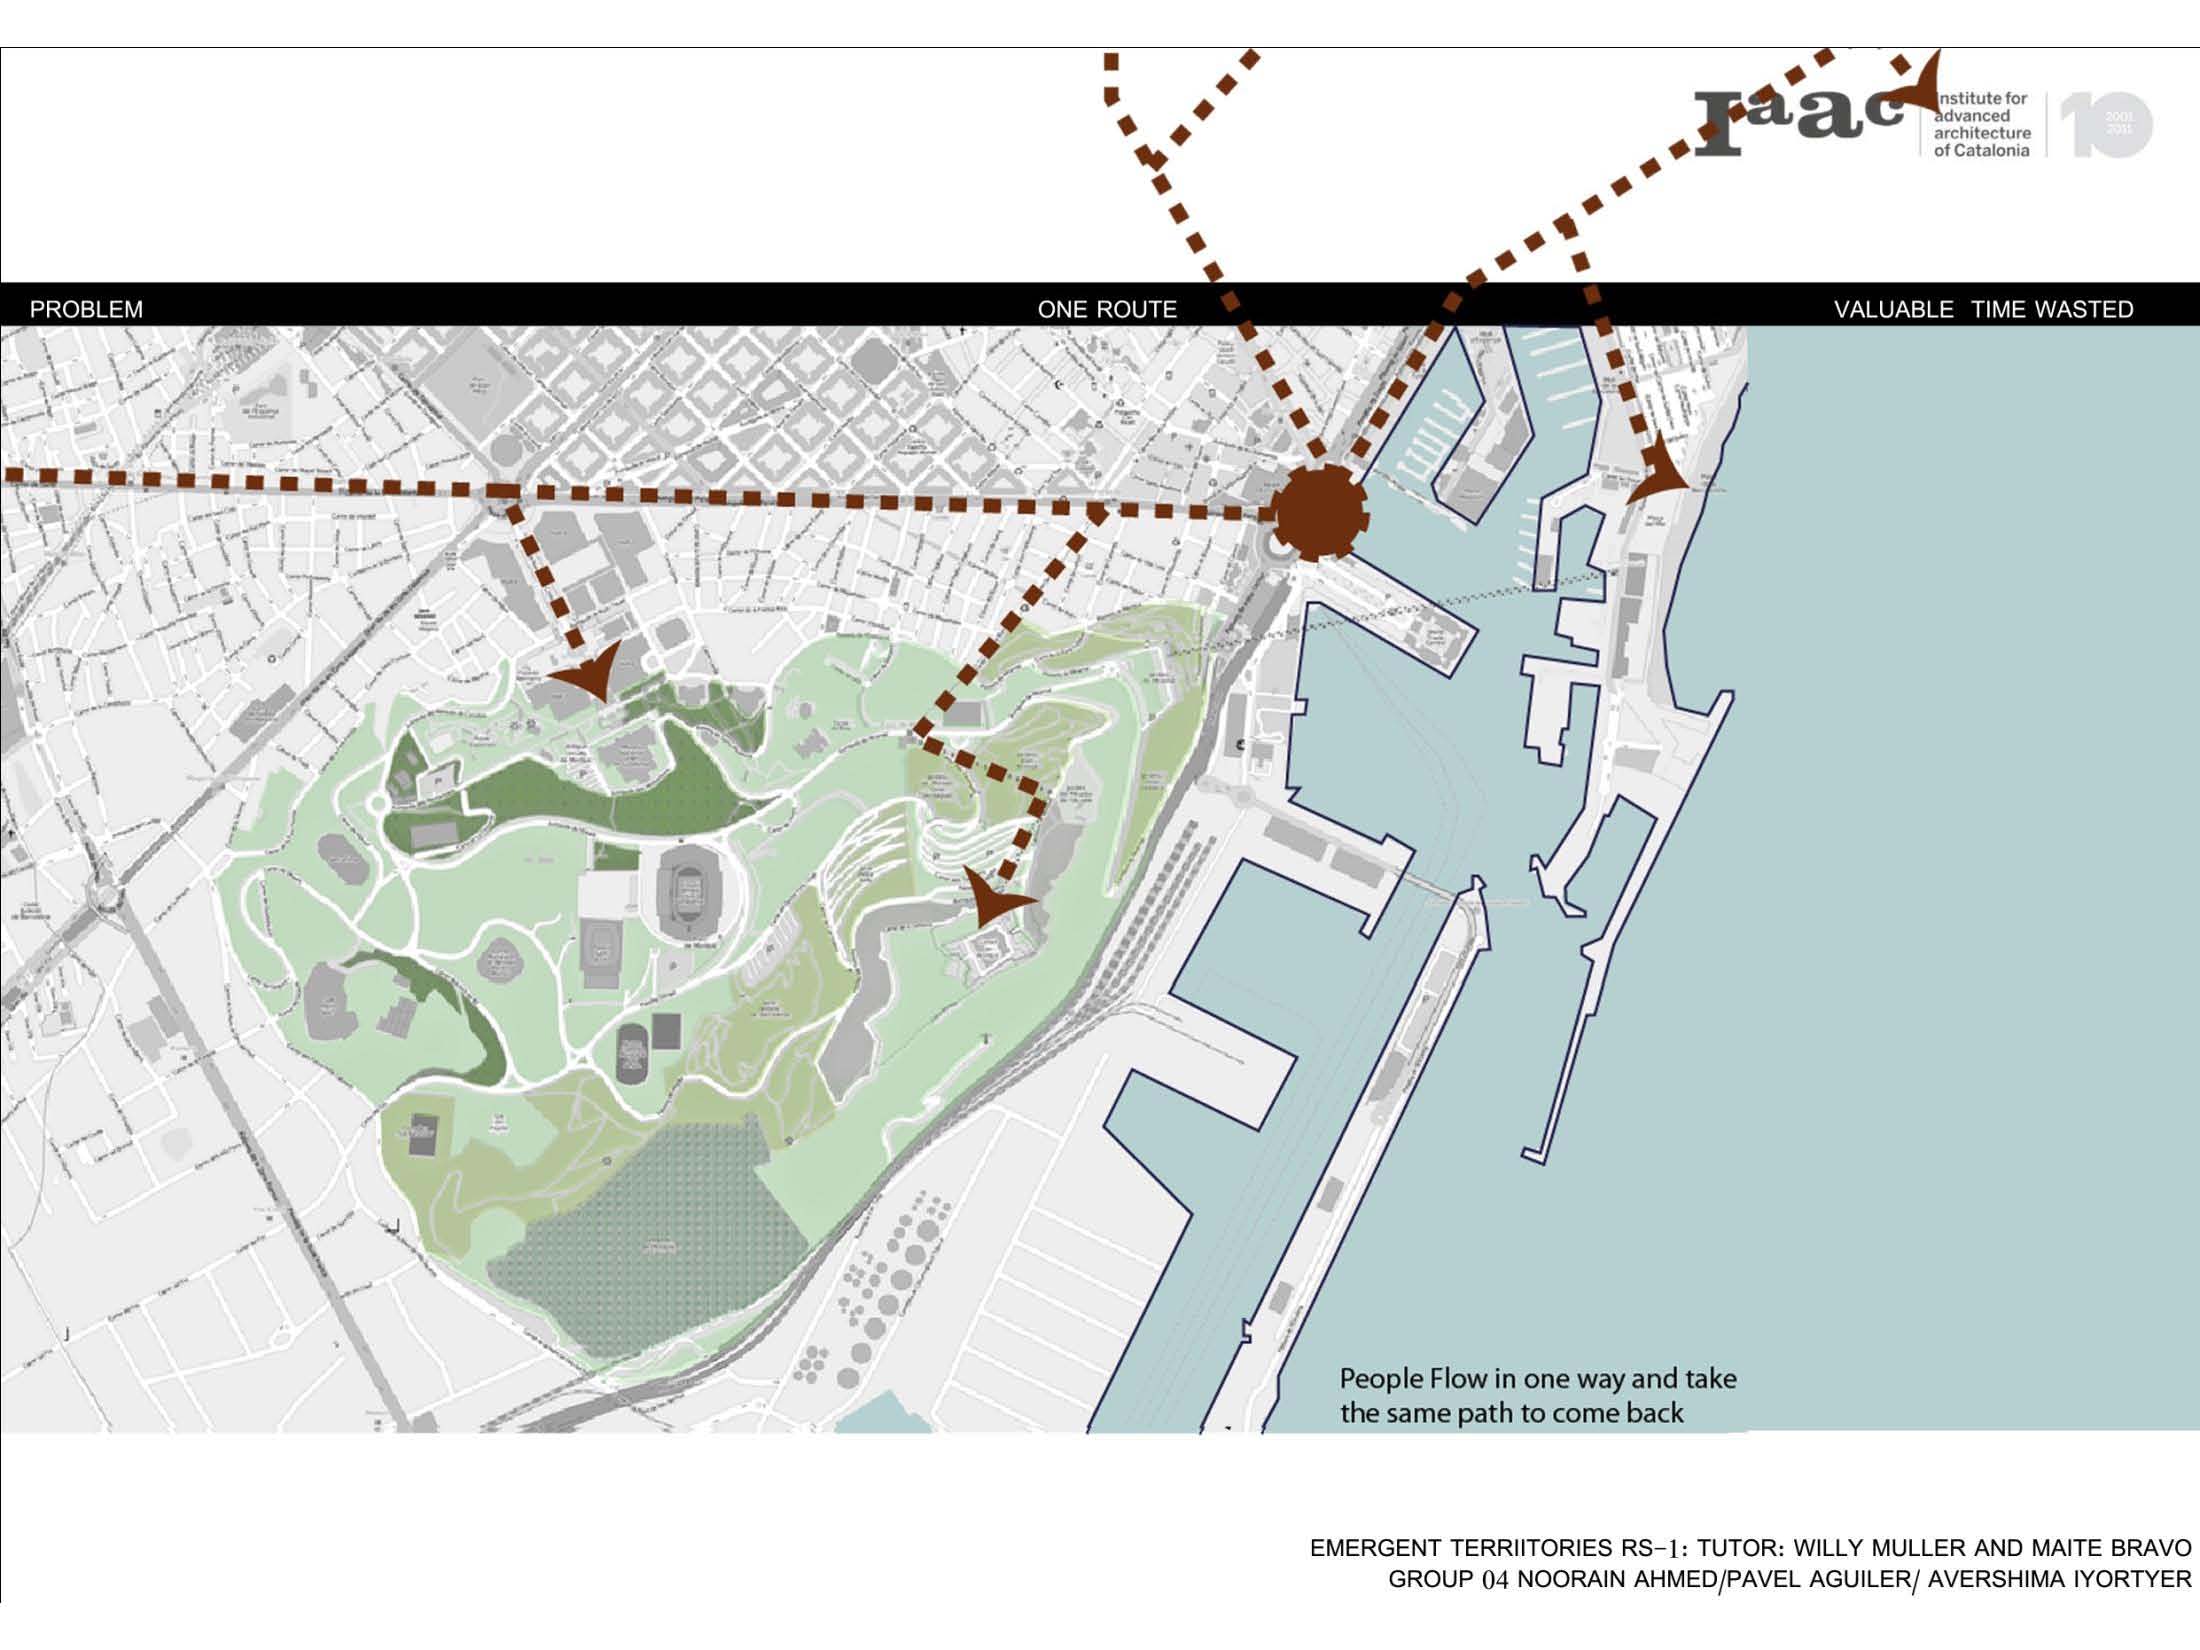
The Analysis of the site points amounts of people that comes from 1000 to 3000 through the port taking in count that there are different interests that can be perceived from the touristic information that we gathered from several sources.
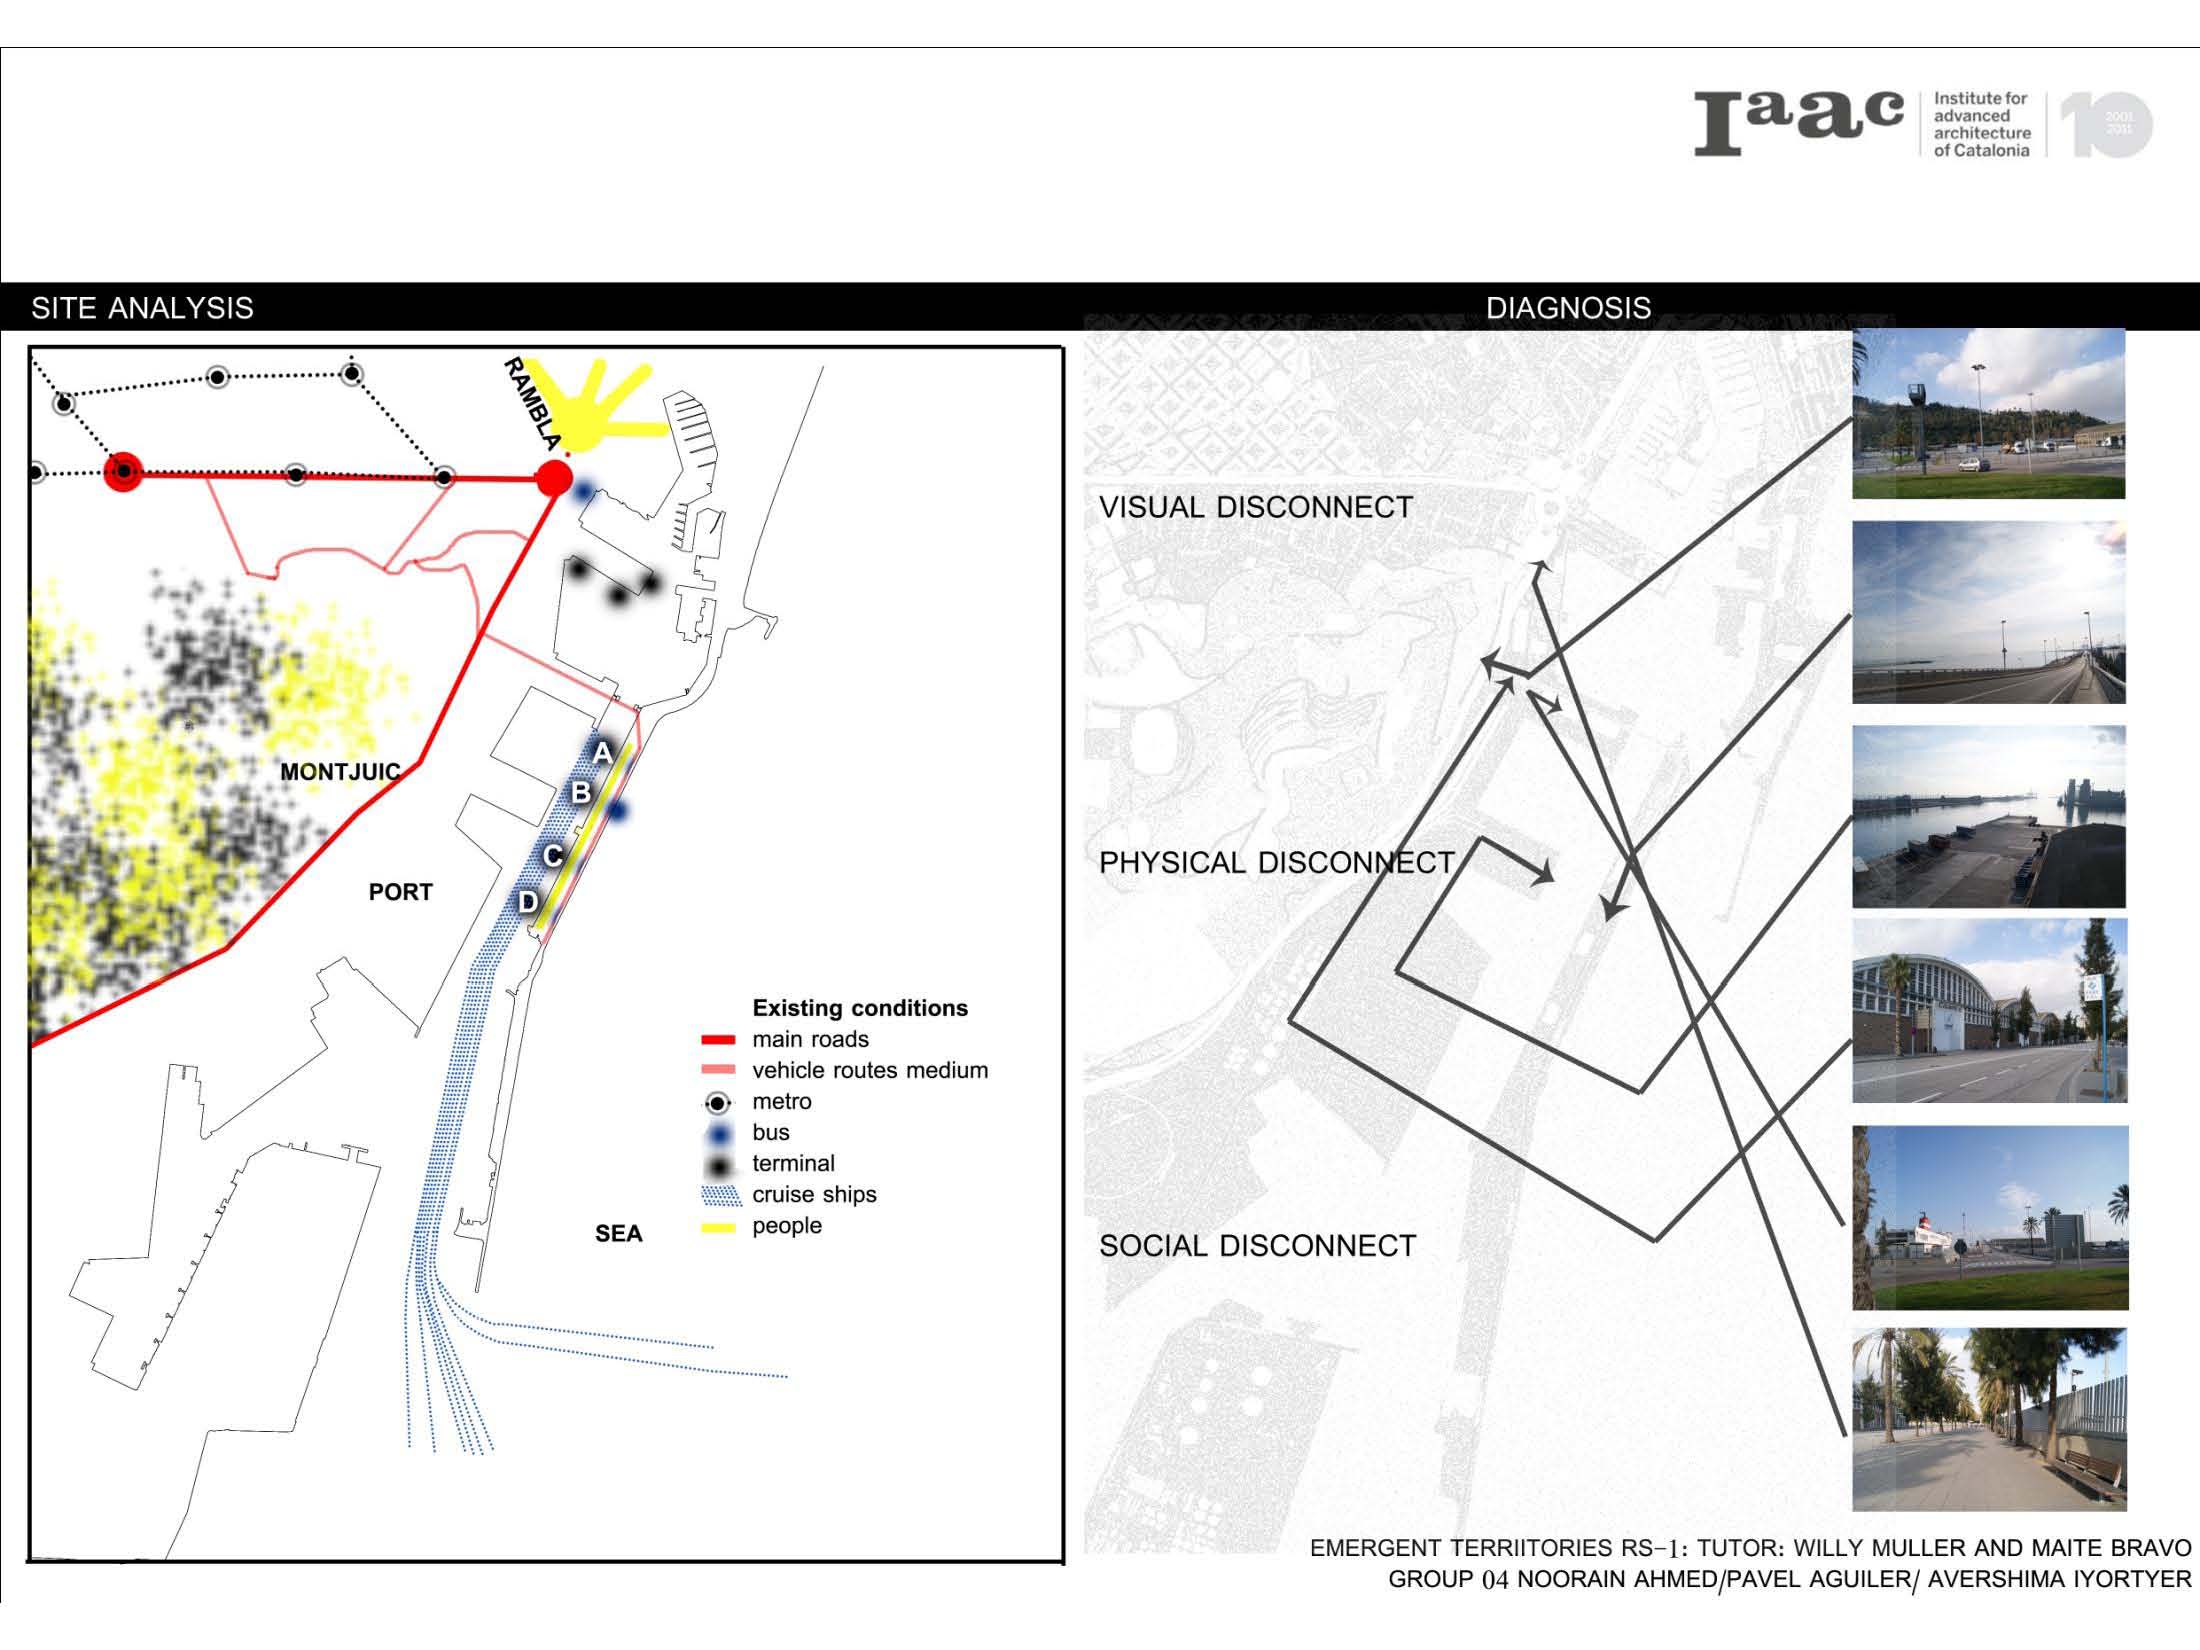
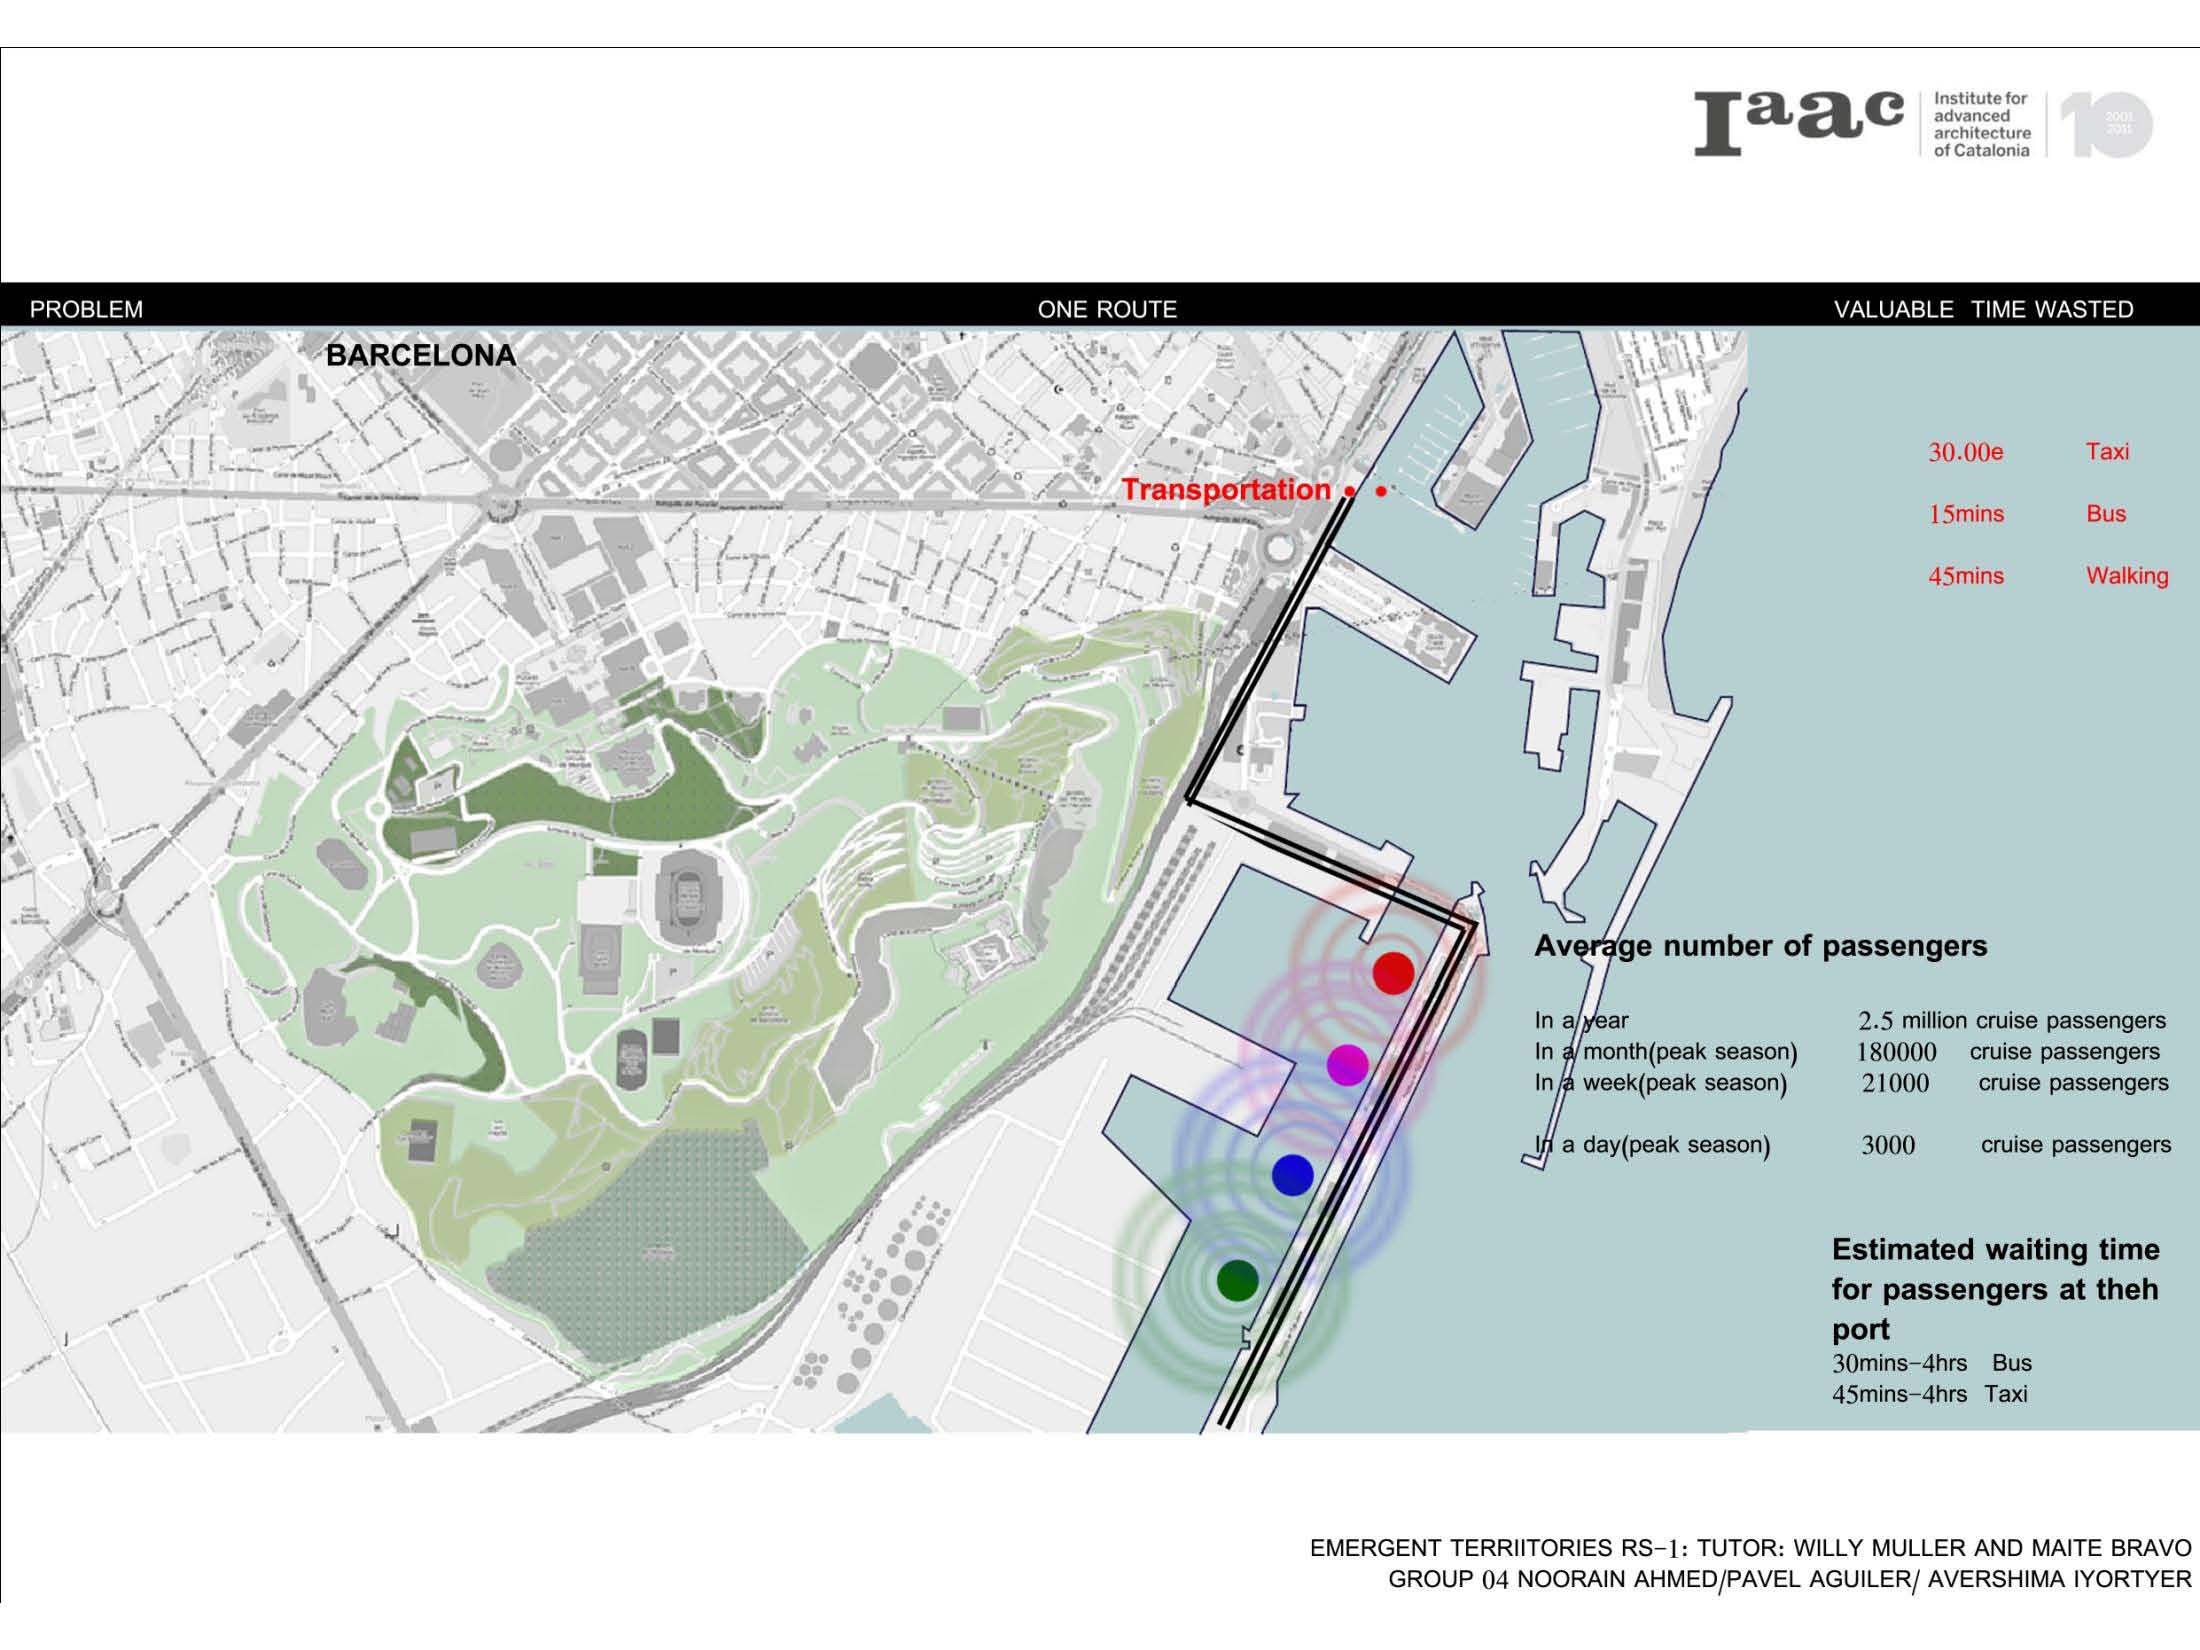
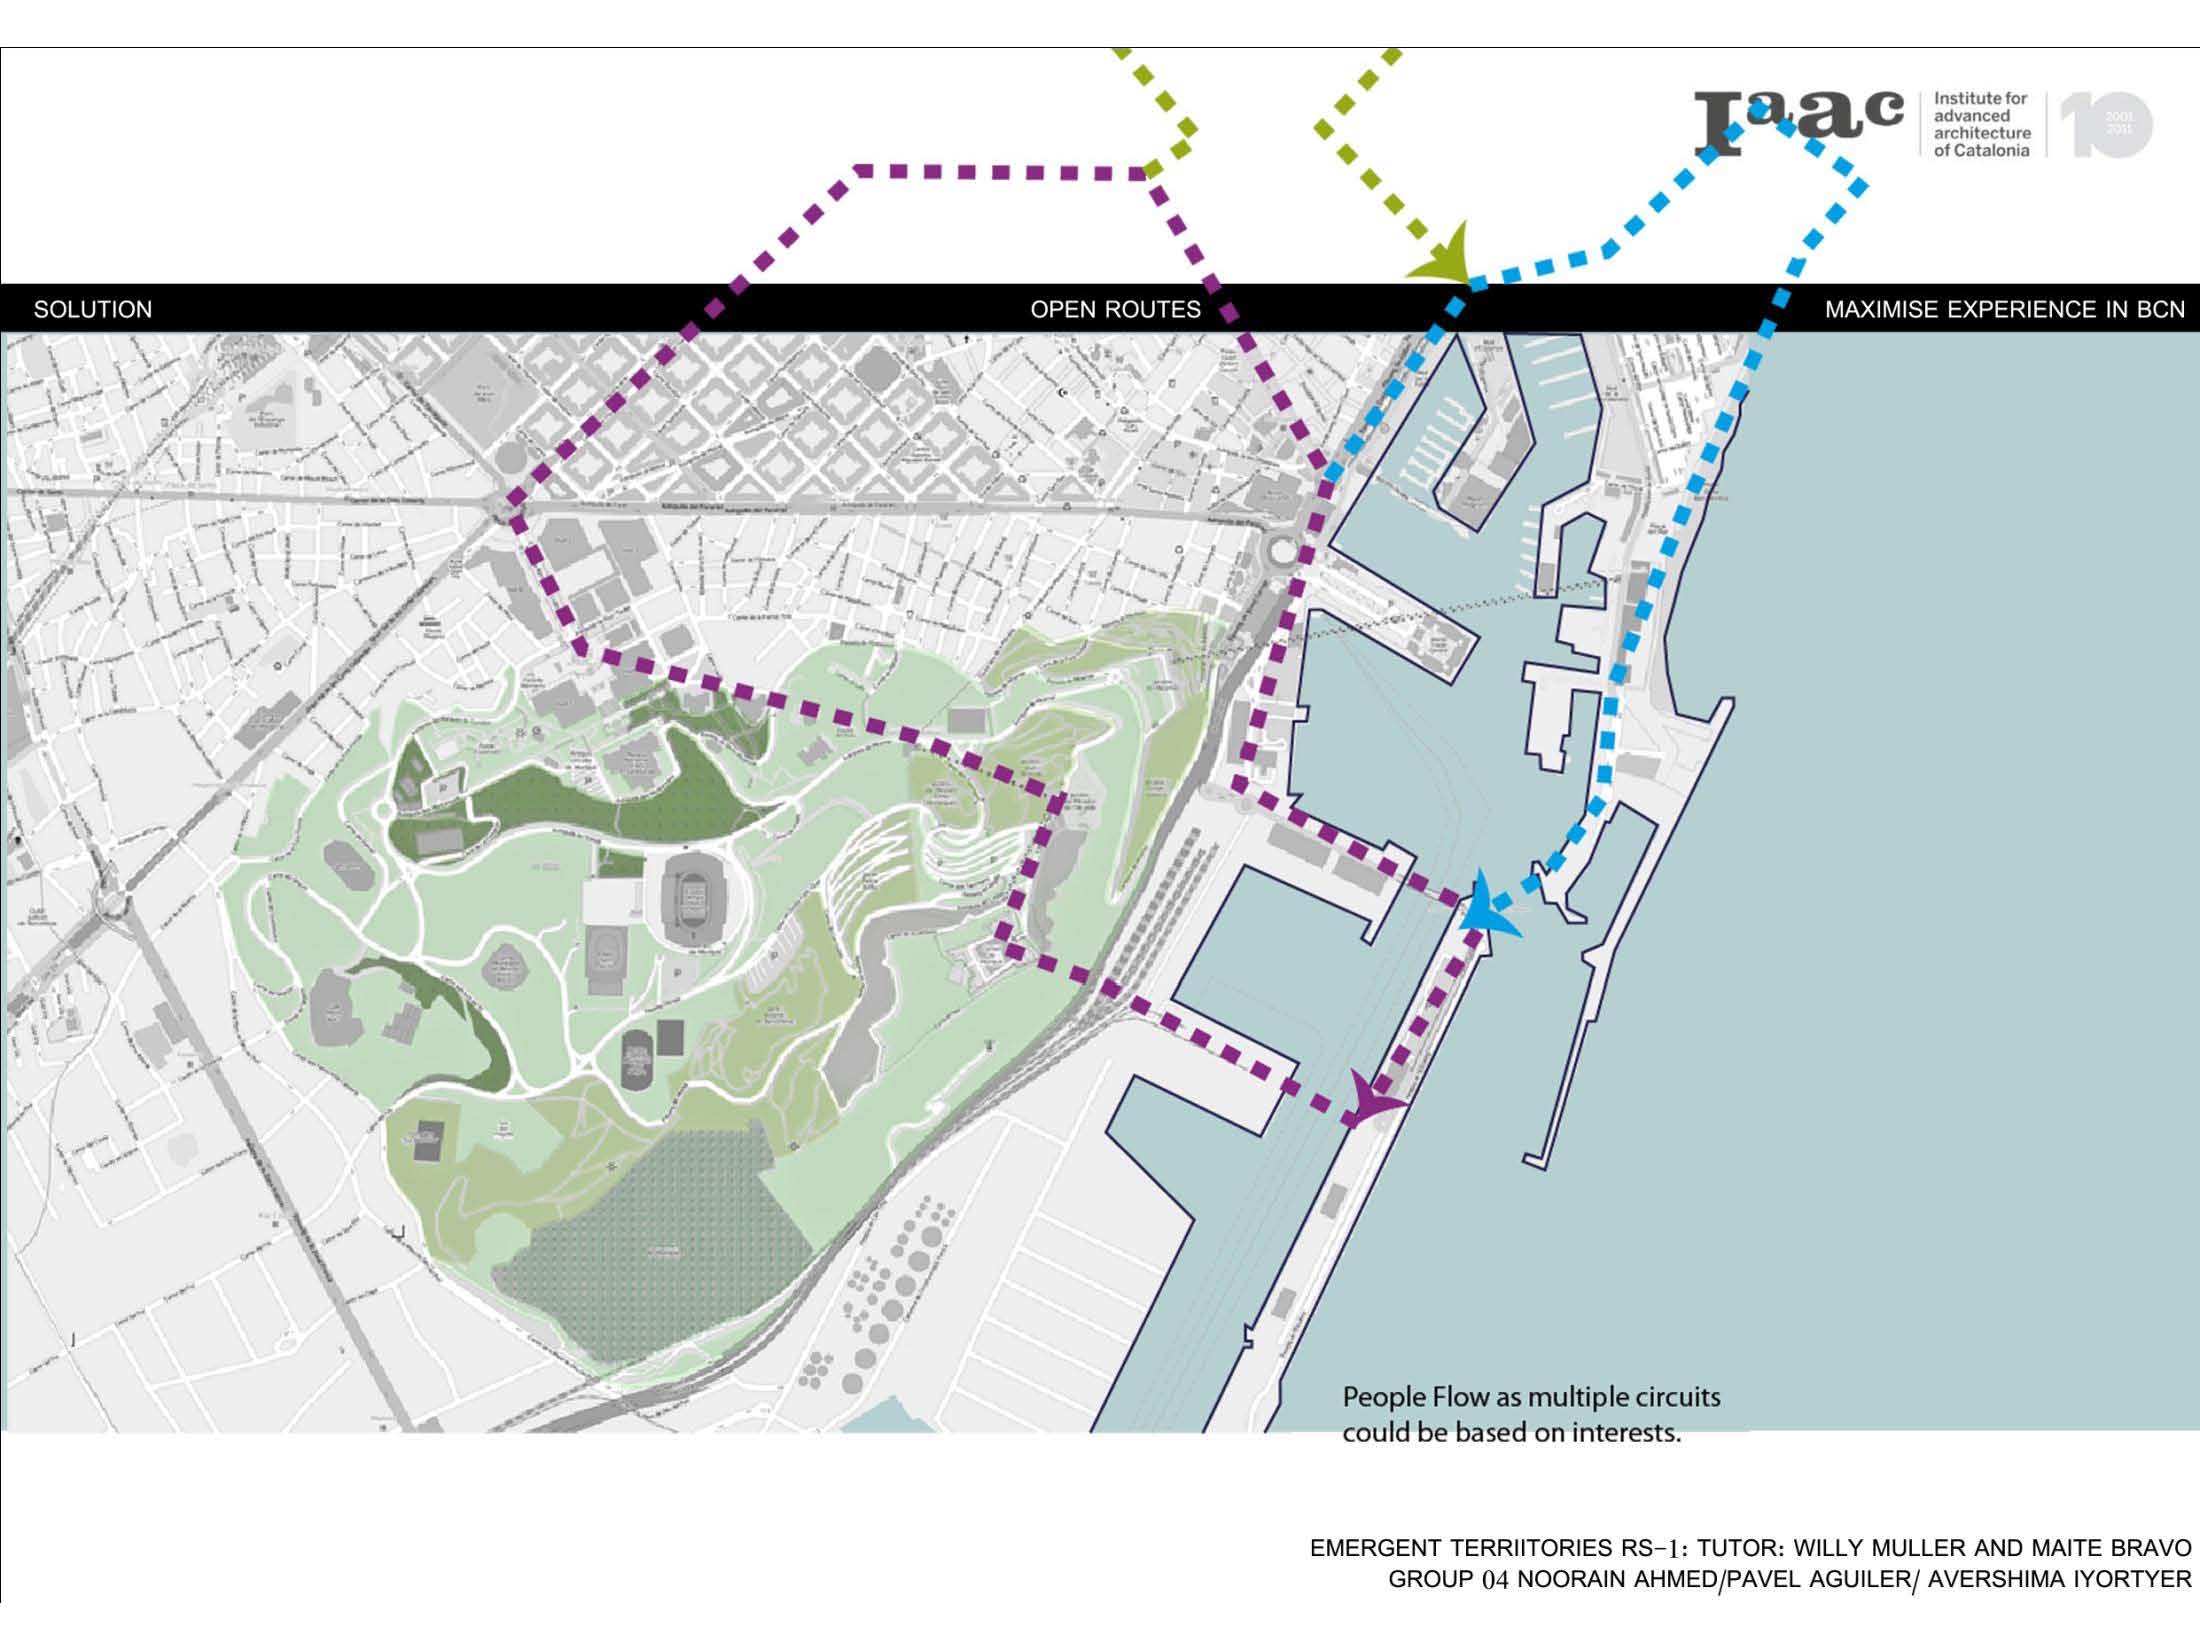
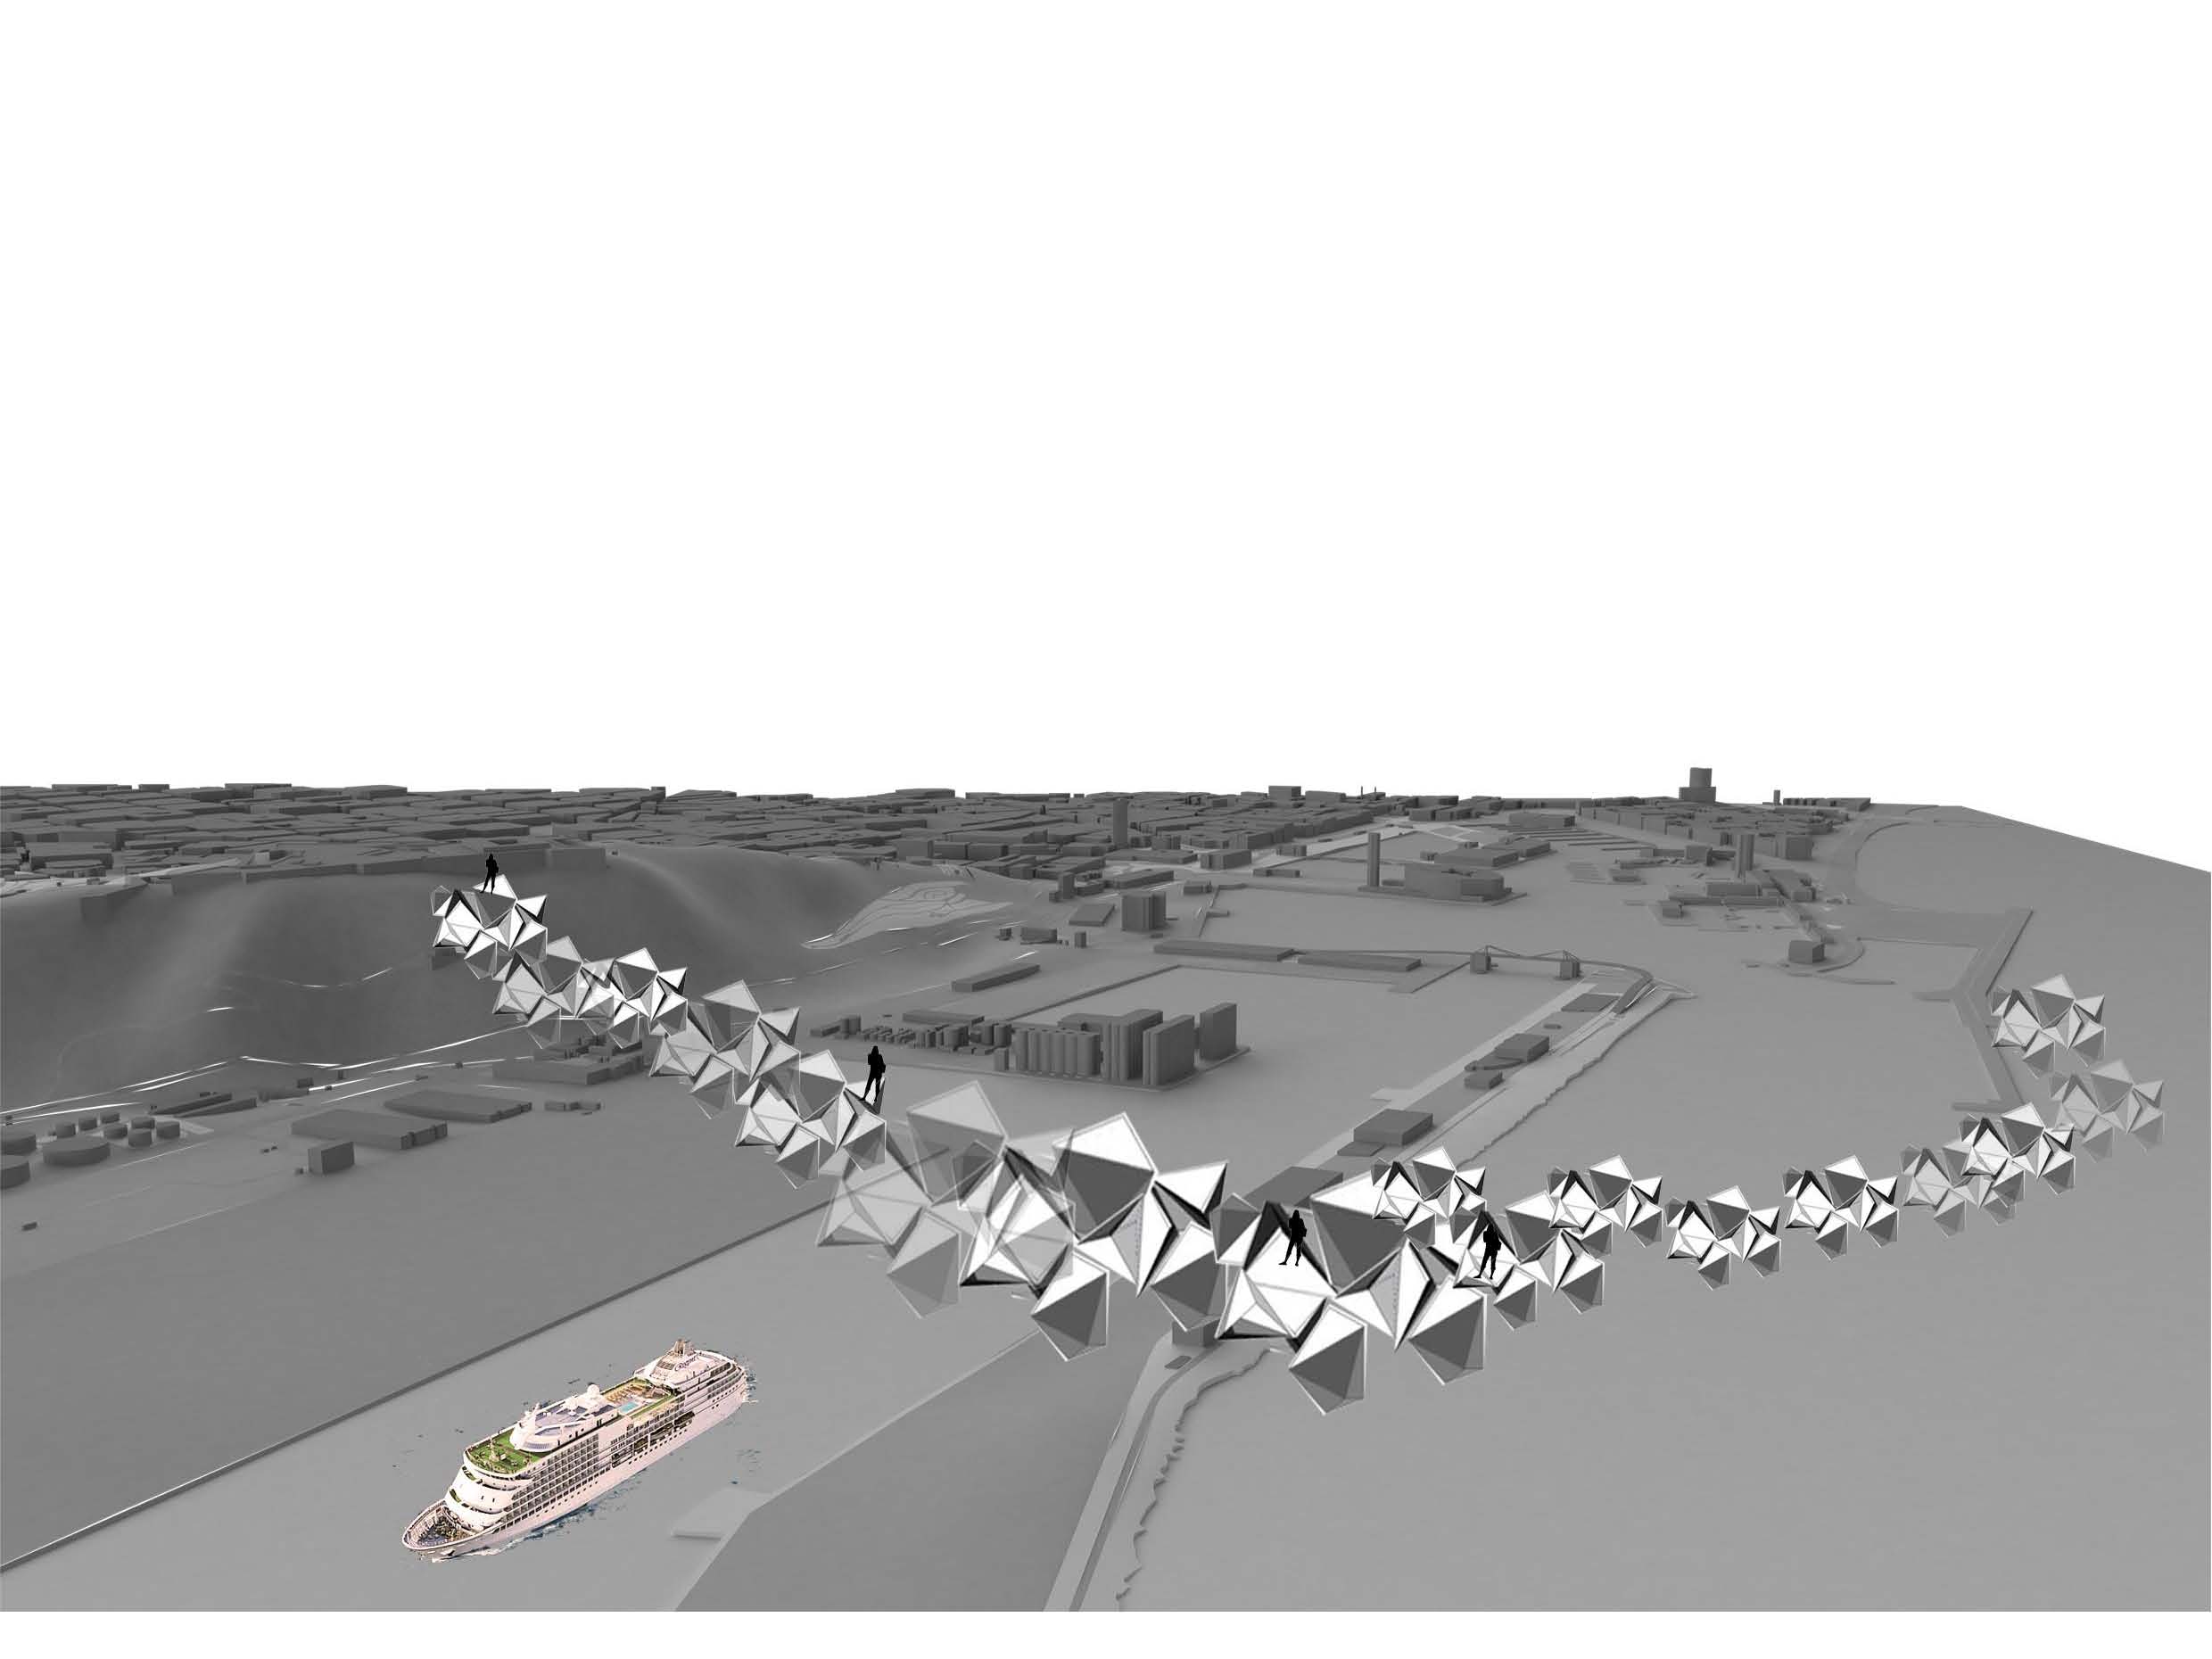
One dynamic that we noticed is that there is only one way to leave the port, this is what costs to passengers from half to 4 hours waiting at the port. The strategy focus on getting data from the users and give it back to them in order to take advantage of the new connections made and a new way of tourism coming from the sea.
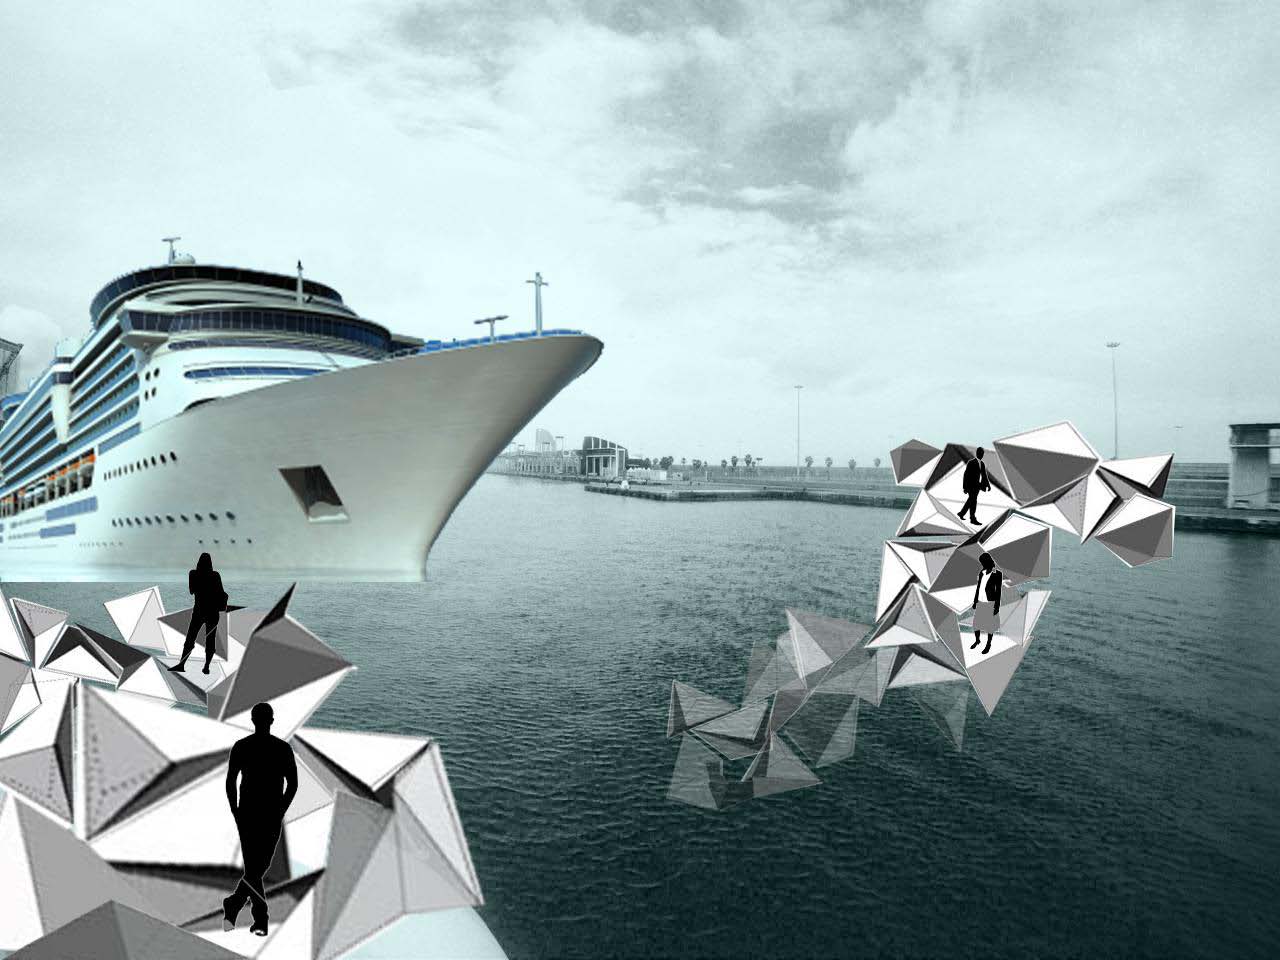
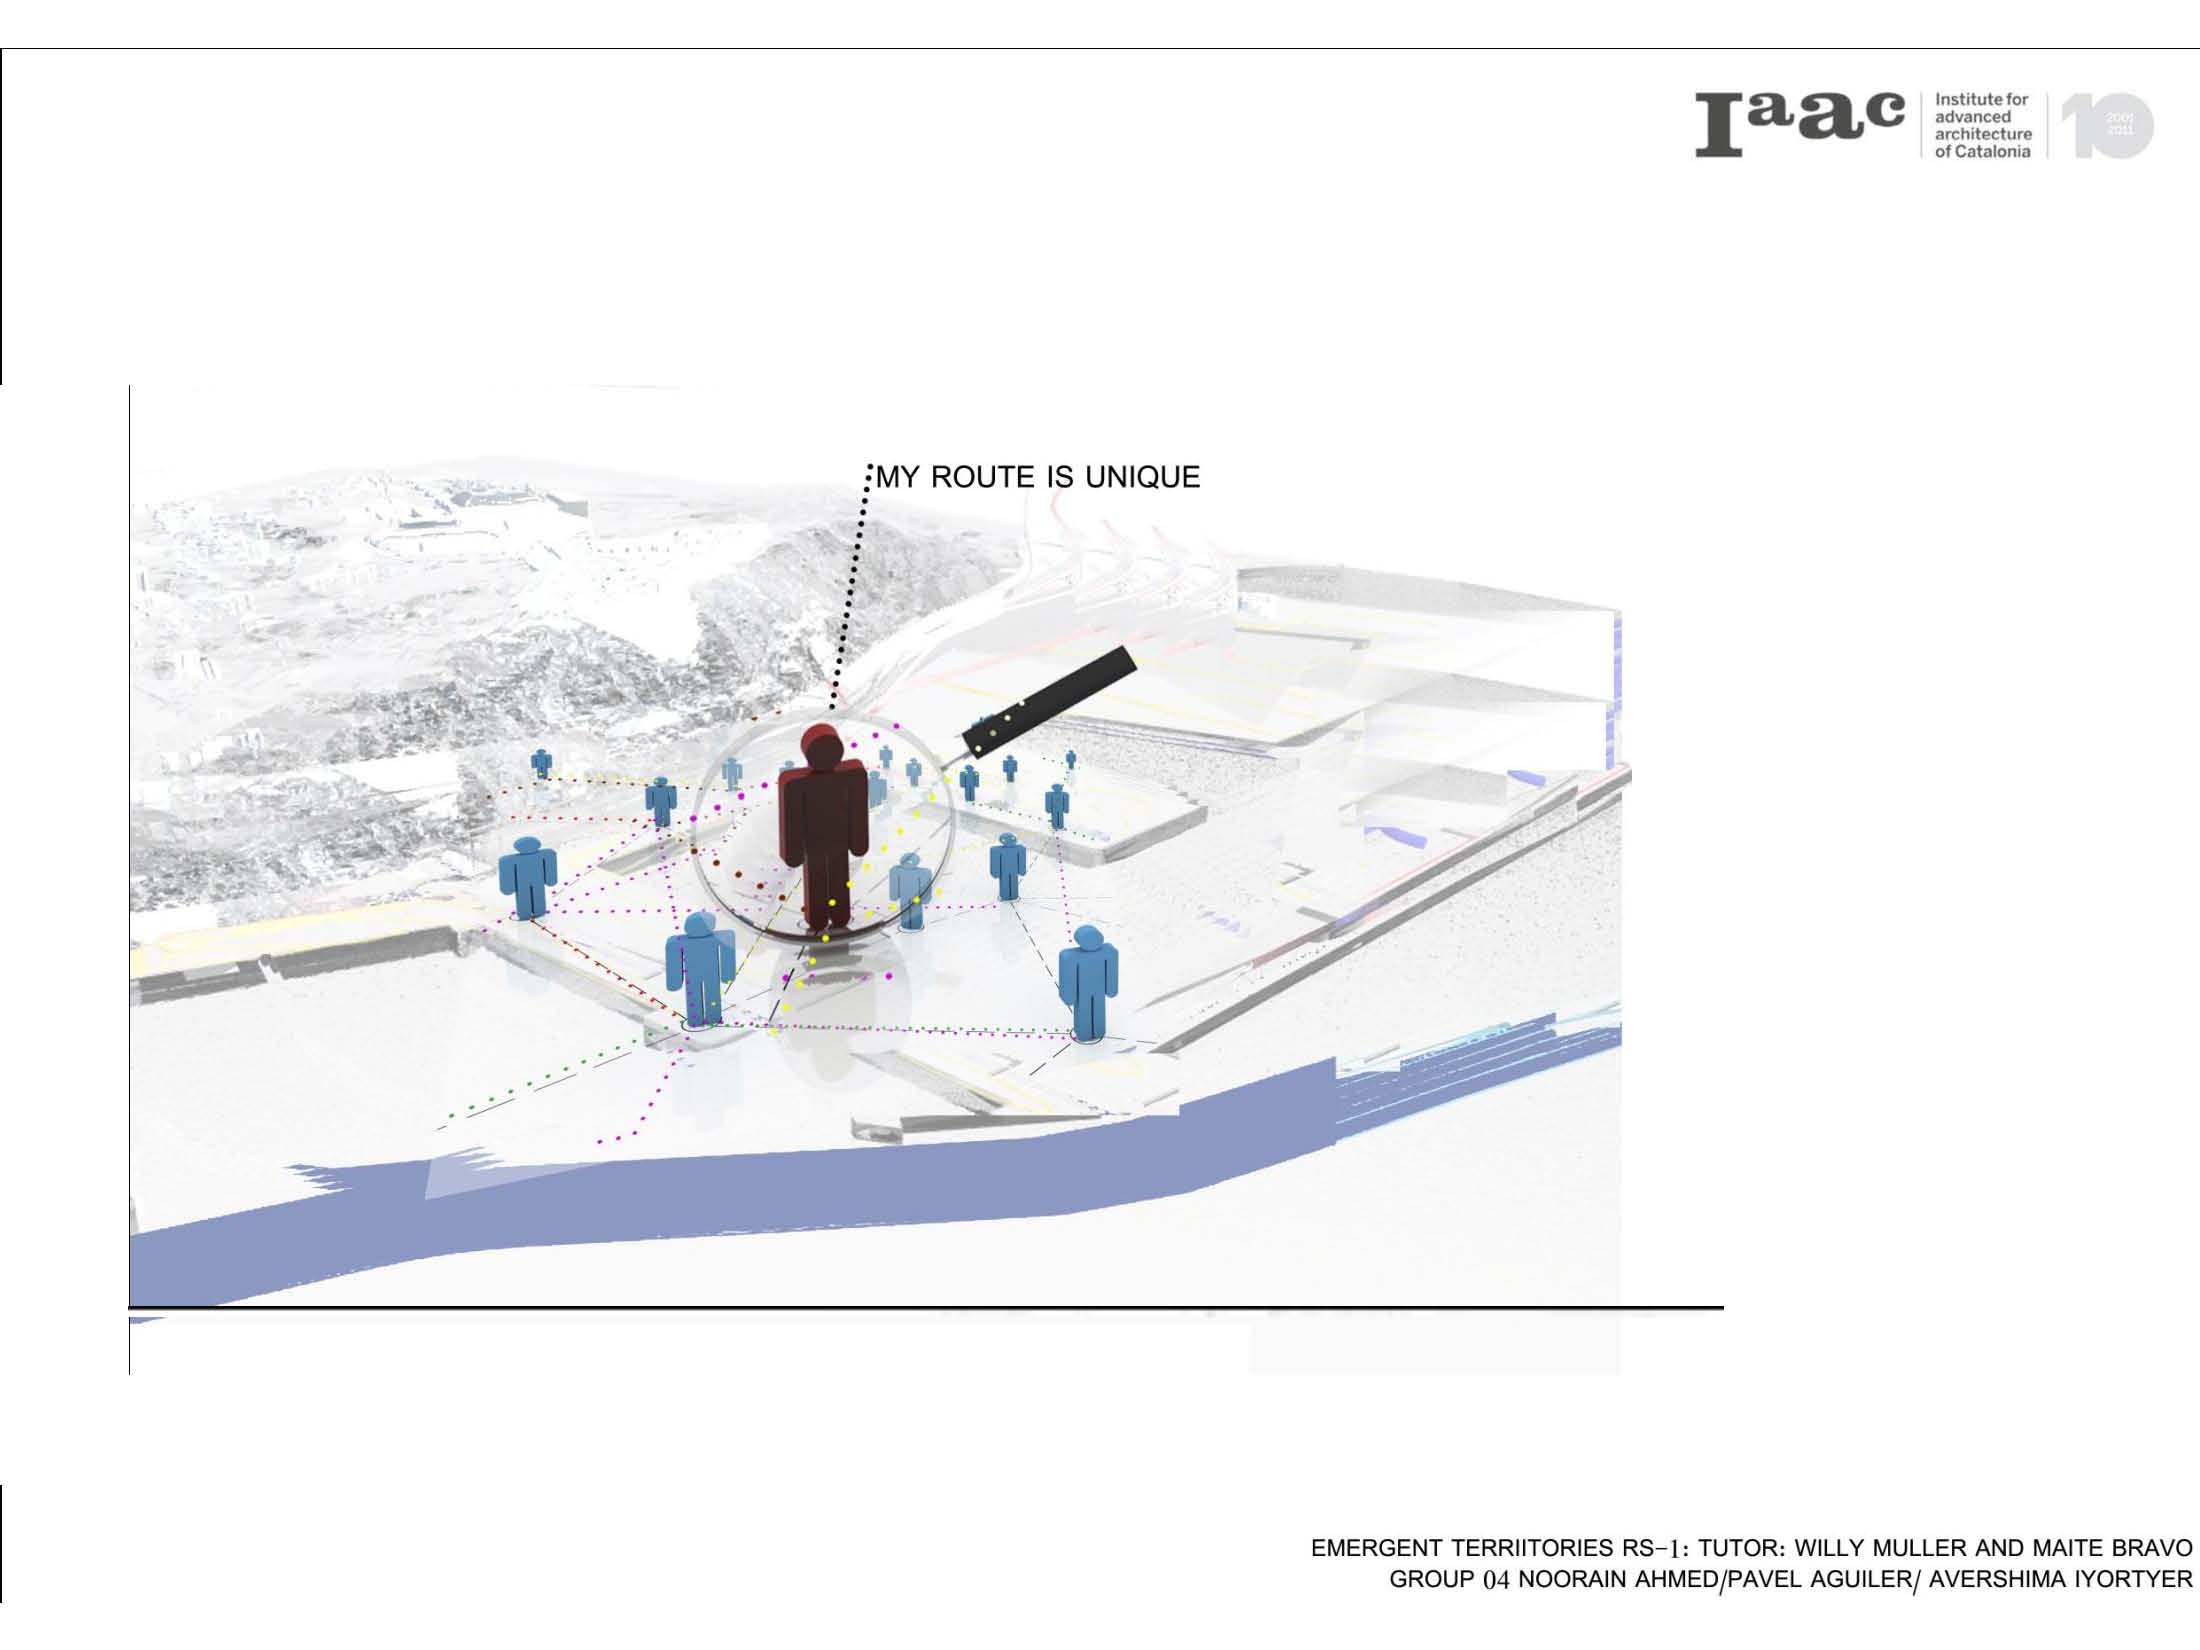
The first and last slides represent the idea of connection and is not a physical interpretation of the project for the port, is the conceptual image that says it could be anything, but at this step we were developing the idea of connection based on data.