Aim of the exercise – to track myself using mobile app. After the data is collected to import it to Grasshopper and visualise on map.
Goal – to visualise locations where the biggest amount of time was spent.
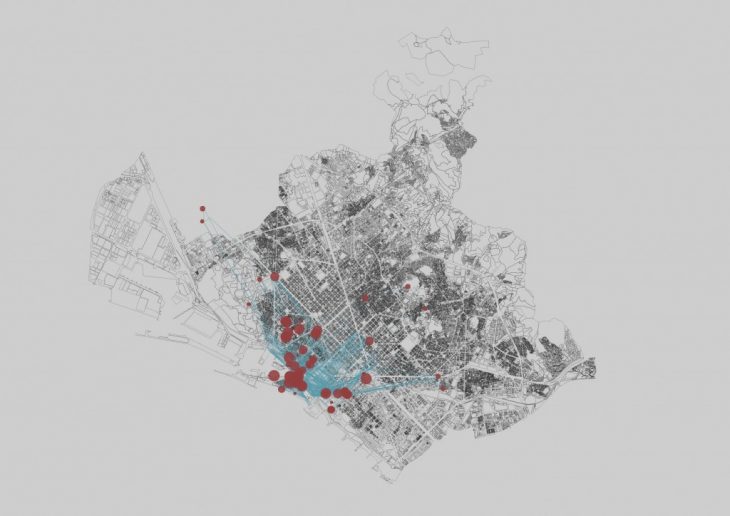
For stalking yourself assignment Moves app was used. From this app it is possible to extract two main types of files: GPX and KML. KML contains data with locations of the points where the most of the time was spent and the duration of it. GPX contains more detailed data and time of movement track. Both data files were imported into Grasshopper and visualised on Barcelona maps.

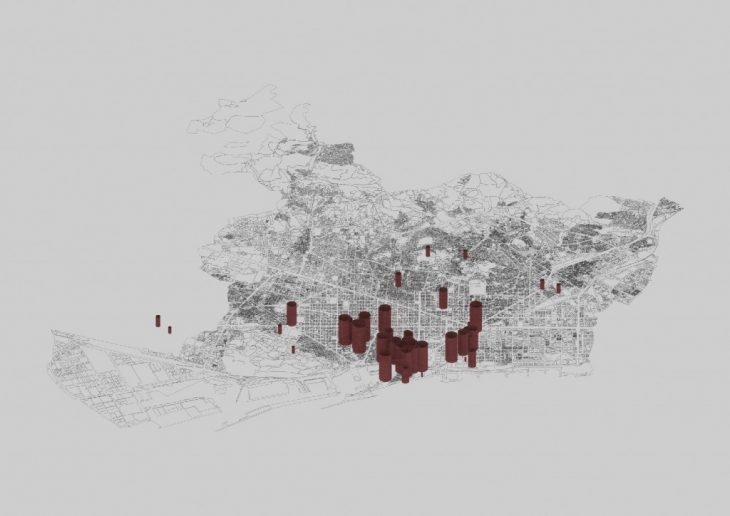
Firstly KML data was used. This type of data let visualise locations where the most of time were spent while tracking myself. Circles outside Barcelona shows Smart City Expo. The size and height of circles determine the amount of time spent in location.
Also, it was necessary to create boundary around Barcelona to exclude weekend trip points that are outside of Barcelona area.
Secondly, GPX data was imported, since it provides more precise track locations and it is easier to stalk exact walking route. From this file more points were extracted and it allowed to draw walking route.
Nonetheless, file was not tracking precisely route all the time. Therefore it was necessary to reduce the length of track (till 250 meters) in Grasshopper. In this way it was possible to visualise only the path that was taken instead of connecting two points in program automatically.
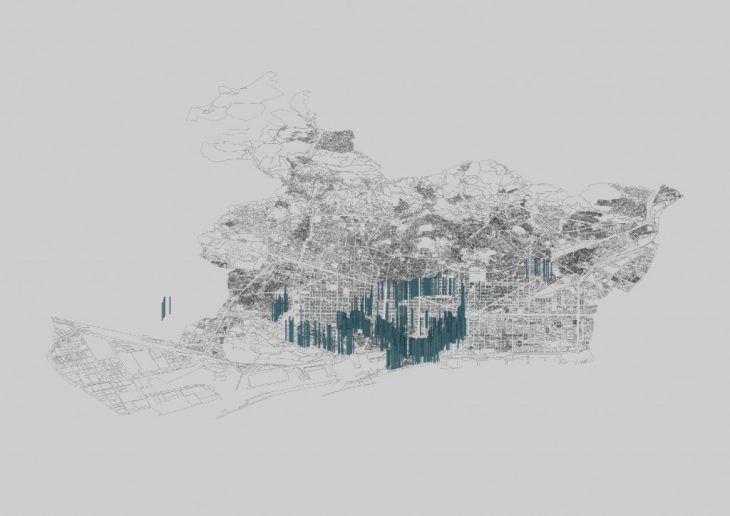
Also, counting on GPX time stamps within the route it is possible to visualise the time spent between locations. From axonometry below it is visible that jogging took place along seaside and the time spent there is shorter in comparison with route to any other places.
“Computational Design. Assignment 1- Stalking Yourself” is a project of IaaC, Institute for Advanced Architecture of Catalonia developed at Master in City & Technology in 2017 by:
Student: Saule Gabriele Petraityte
Faculty: Rodrigo Aguirre