Speculation Climate and location are fundamental for architecture design. Beyond the cultural, religious, historical differences between different human groups, we all share common needs for food, clean air and water, socialization and a healthy habitat. Plants have adapted to different climates all over the Earth’s surface, in a way that architecture can assimilate for itself. The Köppen–Geiger climate classification map is based on the concept that native vegetation is the best expression of climate. Thus, climate zone boundaries have been selected with vegetation distribution in mind. It combines average annual and monthly temperatures and precipitation, and the seasonality of precipitation. -Wikipedia. 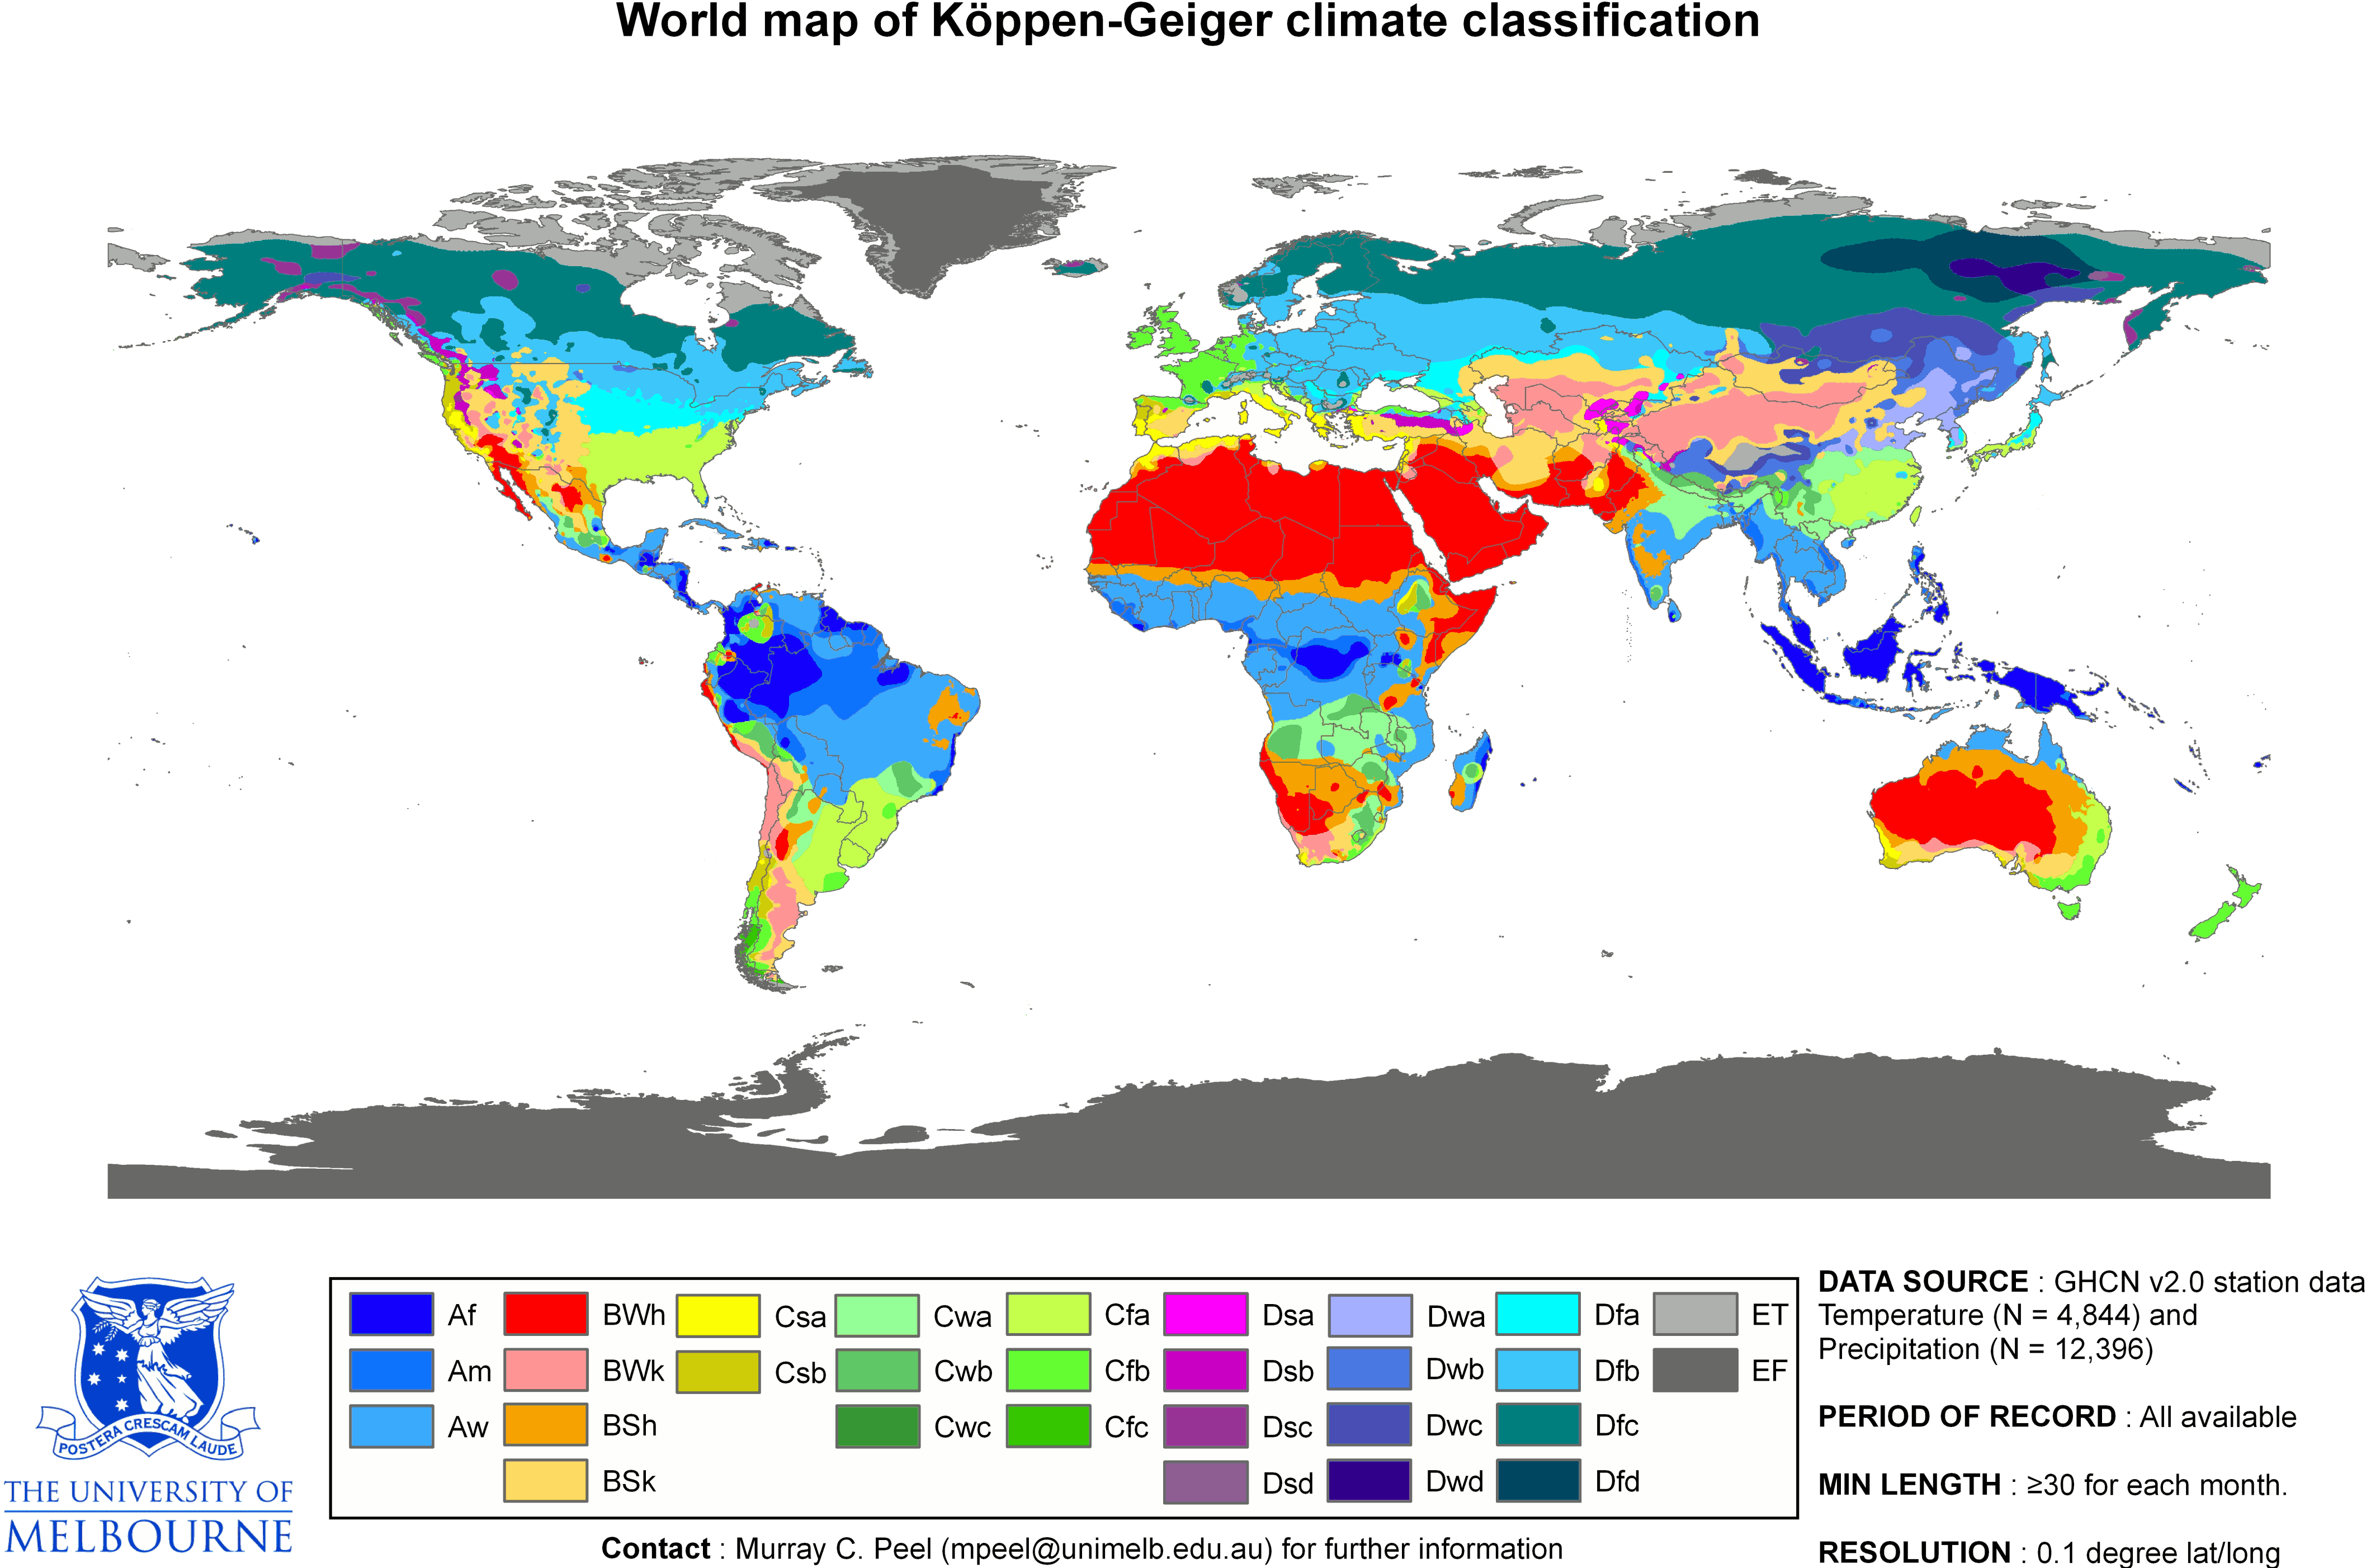 The Köppen–Geiger climate classification map. Wikipedia. Architecture is meant for the human wellbeing, improving the relation between people and their environment. This project analyzes the idea that architecture can be theorized in a way that it can adapt to similar climates, in different places of the planet. Can architecture develop a style for a specific climate that can adapt to different locations, in the same way that plants do?
 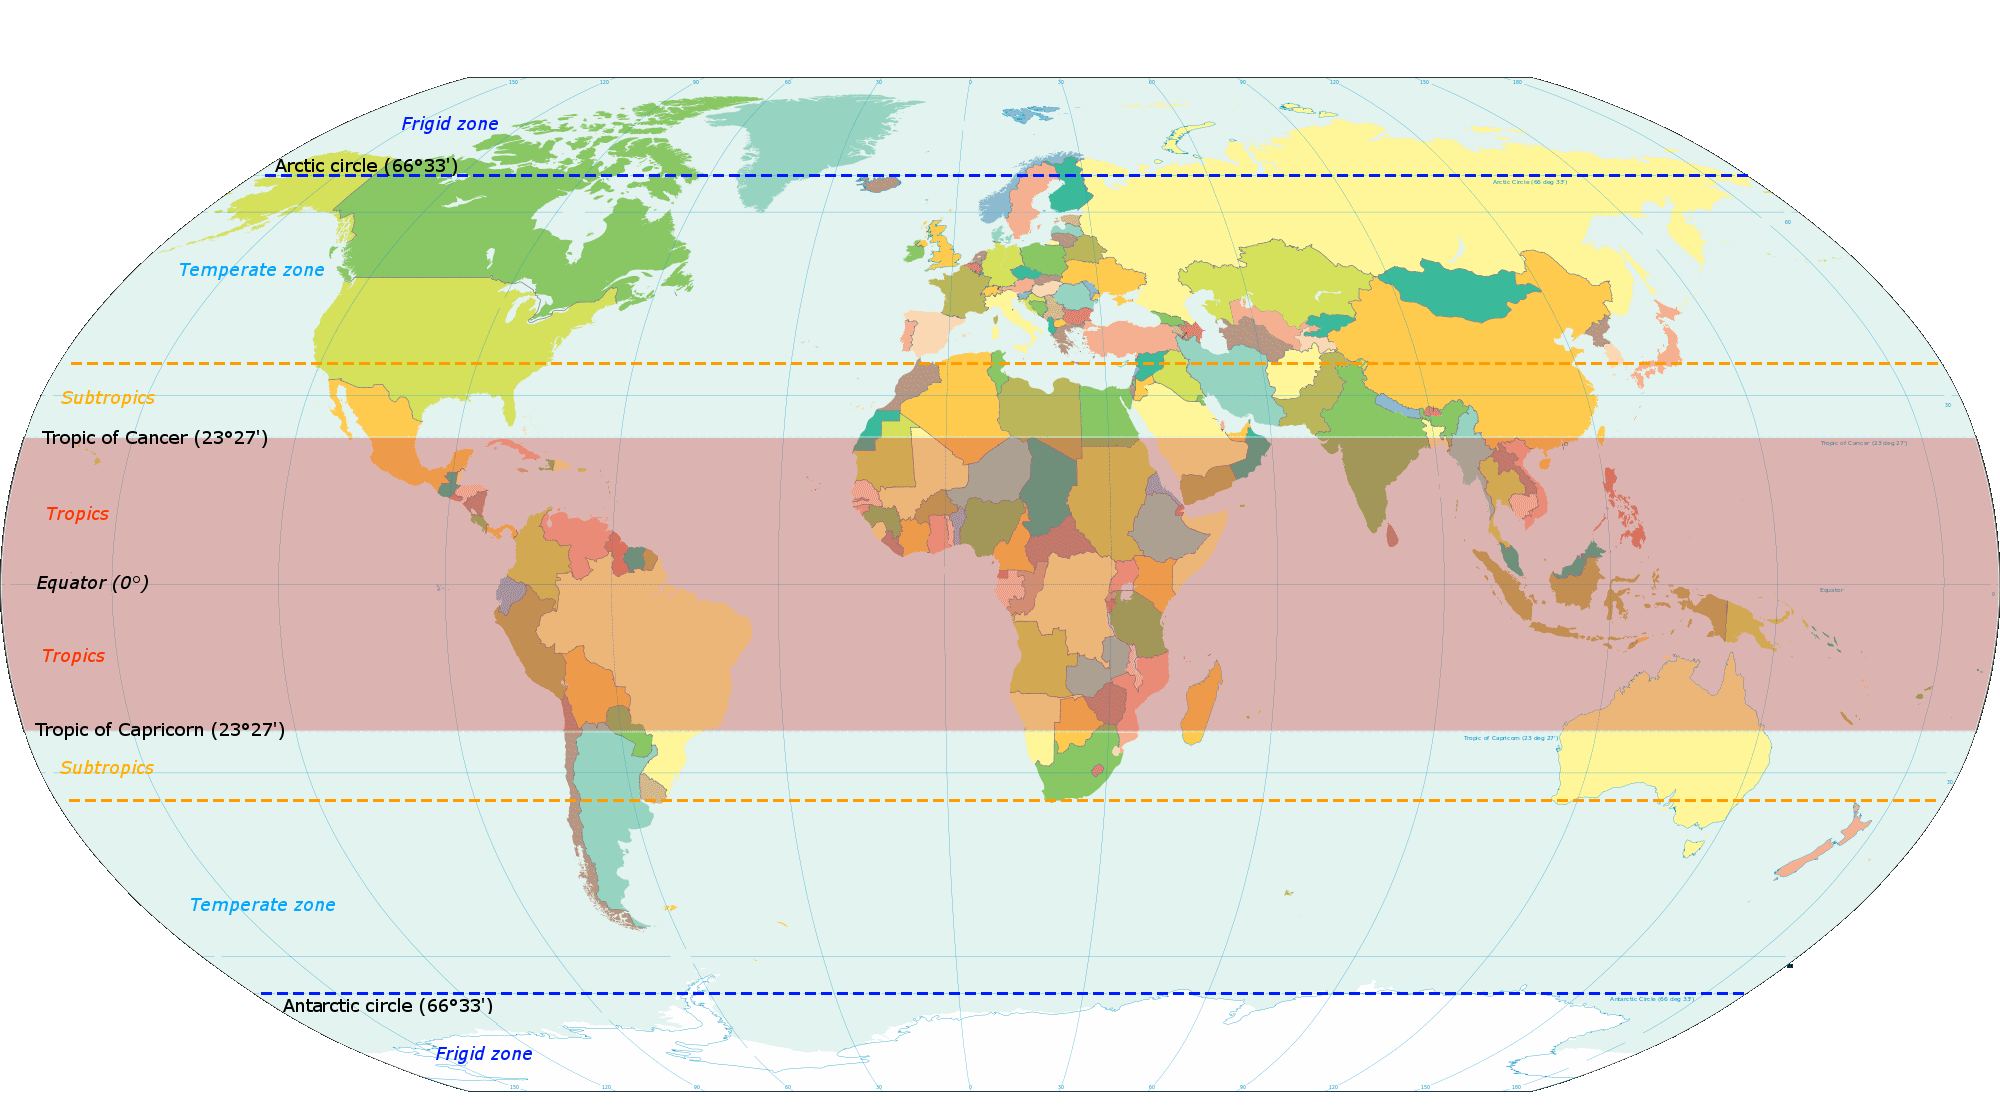 The classic division for climate regions of the planet. Wikipedia. Data Mining Data = population ? arranged according to the The Köppen–Geiger climate map in the tropical zones of the planet. The Köppen–Geiger climate map is crossed with the location and population of the main cities for each climate. In this way, it can be graphically appreciated where is the most important architecture development for each climate, and hopefully, the best adaptation to climate. The different architectures that share the same climate can transfer and share their knowledge to develop better architectural solutions adapted to the climatological reality of each region. Tropical zone on the planet According to the The Köppen–Geiger climate map, there are three climate zones inside the tropical zone of the planet: AF – tropical rainforest climate. AM – Tropical monsoon climate. AW – Tropical savanna climate.
 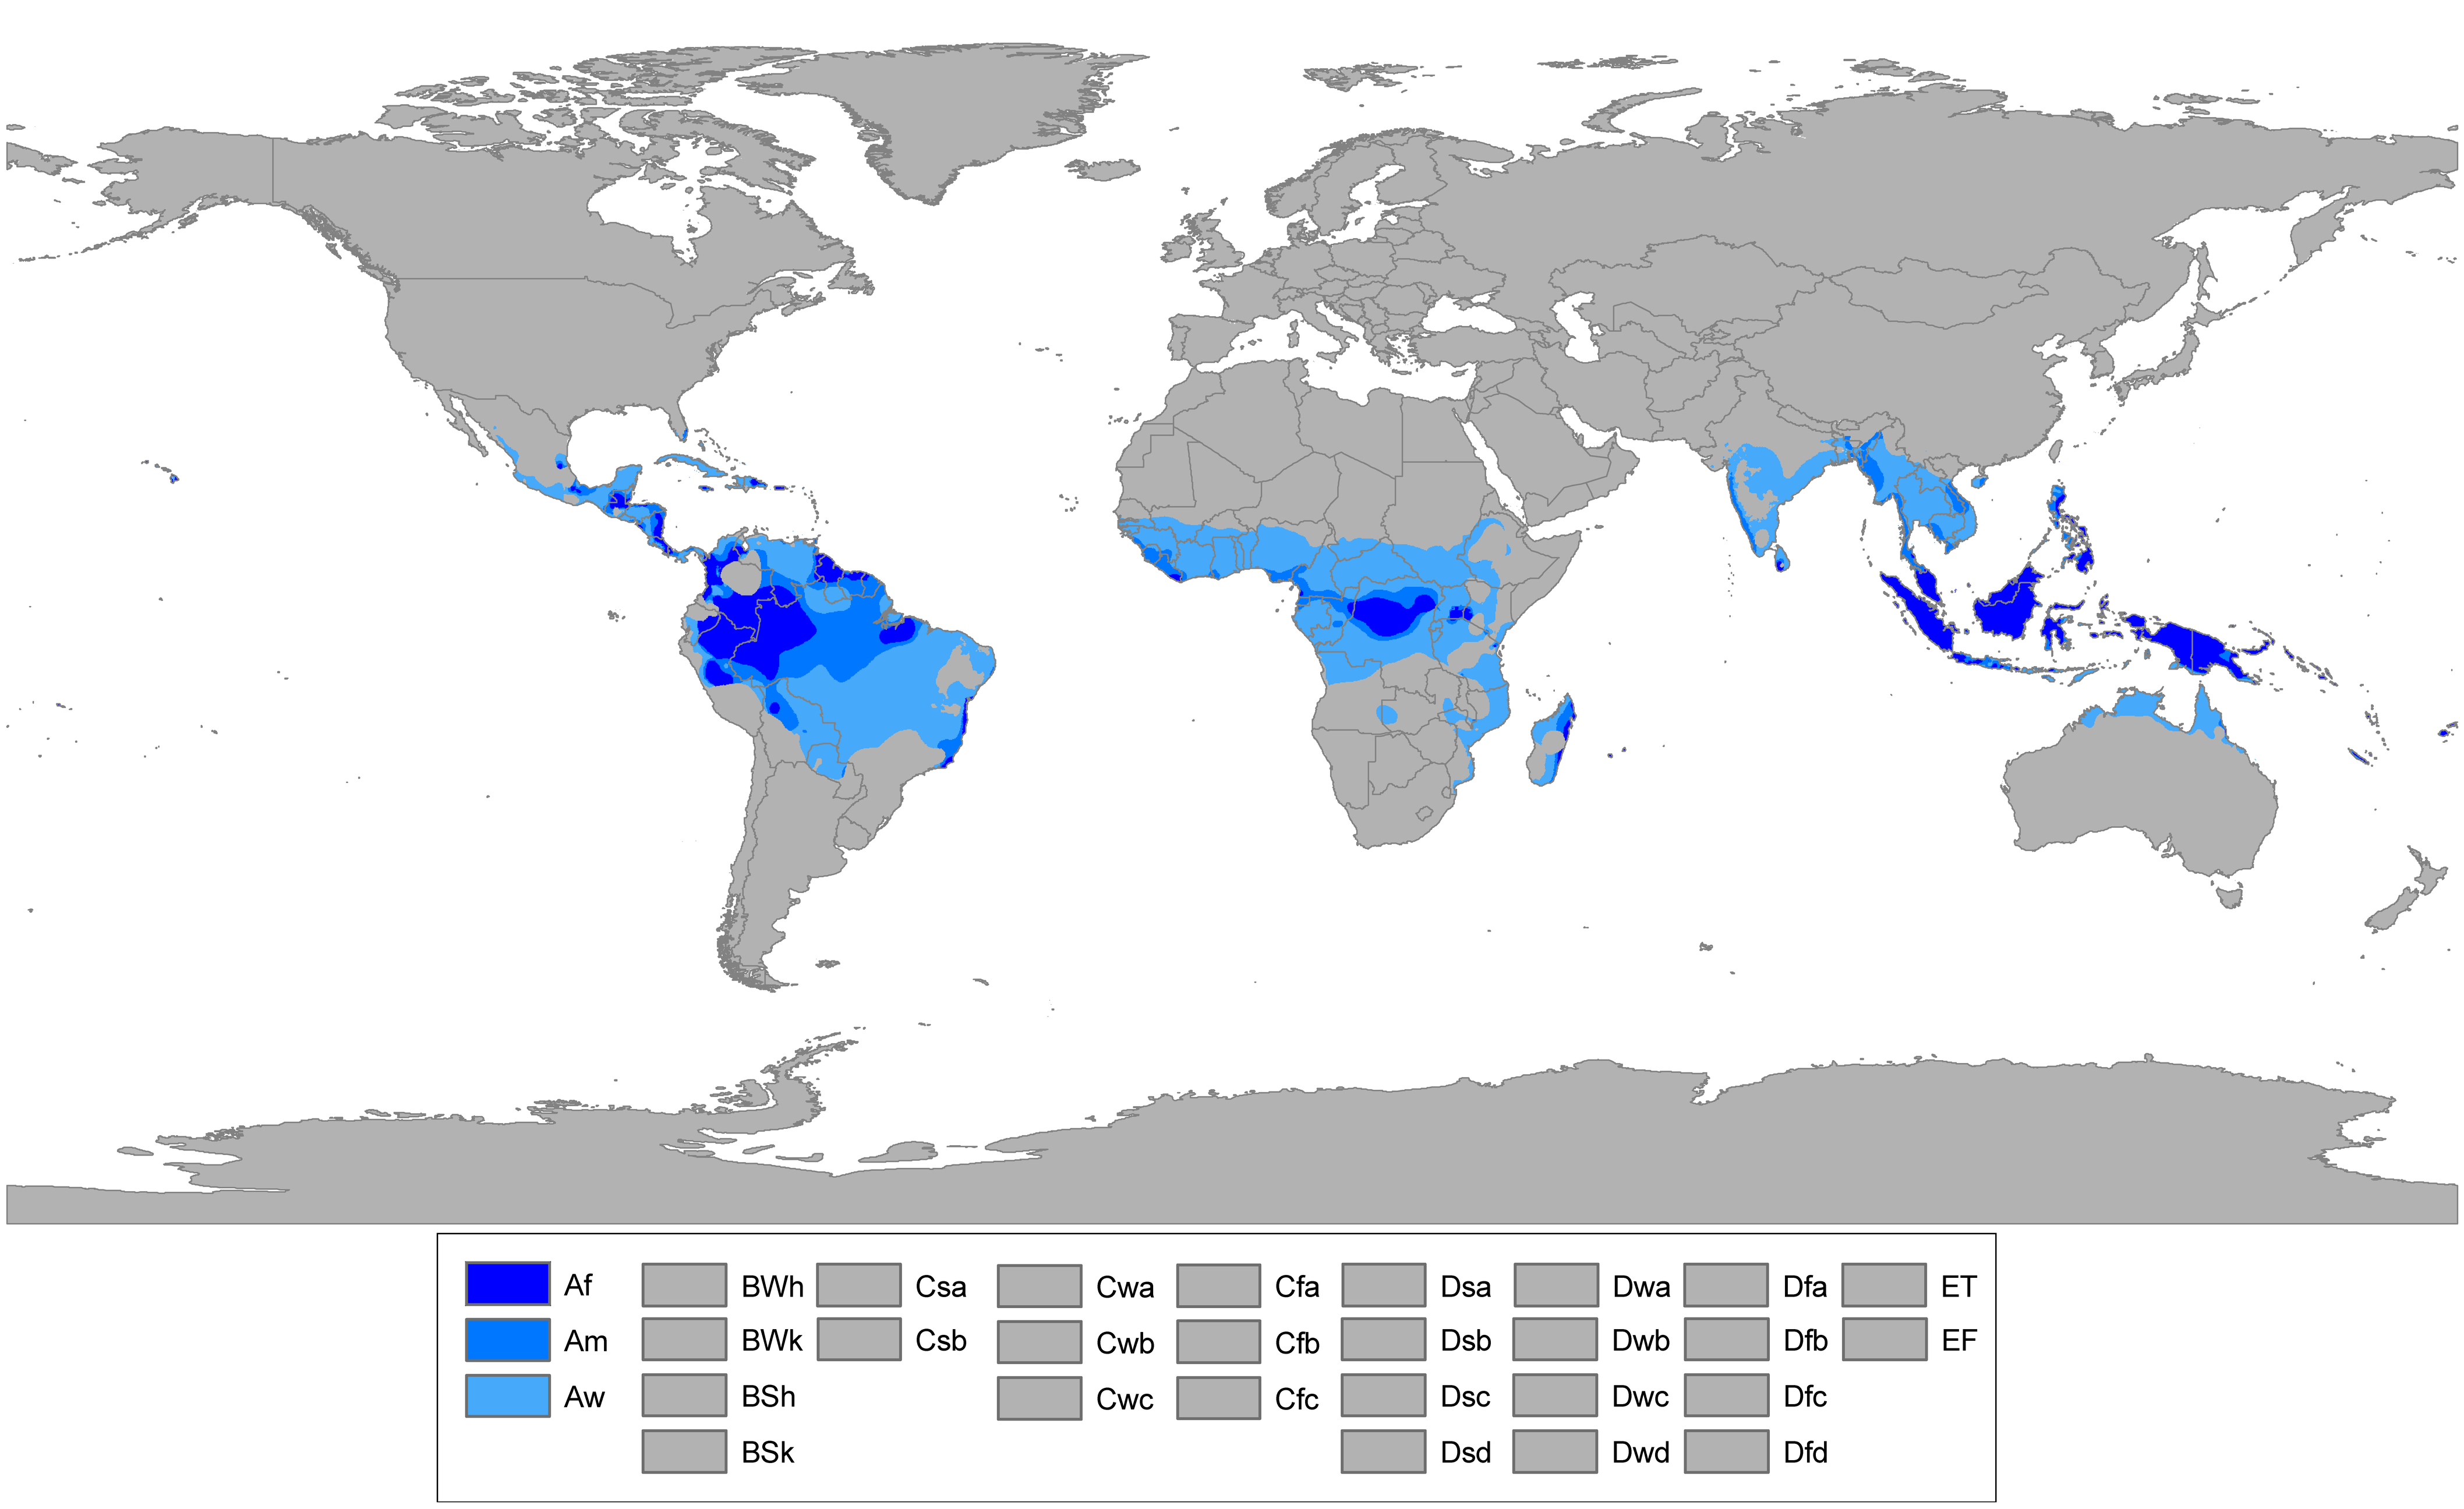 Tropical climate zones of the Earth where all twelve months have mean temperatures above 18 °C. Wikipedia. The zone of interest for this analysis is focused on the Tropical savanna climate. The analysis will show which one is the major architectural development at one specific climate, by mapping the main cities of the Tropical savanna climate. The population of each city will be used as DATA to graphically show the development of each city, under the speculation that the more population, the best and more adapted solution of buildings for climate. The chosen cities and regions, that share this same climate, are:
| City/Region – COUNTRY |
Population |
| Culiacan MEXICO. |
733,37 |
| Mazatlan MEXICO. |
438,434 |
| Tepic MEXICO. |
380,249 |
| Colima MEXICO |
950,555 |
| Chilpancingo MEXICO |
187,251 |
| Tuxtla Gutierrez MEXICO |
553,374 |
| Merida MEXICO |
777,615 |
| Cancun MEXICO |
628,306 |
| San Salvador EL SALVADOR |
1,860,000 |
| San Pedro Sula HONDURAS |
1,200,000 |
| Tegucigalpa HONDURAS |
1,126,534 |
| Leon NICARAGUA |
389,6 |
| Managua NICARAGUA |
2,132,421 |
| Liberia COSTA RICA |
53,381 |
| San Jose COSTA RICA |
2,600,000 |
| David PANAMA |
144,858 |
| CiudaddePanama PANAMA |
1,206,792 |
| Pinogana PANAMA |
13,85 |
| Cartagena COLOMBIA |
1,239,430 |
| Caracas VENEZUELA |
8,460,591 |
| CiudadBolivar VENEZUELA |
342,28 |
| Rondonia BRASIL |
1,562,409 |
| MatoGrosso BRASIL |
3,115,336 |
| Tocantins BRASIL |
1,157,690 |
| Maranhao BRASIL |
6,714,314 |
| Brasilia BRASIL |
2,562,963 |
| Fortaleza BRASIL |
2,515,116 |
| Recife BRASIL |
3,871,000 |
| Santa Cruzdela Sierra BRASIL |
2,102,998 |
Data Visualization 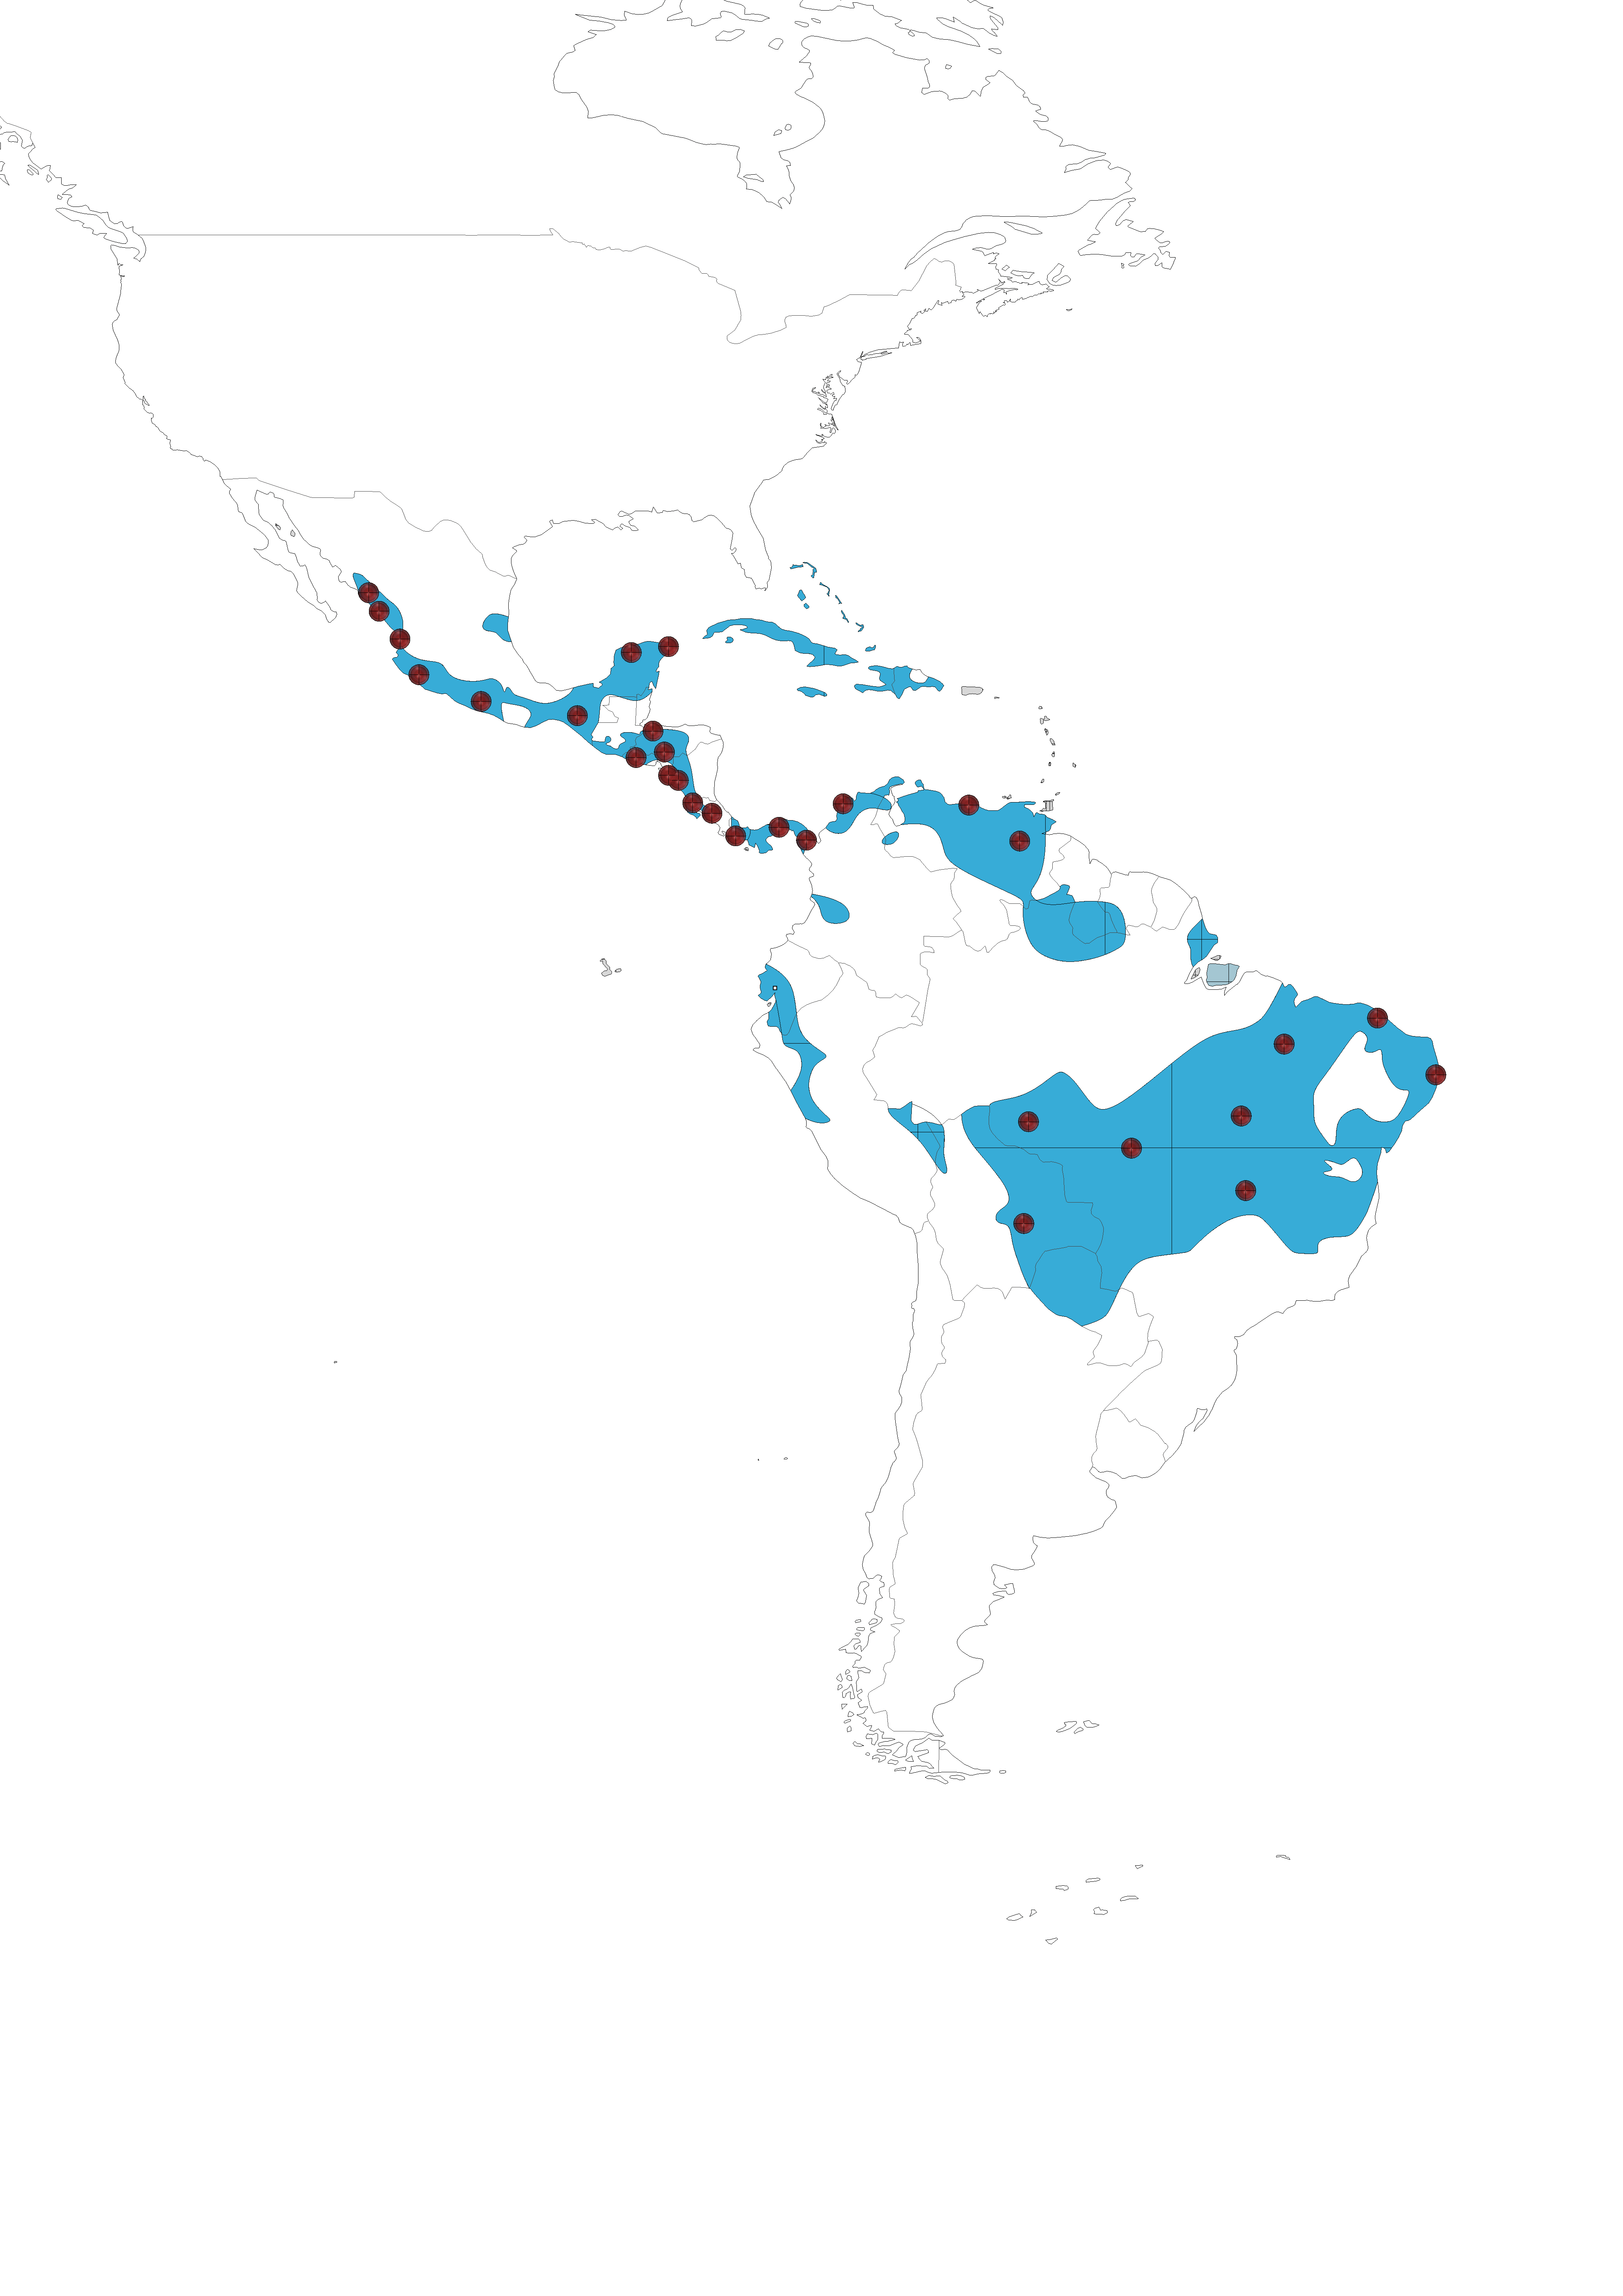 Image generated using Rhinoceros and Grass Hopper, crossing the data as described above.