City Data Visualization
Seminar Faculty: Fran Castillo
The course aims to define an emerging domain of research at the intersection of urban studies and computation, drawing on new urban design approaches that seeks to exploit the growing abundance of computation and data.
The course will explore the description of algorithms (social physics )that will help us to amplify our knowledge about how cities behave and it will also prototype new city data-based applications which allow us to envision new unseen city behaviours.
The course will set up a theoretical and technical framework for modeling big data cities.
Course syllabus.
01 Theoretical approach to big data & cities. Data to understand how cities behave.
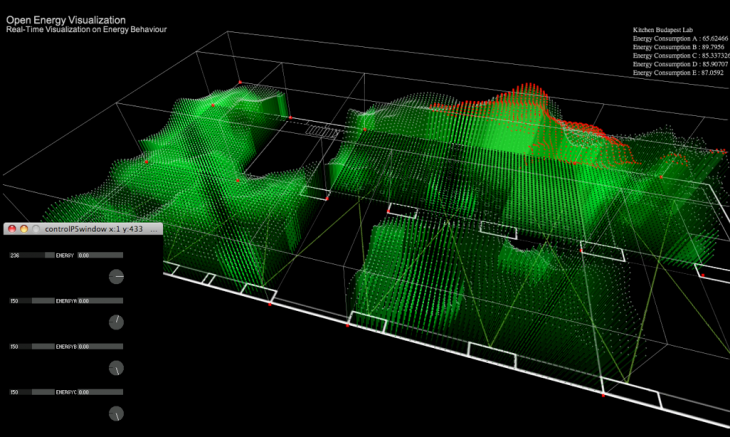
02 Tools for modeling urban data Visualizing data with Processing.
Simulating Human Behaviour. Exploring agent-based model algorithms.
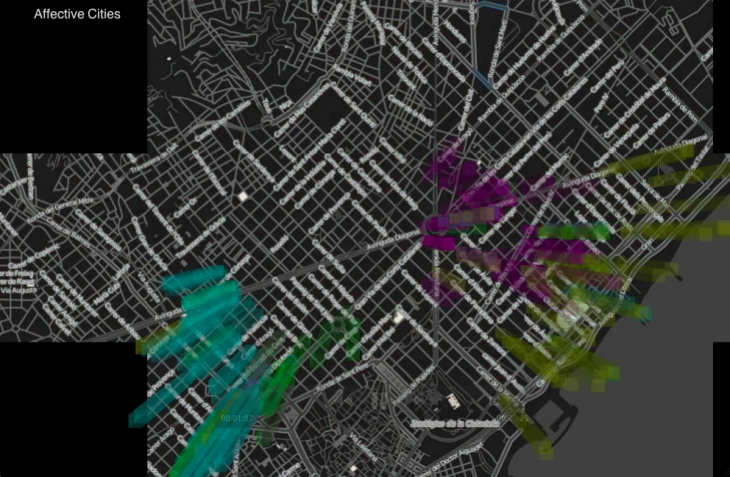
Modelling City Flows. Exploring brownian and networks algorithms. Modelling parameters. Designing reactive app visualizations. Visualizing geo data in maps. Developing an interactive map application by encoding visually quantitative parameters.
03 Tools for modeling urban data Analysing geospatial data by using R studio.
Loading Data and Basic Formatting in R. Working with Map Projections. Mapping With Shapefiles. How to map geographic paths. Choropleth Maps and Shapefiles. Dot Density Maps.
04 Tools for modeling urban data Visualizing data with CartoDB.
Exploring geo datasets. Merging datasets, Designen Layout, Interaction actions, tooltips. How to Make an Interactive Choropleth Map. Making an Interactive Map with Category Filters. Advanced JS integration. Visualizing animated temporal data. Torque Technique.