Introduction
CartoDx is a web-platform for geospatial urban health data representation and exploration. It uncovers conditions favorable for disease sustenance and propagation in cities and describes geographical vulnerabilities, consequently highlighting health inequalities based on level of infrastructural development. For this purpose, it processes visual and descriptive urban data into quantitative variables that are indicators of urban health and synthesizes them into a quantifiable metric.
This project extends the viewpoint that urban health and urban infrastructural development are inter-dependent and visually exposing this relationship can have positive influences for health policy making and active citizen participation in the effort to combat disease endemicity in tropical regions of the world.

Machine learning presents an opportunity to bridge the data gap in places without structured data collection systems.
Preface
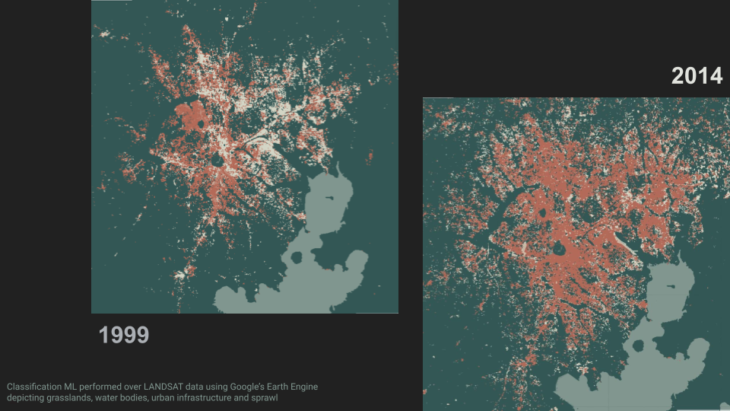
55% of the world population currently live in urban areas, rising to 68% by 2050. While urban centers are hubs for opportunity, they also come with challenges such as health disparities. Urbanization brings important implications on morphologies, public health and safety, more so in the global south
Thesis Intent
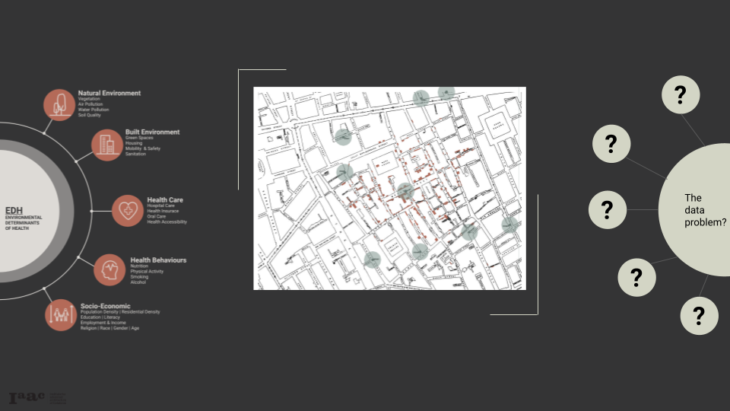
Cities have spatial attributes, environmental factors (EDH) that are associative to disease risk. Using easily accessible spatial data, this project aims to show the relationship between risk of infectious diseases associated with urbanization and urban morphology, while emphasizing the need for health as a factor in urban planning to ensure urbanization reduces the burden of infectious diseases in the future. A lack of open government data and up-to-date free GIS information is the most significant challenge to EDH assessment in low-income economies.
CartoDx presents a pipeline for urban data extraction from images using machine learning and questions the efficiency of this methodology to generate reliable data and metrics for urban morphology assessment.
Furthermore, it establishes a methodology for estimating urban health vulnerability index from the extracted data and attempts to determine the reliability of the index in estimating potential disease spread and health disparities within the city.
Site Selection
The selection process was predicated on three factors:
1. Located in one of the top five countries with the highest global malaria burden
2. Availability of geospatial information on open platforms such as OpenStreetMap as well as aerial and street view images from the web
3. Land area of the site preferably below 200sqkm to allow computations within the limit of available hardware capacity of the authors.
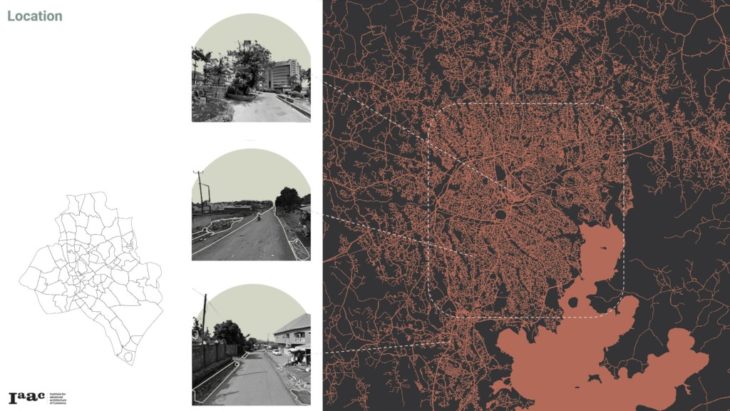
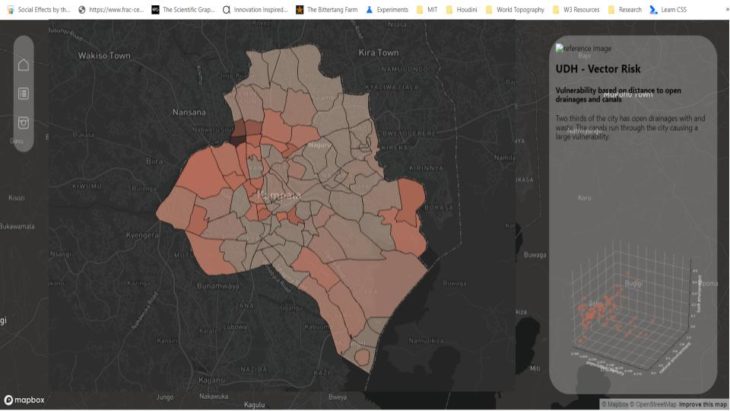
The chosen study site, Kampala, is the capital city of Uganda in East Africa. The coastal city has an estimated population of 1.5million inhabitants on 189sqkm of land, experiences high rainfall in the summer months and hot and dry harmattan in the winter months. There are two sub administrative levels – five sub-county levels and 99 parishes.
Given its similarity to other cities in sub-Saharan Africa, Kampala seemed an ideal testing ground for research.
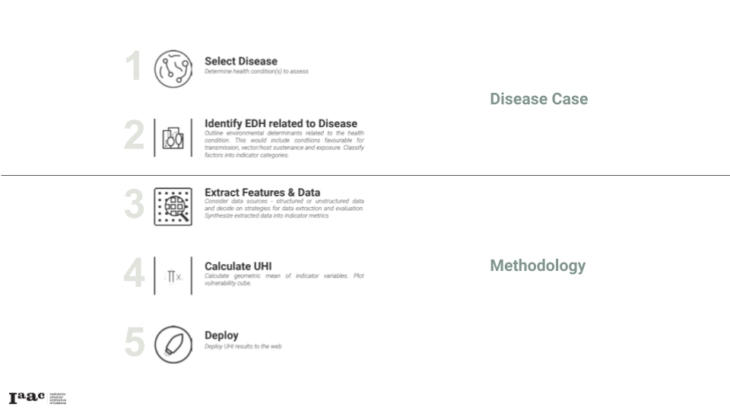
Malaria as a Disease Case
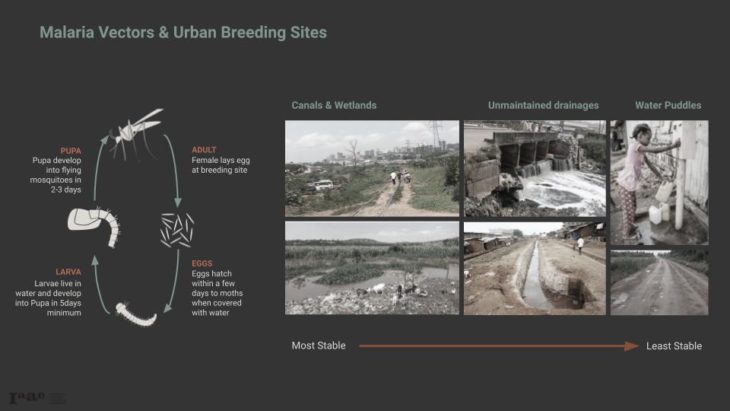
The female anopheles breeds in specific regions, provoked by certain urban conditions
Two major factors considered were the nature of the city’s vegetation and drainage system. Kampala, like most urban African cities in the tropical rainforest climatic zone has vast wetlands that hold stagnant water good for breeding mosquitoes.
Proposed Methodology
The methodology adopts an iterative and parallel processing strategy. To construct the vulnerability index, we ran two main pipelines in Python, for processing structured and unstructured data respectively. The processes used Python libraries and modules including Geo Pandas, Osmnx, NumPy and Pandas for structured data; TensorFlow (including object detection API) and Py torch (Detectron2) for extracting information from unstructured data.

Two pipelines coincide with the data source i.e., aerial and street view imagery
Data Collection
- Sub-sampling from the city network to generate a dataset that is representative of the city’s morphology (to reduce burden of computation and hardware resources)
- Categorizing required information according to data types [domains] and information source
- Data download through API services of various data sources
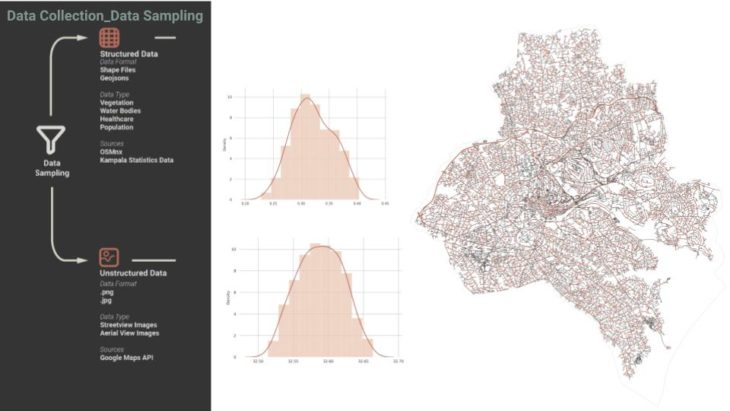 There are two categories of data downloaded for this project.
A. Structured Data
With services like Amazon Web Services and Google Earth Engine, it was possible to perform cloud-based functions that lessened the time and space used. Programming using Open Street Maps API gave access to various building and infrastructural data.
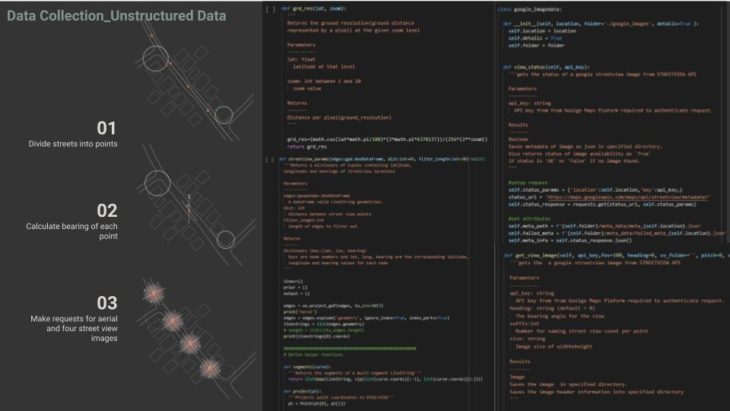
B. Unstructured Data
To bridge the data gap in available structured datasets, Streetview and satellite aerial images are alternative and valid data sources that contain urban information at a large scale. Since the vast amount of image data obtained from cameras and sensors is unstructured, advanced techniques such as machine learning algorithms help analyze the images efficiently using AI-based deep learning models with results that for specific tasks already surpass human-level accuracy. 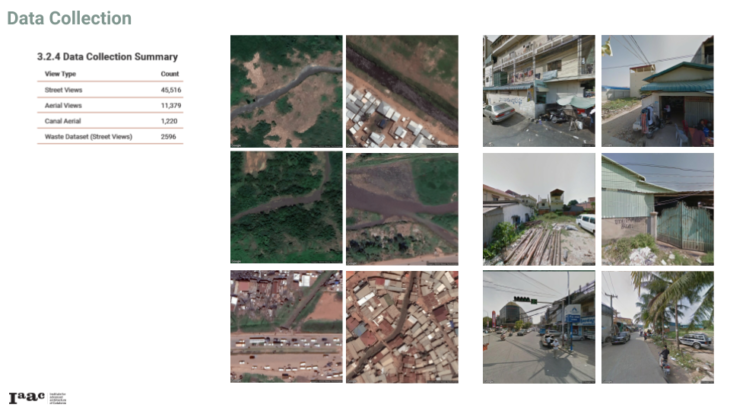
Dataset Creation
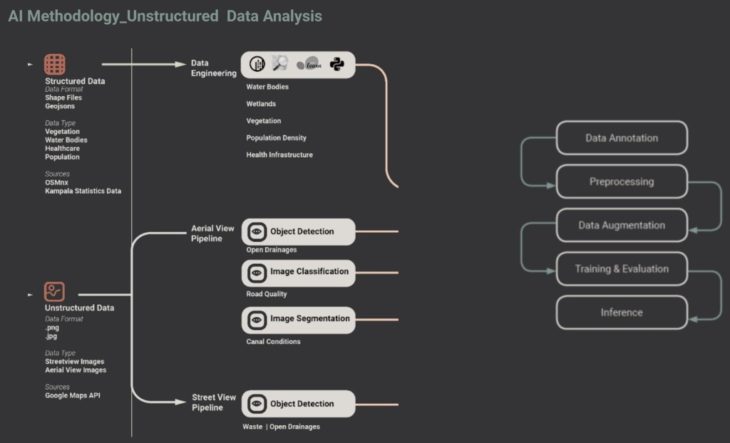
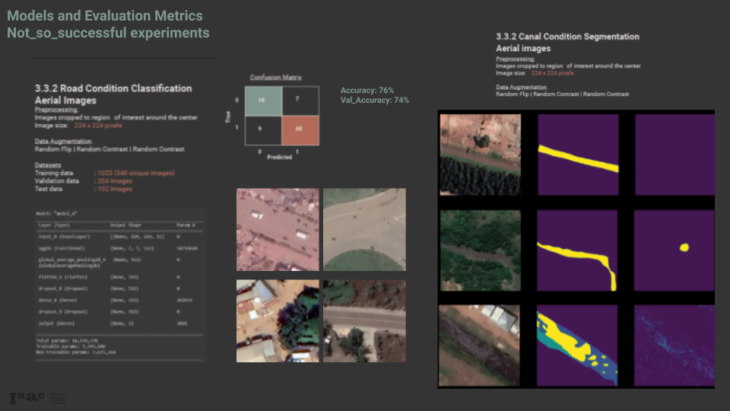
The unstructured data pipeline employed computer vision models to extract information on urban infrastructure and sanitation. Here we created two sub-pipelines: aerial and street view pipelines to extract data on presence of open drainages, road quality, level of waste and canal conditions.
The results of the computer vision tasks are processed as either detection counts per location or as ratios of detection area to overall image area, depending on the CV method employed. For image classification tasks, binary values (0 or 1) were assigned to different label classes predicted. As a further step, counts or area ratios are aggregated to give a final score per street. County and parish level data are calculated through data interpolation techniques.
Annotation, Preprocessing and Augmentation
Roboflow interface eased the labelling of a custom object dataset, more specific to the context, and for the pre-trained models to transfer their learning.
A challenge faced during the step was labelling instances of clean canals against those with floating trash in aerial images due to pixel resolution limitations. The colors and objects hence lacked a clearly defined boundary, blending edges. In such cases, drone imagery would be a preferred data source. Moreover, data of the same canals in street view imagery was found to be missing. Similarly, ground damage capable of water accumulation on the streets was visually homogenous to the road texture and usually blended with the backdrop.
A preprocessing step was included to crop images to regions of interest for training. Dataset splitting, image preprocessing and augmentation was performed. The preprocessed and augmented images were exported and stored for reference and also integrated into the training script through the platform’s download API.

Machine Learning
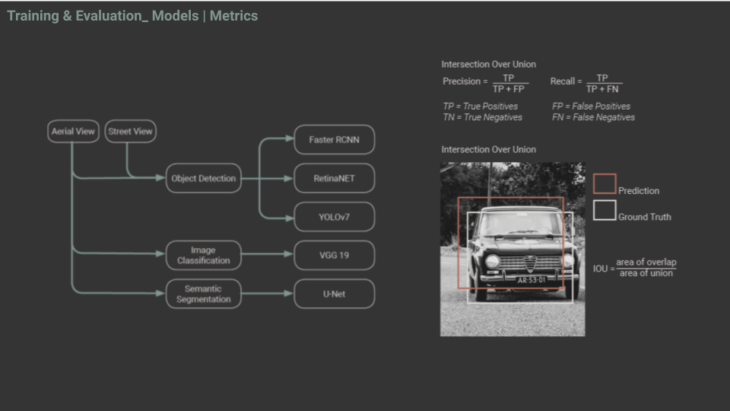
Object Detection
The function of object detection was used to identify open drainages and accumulated waste. The models tested were under the hood of Facebook’s Detectron2, specifically the Faster R-CNN, RetinaNet and YOLOv7.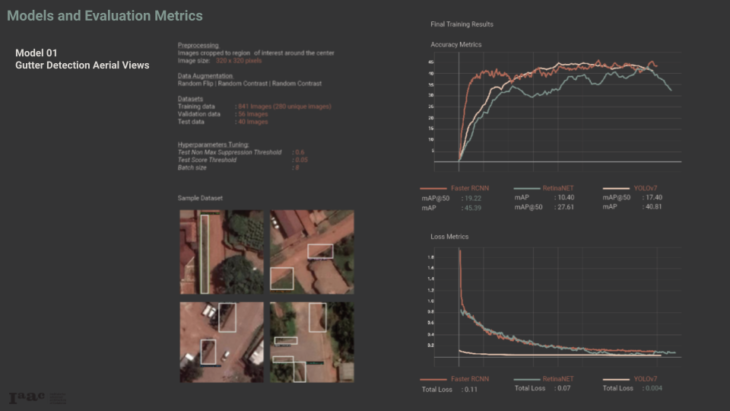
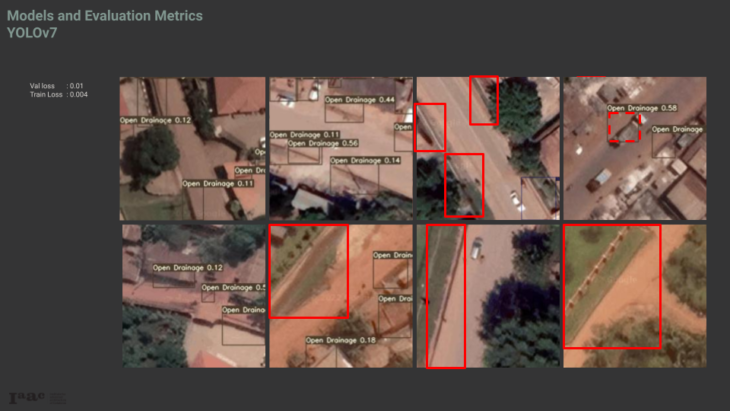
YOLOv7 model had a high mAP score; however, the validation loss was greater than training loss, indicating the model overfitted. Running inference on test dataset, the model could not generalize well, as such, predictions were inaccurate, despite the high mAP value. To combat this, YOLOv7 will require a larger training dataset of ~>2000 images for training.
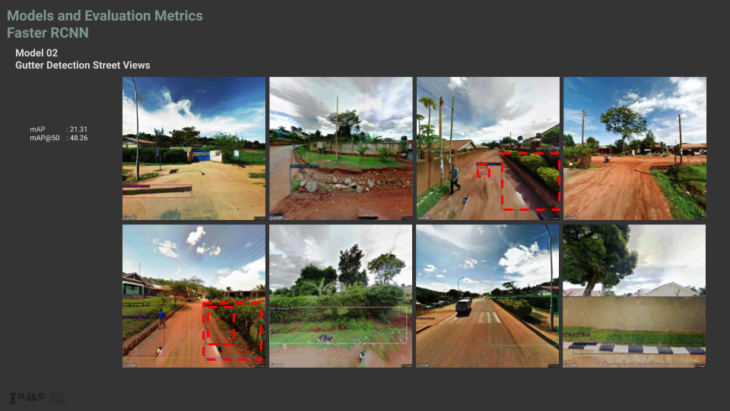
The Faster R-CNN also performed best on street view images, enabling training a street view pipeline for participatory data update during deployment. There were no missed predictions, it was an overconfident model. The laterally stretched angle gave better bounding box results as opposed to images where the drain is stretched into horizon, enabling multiple bounding boxes.
Vulnerability Mapping
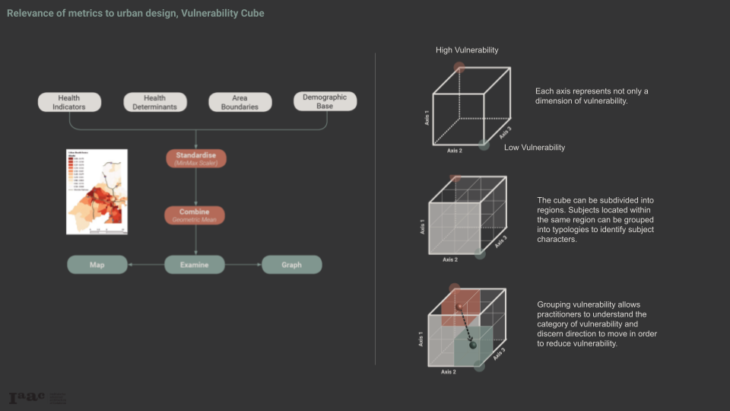
Adaptation of the UVHI, a method developed by World Health Organization Centre for Health Development (WHO, Kobe Centre) and sets guidelines for measuring vulnerability that can be incorporated into urban planning processes.
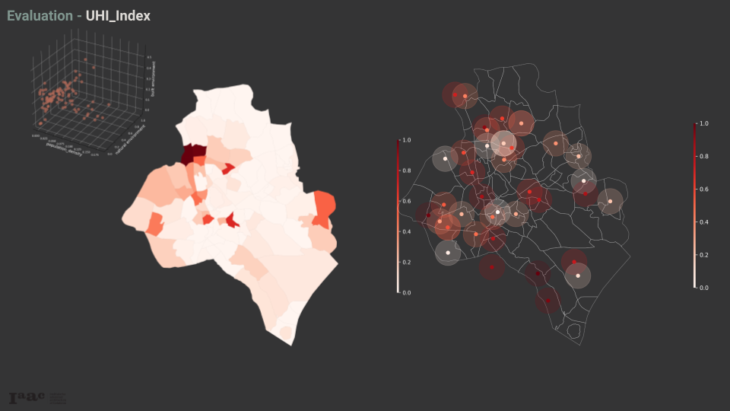
UHI is a flexible assessment system that standardizes, normalizes and amalgamates health determinants indicators or outcomes by regional area and characterizes the geographical and statistical distribution. The standardization of indicators results in UHI indices comparable across different urban health conditions. Secondly, we represent health indicators multidimensionally in a vulnerability cube to classify regions of high and low vulnerability.
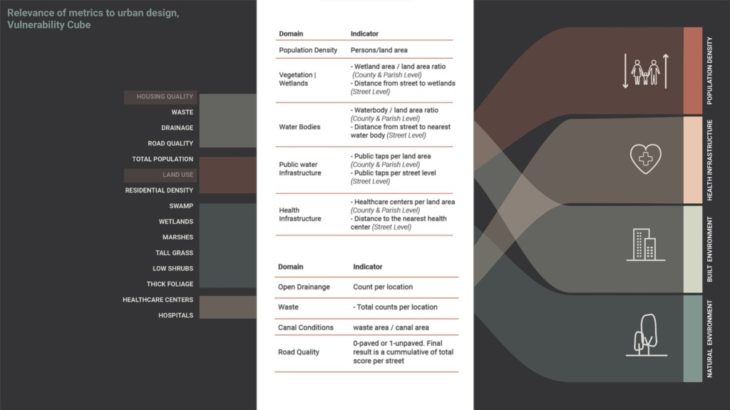
Limited factors into indicators of the environmental determinants (spatial attributes) for our disease case. Here it is critical to note that we removed housing and land use from our domain list due to data limitations.
Evaluation
Through the data interpolation, we extracted data from the street scale to the parish scale. Some of the observations made were as follows:
1. Analyzed the four factors determining the built environment. Here we see small open drainages are uniformly distributed around the city
2. Compared findings on the canals to the canal locations and our data is clipped to ensure the canal’s effect is within 300 feet of each canal
3. Plotted waste data and find that a significant portion of the city has large counts of litter 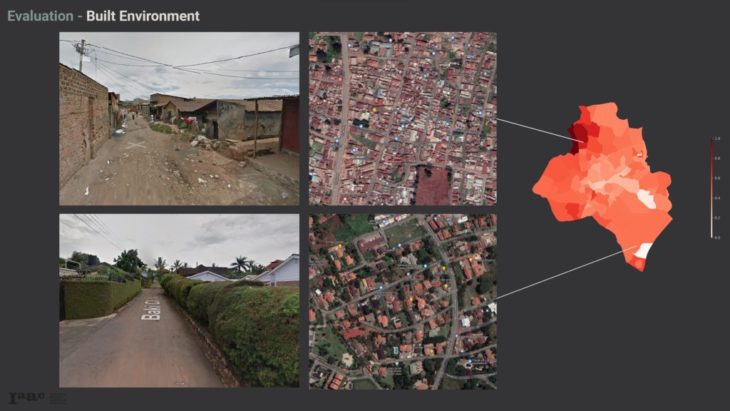
Deployment
CartoDx also extends into the world of data and the potential of AI in deriving from unstructured categorical data, for instance, using Computer Vision. These metrics can be leveraged using ML scaling methods in bringing about impactful physical change in the urban environment.
Prototyping the project for varied disease cases and global application
Our Vision for the CartoDx web interface. Coming soon…
Publishing the extracted data and allowing open access of the Machine Learning model over a web-based platform alleviates the challenge where city-dwellers upload street imagery in real-time, updating and enhancing the model weights, filling in data ‘gaps’, owning it and contributing to the city.
Credits
CartoDx is a project of IAAC, Institute for Advanced Architecture of Catalonia developed in the Master of Advanced Computation in Architecture and Design 2021/22 by Students: Maryam Deshmukh, Oluwadamilola Akinniyi; Thesis Advisor: Angelos Chronis