STEP 1: Speculation
My Research is related to the implement of electric movility in the city of Barcelona. One of the first aspects of the city I noticed when I first arrived to Barcelona to start my master’s at IACC, is the large amount of electic vehicles, specially taxicabs, as well as electric recharge stations.
While investigating on the subject, I got to know that Barcelona’s City Council is a huge supporter of sustainable transport, and that there is a Plan to turn Electric Vehicles into Barcelona’s standard mode of public and private transport. Not only is more energy efficient but also produces less pollution.
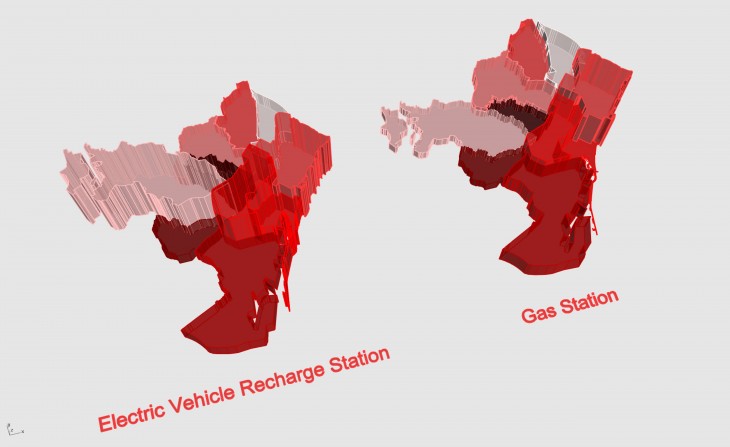
Knowing that Barcelona is one of the most developed european cities on this subject, I decided to base my investigation on this matter. The intention is to show how advanced is the city on this process of switching from gasoil to electric mobility. First by showing the quantity and distribution of the Electric Recharge Stations. And second, comparing with the quantity and distribution of the Gas Stations throughout the city. In both cases divided by Districts. As a conclusion, I would like to understand how advanced is the city in achieving the plan to turn Electric Vehicles into Barcelona’s standard mode of movility.
STEP 2: Data Mining
Source:
http://opendata.bcn.cat/opendata/en
I did research on internet until I found the exact data files I needed on
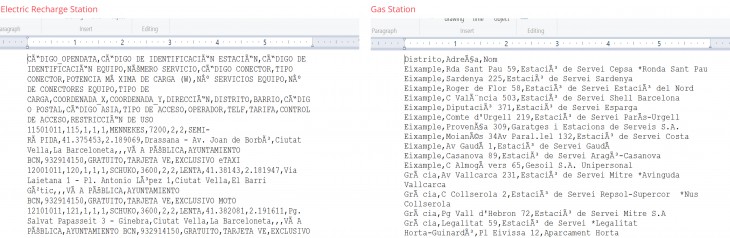
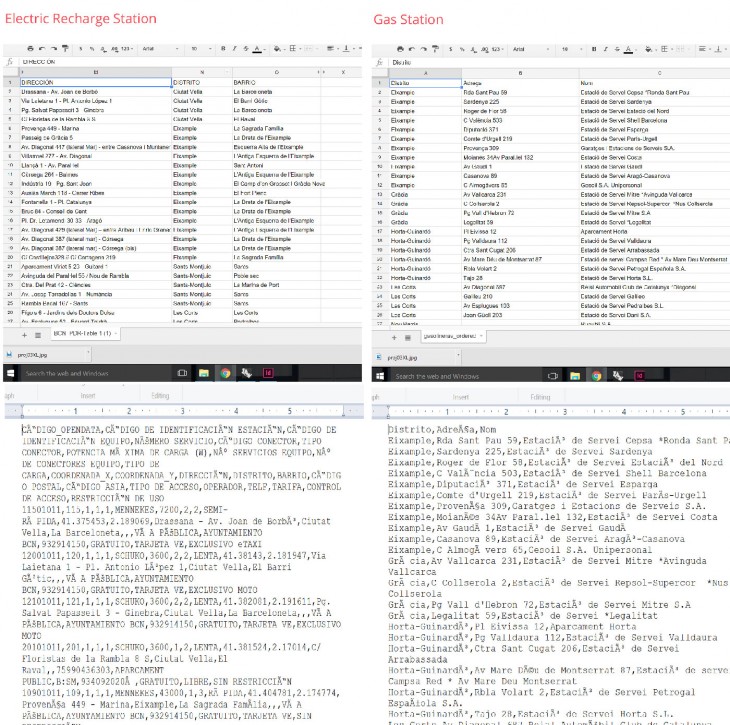
OpenDataBCN web site. I downloaded two files, the first one with the complete information of each Electric Recharge Station on the city of Barcelona, and the second file regarding the Gas Stations.
STEP 3: Correcting Data
The Data Files I downloaded from OpenDataBCN were very useful for a starting point to my research. However I had to curate both files a lot before I could start using them on my script. I imported my .csv files onto sheets.google.com to do the modifications, and then save them again as a .csv file to link to my grasshopper script.
I made sure I was comparing the same data for both cases. For example, in the Electric Recharge stations, the address was repeated per each plug in the station, whereas the Gas Station File had one address per entire station, not per each pump. So I curated the files to make sure the data was correct, and also completed what was missing.
 STEP 4: Barcelona Map
The Next step was to download from internet a Map of Barcelona’s districts. I downloaded one illustrator format file which I then imported to Rhino. This file contained the exact curves for each district in Barcelona.
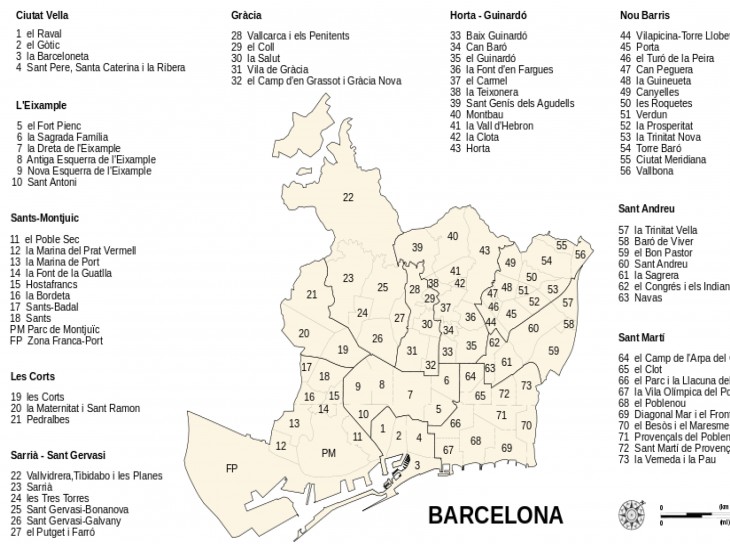
STEP 5: Barcelona Map
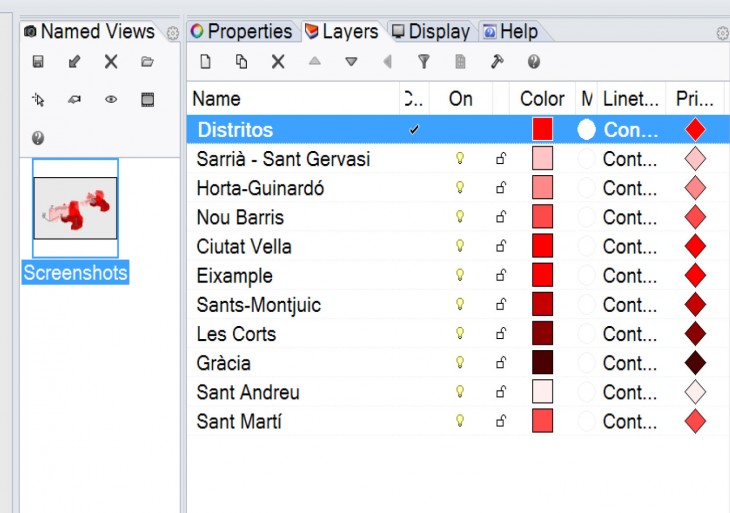
I created one layer per each District, each one with different color. Also, I made sure all of the district’s names were written exactly as they were written on the data files.
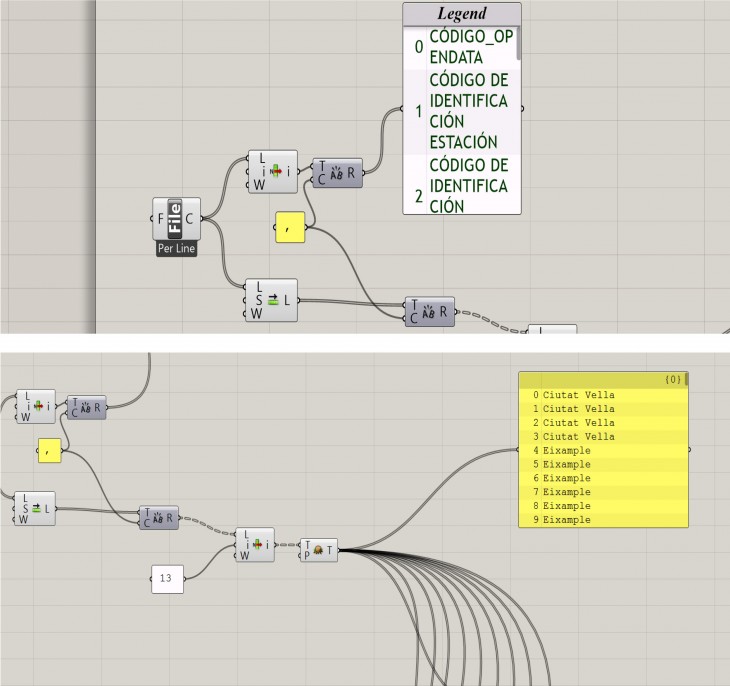
STEP 6: Data Visualization
Having the Barcelona Map set on rhino with the correct layers, I started to work with Grasshopper to visualize the data collected.
The first step was to Incorporate the Data Files on Grasshopper, Which I did through the command Read File.
The Second Step was to filter and order the Data to be able to use the information needed. For this step I used the commands: List Item, Text Split, Shift List and Panel.
The Third Step consisted in filtering the Information, to have only the sections I needed from the sheet. For this I used the commands: List Item and Flatten Tree.
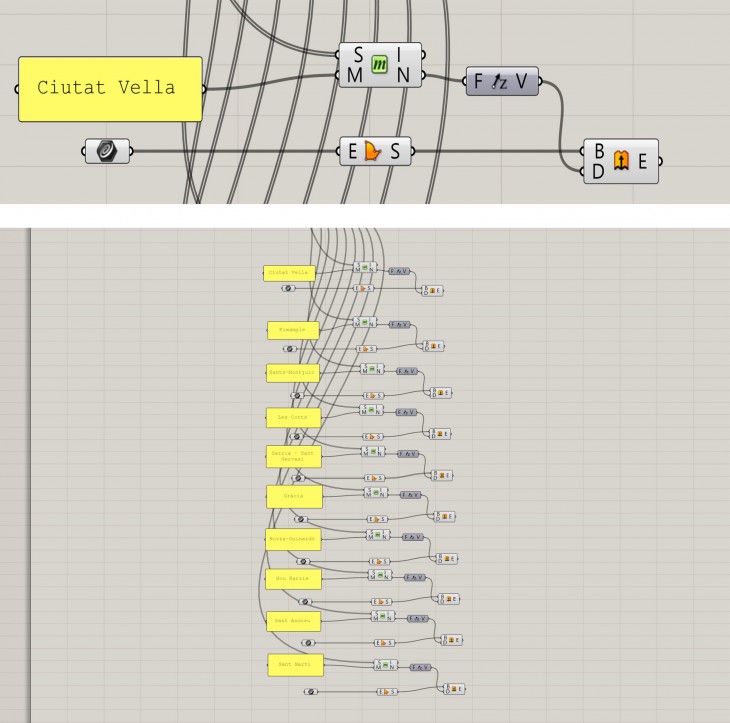
STEP 7: Data Visualization
This Step was completed by the use of the Commands: Member Index, Unit Z, Extrude, Boundary Surfaces, Curve and Panel.
I extracted from the data, how many times was “Ciutat Vella” District repeated, and extruded the curve in base to that quantity and its location.
I repeated the process for each District.
After having the script complete for “Electric Recharge Stations’, I repeated the same exact process for “Gas Stations”, starting again from the beginning where I used the command Read File. In this case Using my other .cvs file.
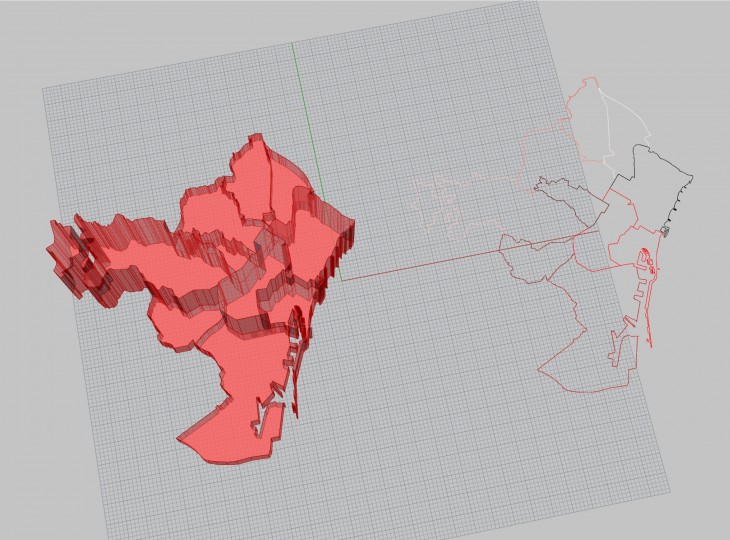
STEP 8: Data Visualization
This image was taken during the process of setting the curves for the extrusion for each district.
The very last step was to Bake the extrusions in grasshopper. Each one in their own respective layer according to the district.
CONCLUSION
Overall, I would say, that the intention to turn Electric Vehicles into Barcelona’s standard mode of public and private transport is visible.
While comparing per district, you can appreciate that the amount of Electric Recharge Stations in relation to Gas Stations, is equal or superior. In many cases such as Sarria and Eixample it is highly superior.