Cadastral Data.
Introduction
Cadastre data is an example of data that concerns 4 dimensional space in which reality can be represented. The oldest data that has been recorded for a century serves as a historical record. This data comprehensive land recording of real estate. Most of the time, people use this data to prove the ownership of the land. It becomes more useful for unforseen cases such as war.
The starting of Cadastre is recording Data of the properties that the people own. but later it was also used for other kinds of assets such as Cadastral Parcel that Combinations of Buildings and Bridges to prove the ownership. Cadastres are used by many nations around the world, some in conjunction with other records, such as a title register. In most countries, legal systems have developed around the original administrative systems and use the cadastre to define the dimensions and location of land parcels described in legal documentation.
Land Registration (Identification), each government has different approaches and rules depending on the principle of specialty as a result of visibility of access to the cadastral data in each country. There are many forms of tenure existing such as the Anglo-American concept in theory feudal, allodial systems that are used in the Roman-French-German, the state form, the religion as the Islamic concept and the customary concept. The cadastral map is a map that shows the boundaries and ownership of land parcels. It was recorded in 1792 BC showing the Babylonian territory. Some cadastral maps show additional details, such as survey district names, unique identifying numbers for parcels, certificate of title numbers, positions of existing structures, section or lot numbers and their respective areas, adjoining and adjacent street names, selected boundary dimensions and references to prior maps.
The vintage analysis of Cadastral data impacts urban design as a principle tool especially housing development and the evolution of cadastral data can reflect economic conditions by becoming a resource for setting taxes for land properties. From a parcel to the large scale of land, the role of cadastral data will be more important. Not only in terms of urban design that seeks to combine the most desirable aesthetic, human qualities and community aspirations but also the economic concern in terms of market price and opportunity of the area. Land Prices reflect changes in society, different elements can affect the rice of the land. AirBnb can give us a vision of hence and the effects of focusing a city on tourists. Part of the restriction in cadastre is because you can follow economic patterns and know how much people are paying on taxes.
The connection of many kinds of data would be the added value of using cadastral data. Some cities, they create the automation linked between textual data (legal land and registration data) and parcel maps. Most of them have the same goal is to generate digital maps which will facilitate land management and planning and in particular land registration and the issuance of land titles in order to promote security of land tenure and reduce land disputes.
Methods, Data and key concepts
In the age of big data, the digital cadastral database is used in many cities such as Queensland. The system provides the map base for systems dealing with land related information such as population density, people income. The connection of data can link with the cadastral data
Cadastral data is considered to be the point of truth for the graphical representation of property boundaries. It is not the point of truth for the legal property boundary or related attribute information, this will always be the plan of survey or the related titling information and administrative data sets. Some cities, they update data weekly that makes the data dynamic.
Cadastre management has been used by the software industry since at least 2005. It mainly refers to the use of technology for management of cadastre and land information in Geographic Information Systems (GIS), Spatial data in rather that to general management issues of cadastral and other land information agencies
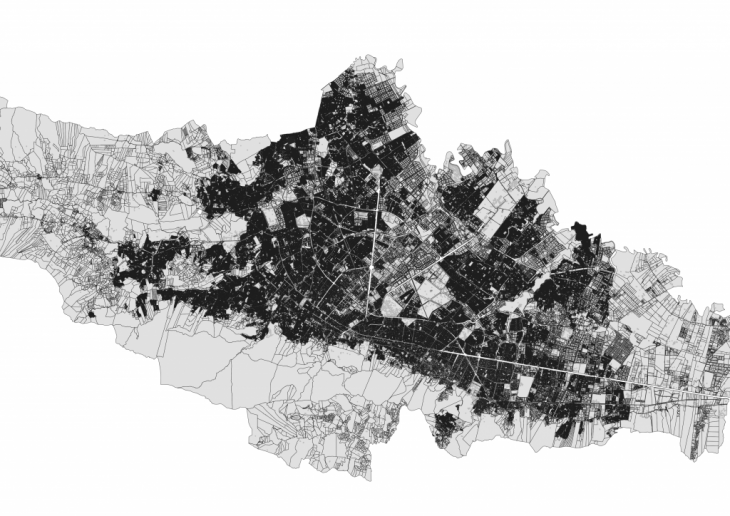
For example, for the “Affordable Housing” project development in the Internet of Buildings MACT studio, the team wanted to show the constructions that were developed year over year for the last ten years. In order to do this, we leveraged the query builder in QGIS to filter on the year of the construction. We created a layer for each year and filtered the query builder for that year of construction. Once we had all of the layers, we were able to export the map for each year, allowing us to show the progression of these constructions in the Sant Marti area.
Principal outcomes
The base map for systems dealing with land related information such as population density, people income and using the cadastral data for creating a timeline of how housing buildings are growing in the last 20 years.
Survey
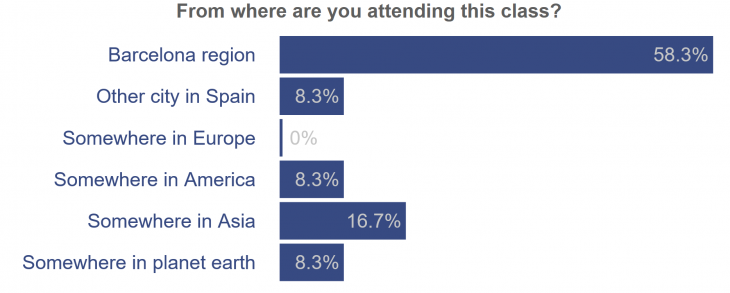
Survey 1. For the first session, some students went back to their home country and 58.3% attended this class in Barcelona.
Most students haven’t had experience using cadastral data for analysis and they considered that the analysis of cadastral data would be useful in their career in urban design and some students see the potential to apply this knowledge to their studio.
 Survey 2. Every student considers that the cadastral data is useful. There are many purposes for the analysis of cadastral data, most students think this kind of data can be used for socioeconomic and geospatial but some students think that can be used in demographic as well.
Conclusions
Cadastral data is the initial tool to represent the connection of information systems with basic spatial and non-spatial information. It is commonly used in urban design.
The principal outcome created for a project of “Affordable Housing”, the cadastral data used for creating a timeline of how housing buildings are growing in the last 20 years. This data has the benefit to provide a proposal and understand the past and current condition of the buildings.
The main problem was trying to clean and understand the cadastral data of Barcelona, especially when we try to represent land value. Cadastral data has its representation of the different indicators (land use, number of floors, year of construction, etc.) Therefore, to understand the symbols we use different sources and plans from the city.
References / Bibliography
- IRM Quito
https://pam.quito.gob.ec/mdmq_web_irm/irm/buscarPredio.jsf
- Land registration of Thailand
http://dolwms.dol.go.th/tvwebp/
- The Digital Cadastral Database
https://www.data.qld.gov.au/dataset/cadastral-data-queensland-series
- GIS based Land Information System using Cadastral model
https://link.springer.com/article/10.1007/s40808-016-0161-3
- Viewing the cadastral map and extracts
https://kb.ros.gov.uk/land-and-property-registration/mapping-requirements/the-cadastral-map
Cadastre. The big data source for vintage analysis is a project of IaaC, Institute for Advanced Architecture of Catalonia
developed at Master in City & Technology in (2019/2020) by:
Students: Byron Cadena & Pawitra Bureerak
Faculty: Diego Pajarito


