BUCKL-AI-NG
ABSTRACT:
This research is focused on two studies: one is the study of failure by elastic buckling and plastic collapse during 3D concrete printing and the other one is the development of a new approach using machine learning to learn and predict if the 3D printed of the CYLINDER structure is stable or not.
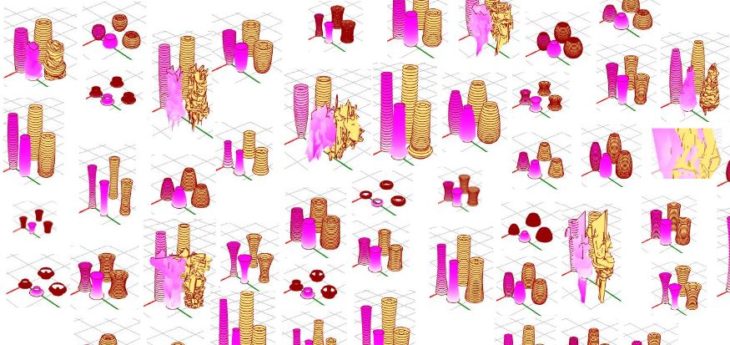
9.279 samples of concrete cylinders were performed and computed by the parametric 3D printing model developed by Karamba (grasshopper plugin for structural analysis) , demonstrating the circumstances under which elastic buckling and plastic collapse occur, the effect of geometrical imperfections on the buckling response, the influence by the curing rate of the concrete material on the buckling stability, and the conditions leading to the successful printing of a complex, practical structure. Then with the deduced conclusions we explore how Machine Learning can be used as a useful tool for accurately designing wall structures against failure during 3D concrete printing.
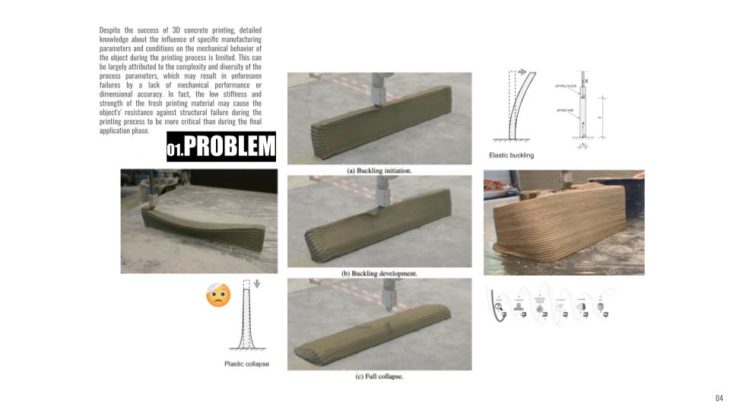
PROBLEM
Despite the success of 3D concrete printing, detailed knowledge about the influence of specific manufacturing parameters and conditions on the mechanical behavior of the object during the printing process is limited. This can be largely attributed to the complexity and diversity of the process parameters, which may result in unforeseen failures by a lack of mechanical performance or dimensional accuracy. In fact, the low stiffness and strength of the fresh printing material may cause the object’s’ resistance against structural failure during the printing process to be more critical than during the final application phase.
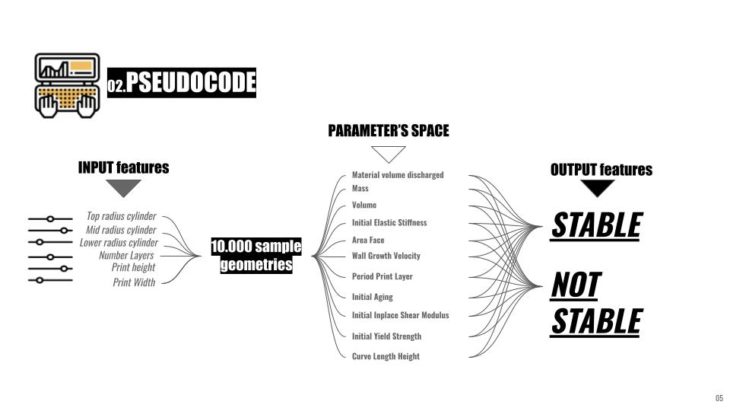
PSEUDOCODE
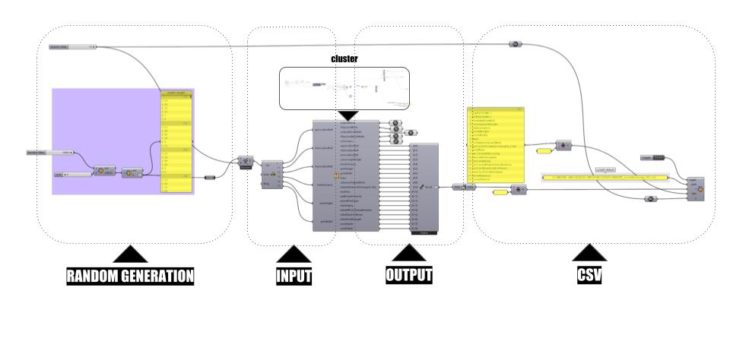
Consists of three parts:
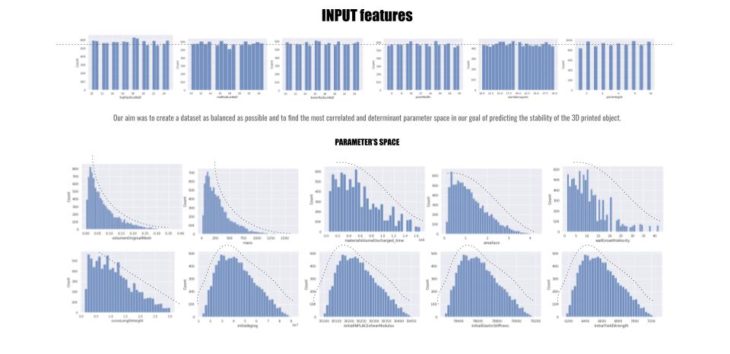
- 6 inputs features that are used to generate our geametry samples and to obtain our paramter space.
- 11 paramters space that are obtained thanks to the first 6
- finally our outputs. We decided just to see if we can predict if our 3D model will be stable or not.
3D PRINTED CYLINDER DESIGN AND GENERATION
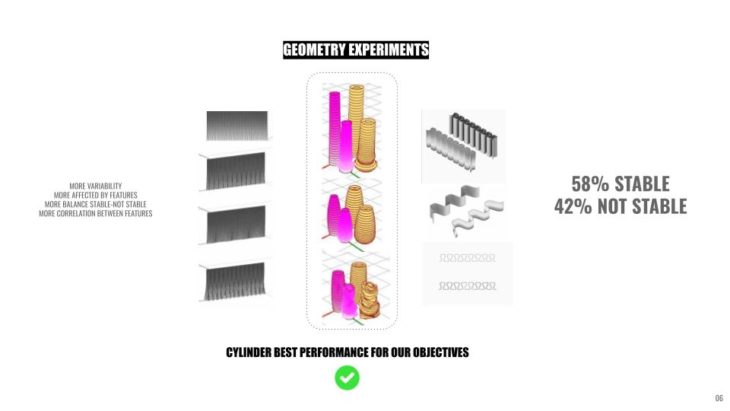
We finally choose the cylinder, instead of the wall or curvy wall:
- More Variability
- Features more affected
- More 50-50 of samples STABEL-NOT STABLE
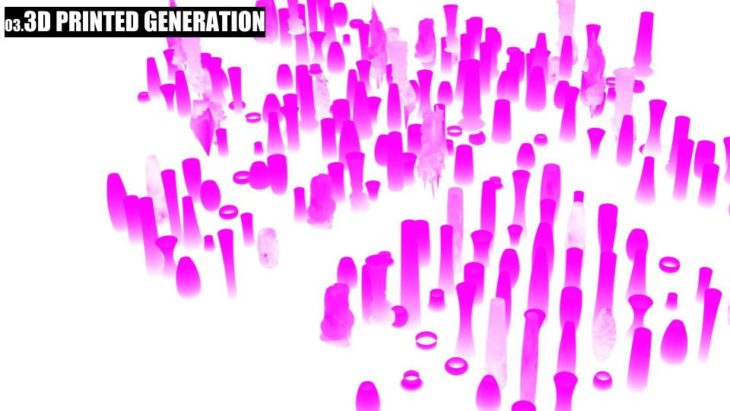
For the generation of our geometry sample was very easy:
- Top, mid and buttum radius sliders for changing the form
- Then we used 3 3D parameters as inputs in our model:
- Print Width
- Print Speed
- Number of layers
However, the way we know how our 3D model buckles or collapse was using KARAMABA, a structural grasshopper script that in our case is used to calculate 3D print concrete collapses.
Randomly we generated almost 10.000 samples in grasshopper and we exported the features obtained as a CSV so that we later input it in our Google Colab.
DATASET ANALYSIS
Generated the CSV we will the import it in our google colab, however before training it, we will clean and balance it before.
In our case and as you will see later, we want to build a CLASSIFICATION model so we will use our 2 last columns to generate a new column called STABILITY with only 2 typesof unique values:
- Stable
- Not stable

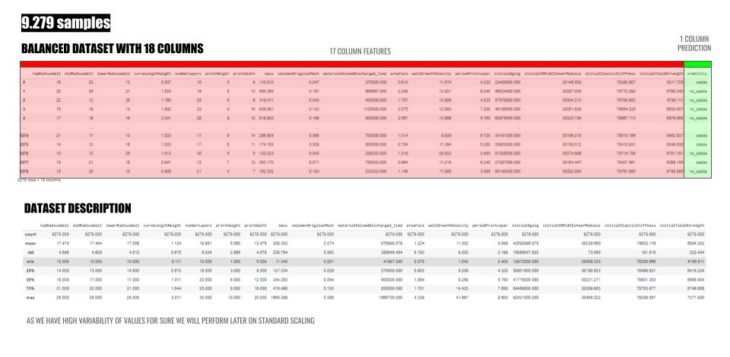
Finally we have 9.279 valid samples and we will begin to plot the data and analyze it. In this case we use histograms to know more about the density of our columns and see if we need to balance them.
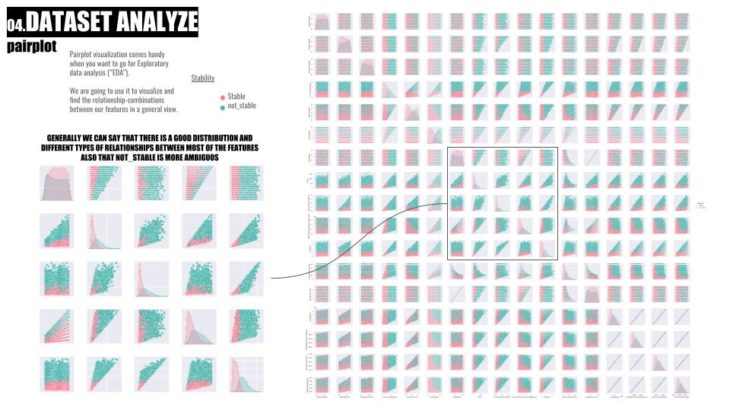
Pairplot visualization comes handy when you want to go for Exploratory data analysis (“EDA”).
We are going to use it to visualize and find the relationship-combinations between our features in a general view.
GENERALLY WE CAN SAY THAT THERE IS A GOOD DISTRIBUTION AND DIFFERENT TYPES OF RELATIONSHIPS BETWEEN MOST OF THE FEATURES ALSO THAT NOT_STABLE IS MORE AMBIGUOS
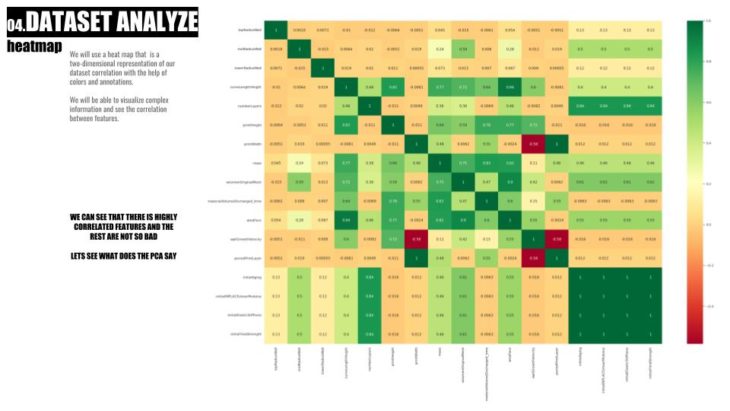
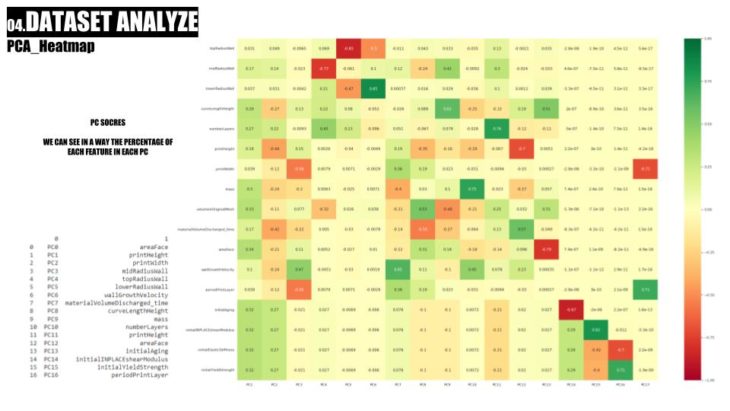
We will use a heat map that is a two-dimensional representation of our dataset correlation with the help of colors and annotations.
We will be able to visualize complex information and see the correlation between features.
WE CAN SEE THAT THERE IS HIGHLY CORRELATED FEATURES AND THE REST ARE NOT SO BAD LETS SEE WHAT DOES THE PCA SAY
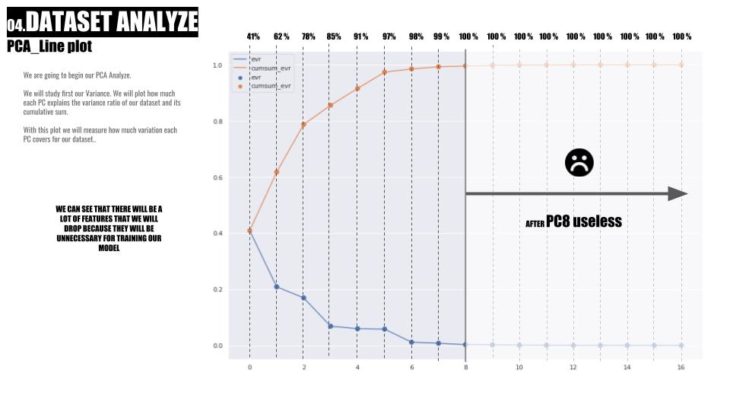
We are going to begin our PCA Analyze. We will study first our Variance. We will plot how much each PC explains the variance ratio of our dataset and its cumulative sum. With this plot we will measure how much variation each PC covers for our dataset.
WE CAN SEE THAT THERE WILL BE A LOT OF FEATURES THAT WE WILL DROP BECAUSE THEY WILL BE UNNECESSARY FOR TRAINING OUR MODEL
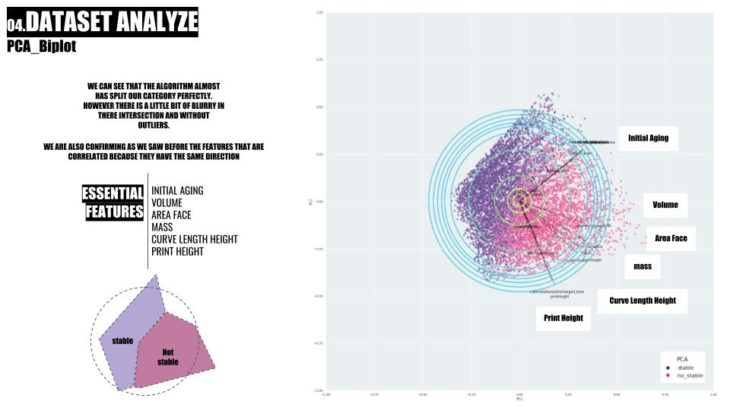
WE CAN SEE THAT THE ALGORITHM ALMOST HAS SPLIT OUR CATEGORY PERFECTLY. HOWEVER THERE IS A LITTLE BIT OF BLURRY IN THERE INTERSECTION AND WITHOUT OUTLIERS. WE ARE ALSO CONFIRMING AS WE SAW BEFORE THE FEATURES THAT ARE CORRELATED BECAUSE THEY HAVE THE SAME DIRECTION.
PC SOCRES. WE CAN SEE IN A WAY THE PERCENTAGE OF EACH FEATURE IN EACH PC
ML TRAINING
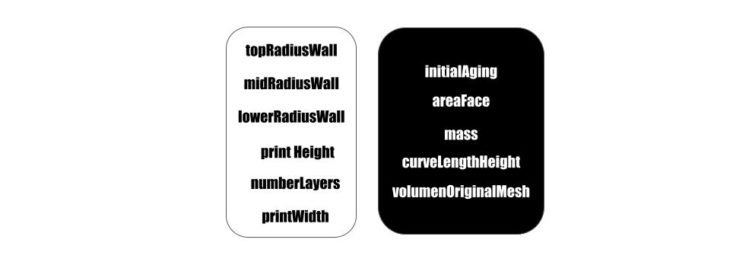
So finally and after using PCA to extract our essentail features, we will use then for our training model the following:
- topRadiusWall
- midRadiusWall
- lowerRadiusWall
- printHeight
- numberLayers
- printWidth
- initialAging
- areaFace
- mass
- curveLengthHeight
- volumenOriginalMesh
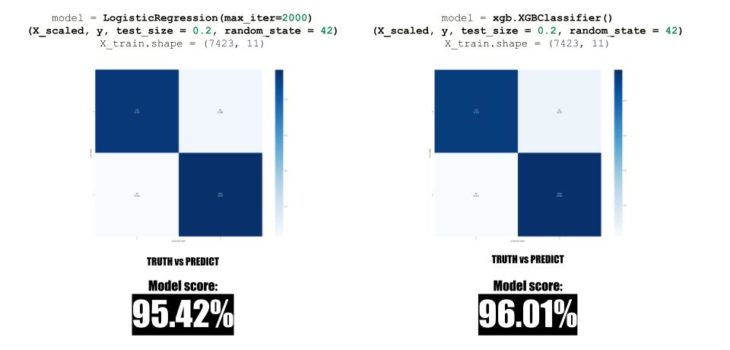
So we want to predict if it is STABLE or NOT_STABLE, so we will use a CLASSIFICATION MODEL. In this case we will experiment with shallow and deep learning and see which are the best models for our prediction.

First we begun experimenting with 2 shallow learning models. We can see that we have already pretty good news! Having this results we can stay here however we will experiment with deep learning.
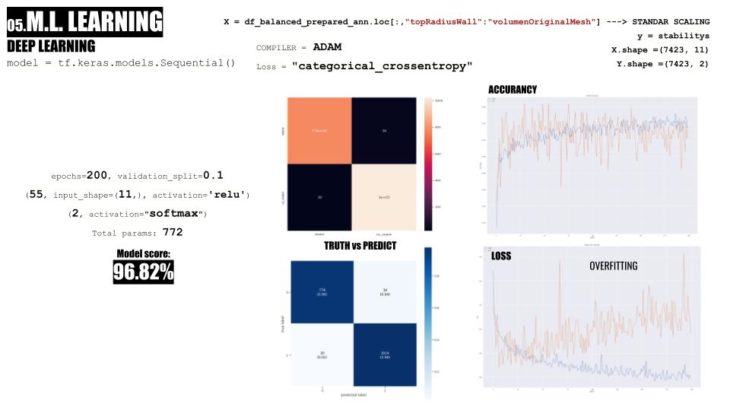
For deep learning we saw for each of the following examples that it was very easy to collapse our model. In the first case there was too many dense layers for our model, it was drowning and overfitiing. However it was slightly better than the shallow learning. Also behad to standar scale our features.
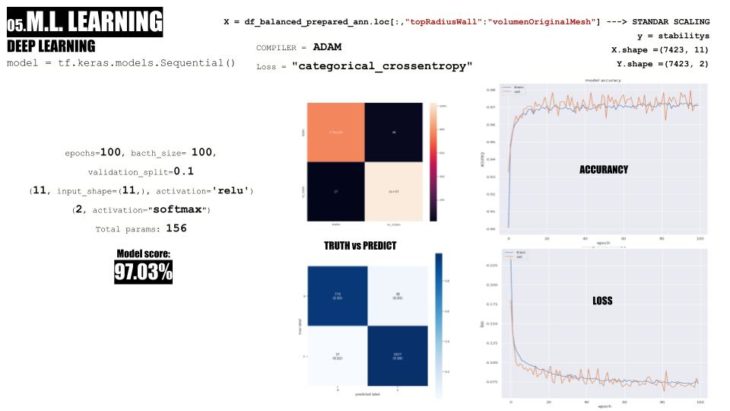
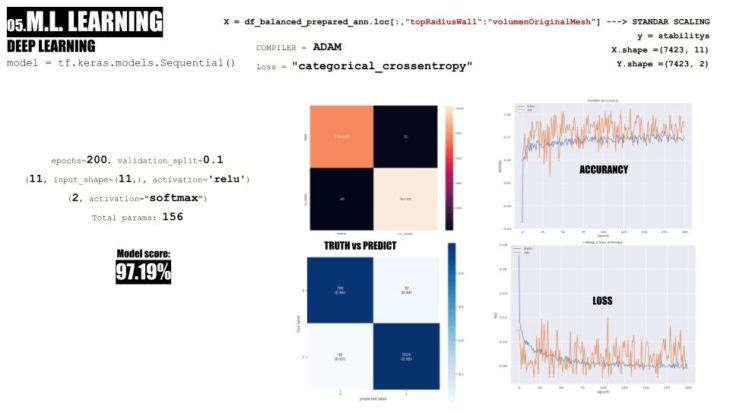
With less epochs and dense layers it got better but still a little bit noise. We tried a third one, but it was for as worst.
HOPS
Finally we wanted to test it in rhino. We used HOPS in google colab for this. We input the 11 essentail features we said before and then our output will be STABLE or NOT STABLE
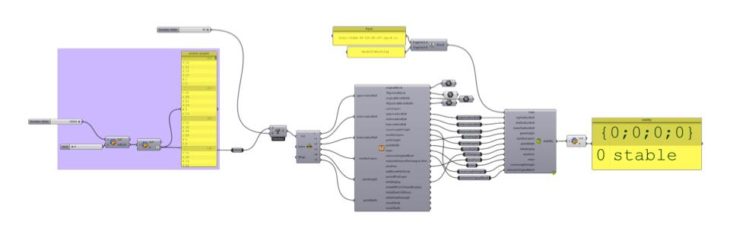
Here is the example of difierent inputs and we can see that it predicts very well when it collapses.
BUCKL-AI-NG is a project of IAAC, Institute for Advanced Architecture of Catalonia developed in the Master of Advanced Computation in Architecture and Design 2021/22 by Students: Faezeh Pakravan Noghabi & Jacinto Moros Faculty: Gabriella Rossi and Hesham Shawqy