It is 2050 and the world is in crisis, raw materials for construction had become rare and earth has become more polluted. Shortage of resources forced the necessity of reusing existing building materials and the wounded environment is in need of a new lunge to breath.
The panacea is to extract information of the precast floor slabs from an old abundant building and reuse in a way that could help the environment recaps.
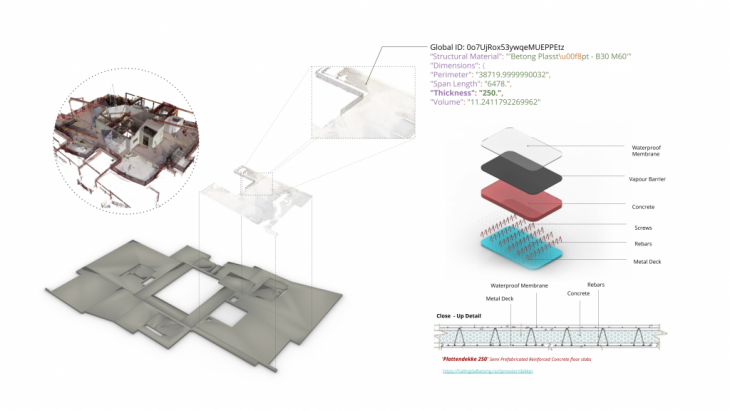
Data Extraction
ID Recognition & locating- Slabs
Process
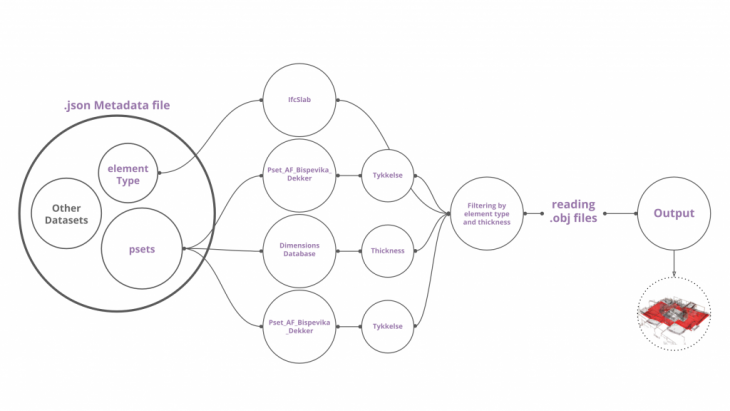
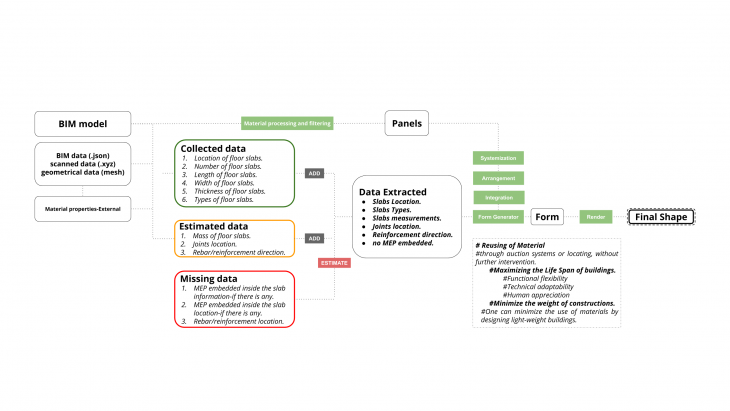
The data was extracted from BIM database file (.json) and sorted out by thickness of slab per floor. We used a python script to read the (.json) file and go through the databases that store the information we need and grasshopper to visualize were the slabs are in the building and filter out the components we do not need. The diagram shows the flow of data and filtering process.
From the databases we were also able to find information related to the type of the slab and search on the web for information related to the composition.
Data Analysis, Consolidation and Reformatting Strategies
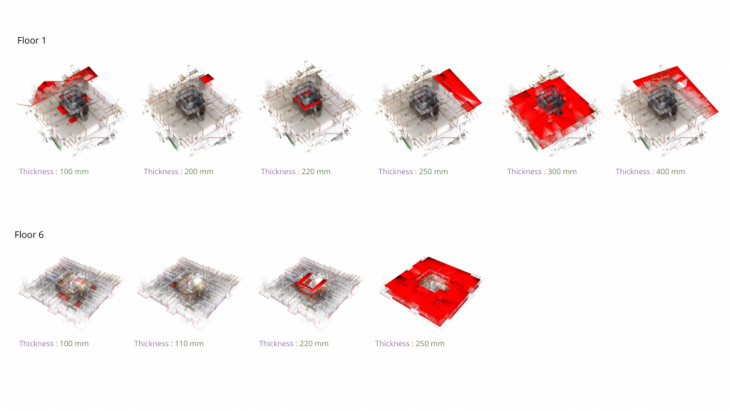
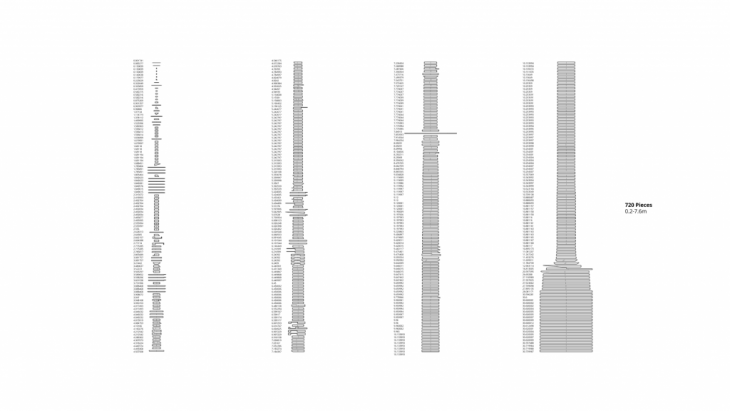
Floor Thickness
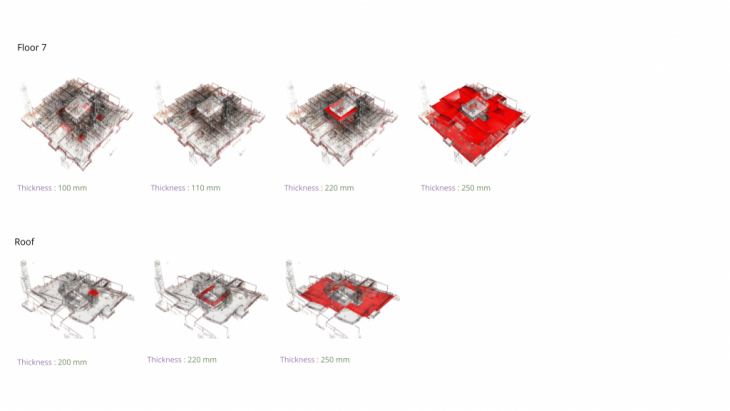
-
Indicated in red are the slabs with their respective thicknesses.
Data Filtering
Slabs – Rough Sorting by Total Area
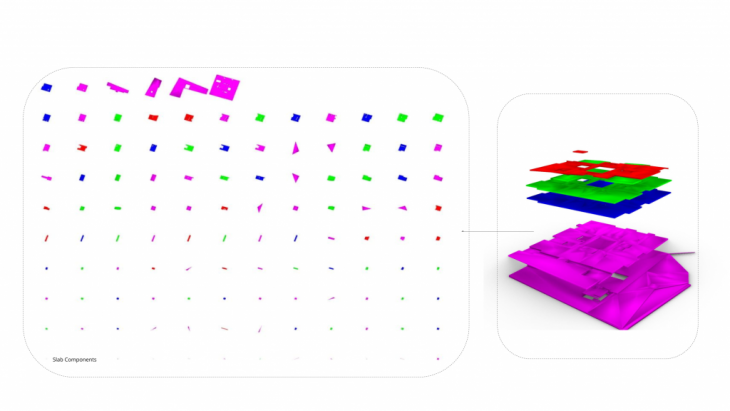
An initial examination of the slab elements we had to work with showed a wide variance in size and shape , and an impression of ‘larger’ elements appearing on the lower floors. However this likely came down to quirks of the BIM drafting process itself, alongside other errors like several triangular slab elements seemingly caused by mesh/polygonization step. For these reasons we moved past the logical BIM representations and chose to further divide these slab elements for our use.
Slabs – Data Arrangement – Identifying components
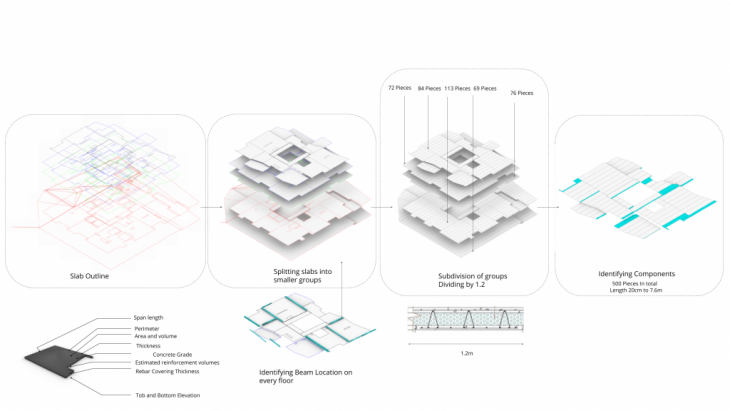
Using the details for the specific precast slab systems used, we determined the likely division between individual precast pieces within the larger slabs, and chose to separate them individually for our new construction elements.
Identifying Components from Point Cloud
We tested our designs using pieces taken an educated inference from the slab’s shapes. We also developed a prototype for obtaining the actual precast edges as usable geometry, when they’re visible in the point cloud.
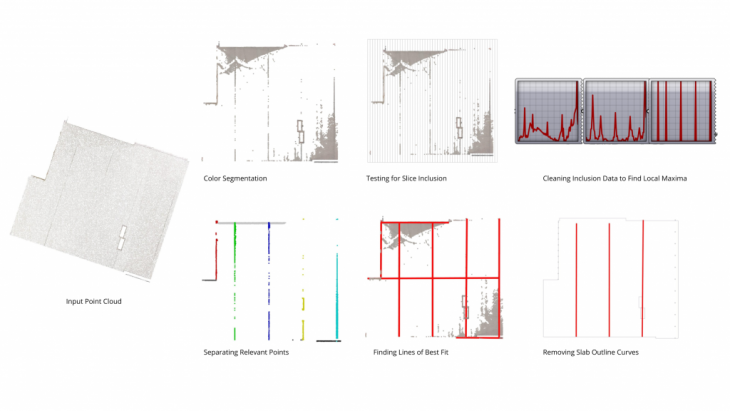 Applying this system to the whole building (and to arbitrary building scans in the future) will require further tuning and adaptation to noise and scan errors. Firstly a basic color segmentation is performed using parameters that return a roughly recognizable collection of the desired points, with still some associated noise. As we know a slab edge will have a large number of points along a single axis, the cloud is divided into a series of slices along the X and Y axes, and the number of included points is counted. These lists of totals are cleaned and processed to find the slices that contain local maxima. Taking only the points within these slices, the lines of best fit for each group represent a single visible edge in the point cloud. Finally, each line is compared the the lines making up the edges of the slab, to filter out only the internal precast division lines.
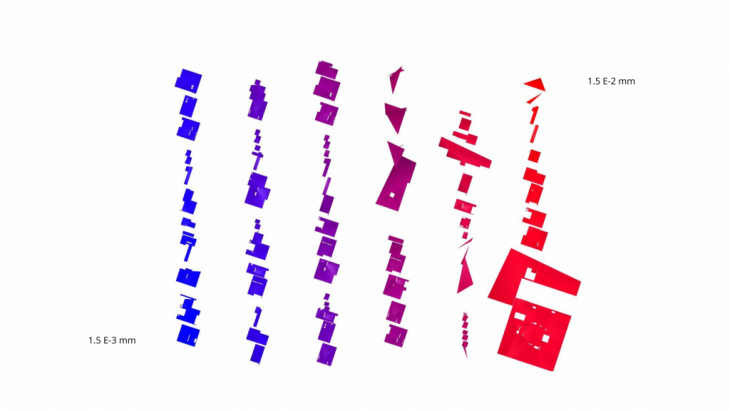
Slabs -Data Arrangement -BIM model data estimated- sort by Area
 Slabs – Detail Analysis via Point Cloud Scan
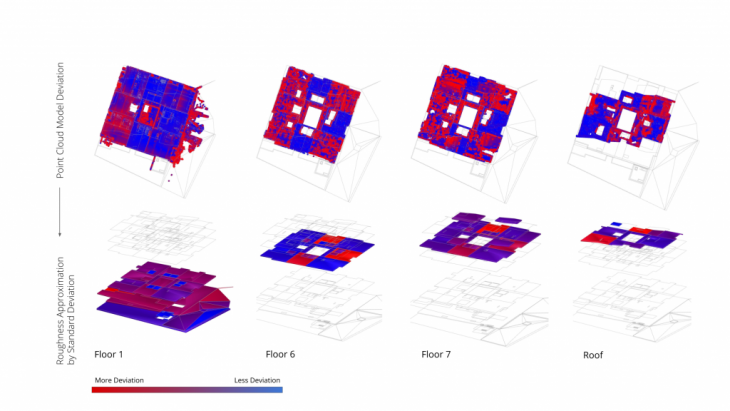
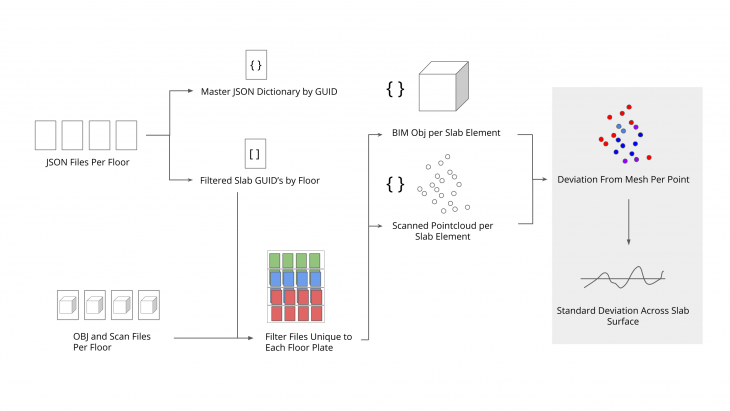
As we decided that the surface roughness of individual slab components would be important to design decisions, we also analyzed the positional point clouds for each slab element. An error check was performed, measuring the distance of each scanned point from its expected position in the provided mesh file. From there, the standard deviation within each slab element was calculated, giving us information on where to obtain smoother or rougher pieces as needed for the design.
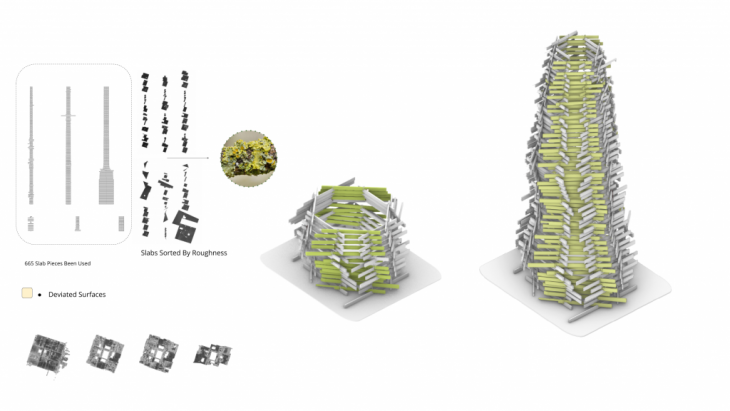
Slabs -Data Arrangement-Point Cloud Data – Sort By Roughness
Design Strategy
Data -Collected, Estimated and Missing information chart-Data Usage
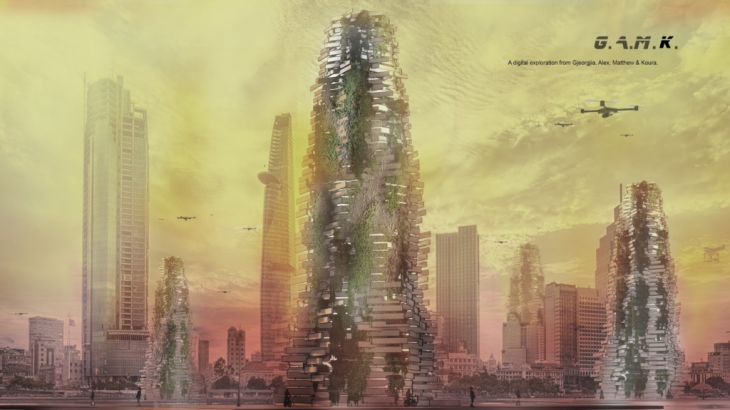
Design Concept
Bio-receptive Tower-Function Concept
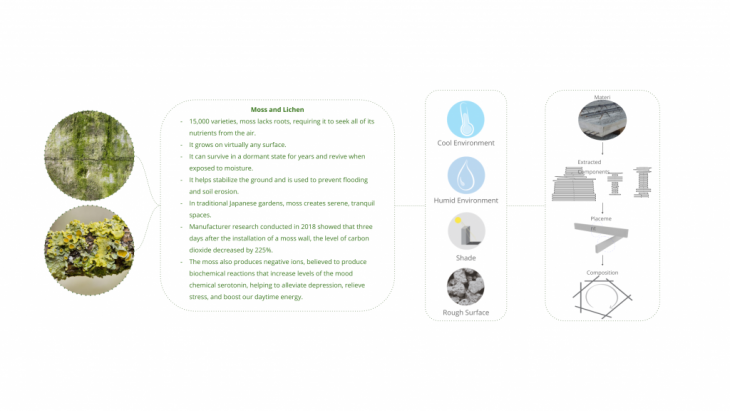
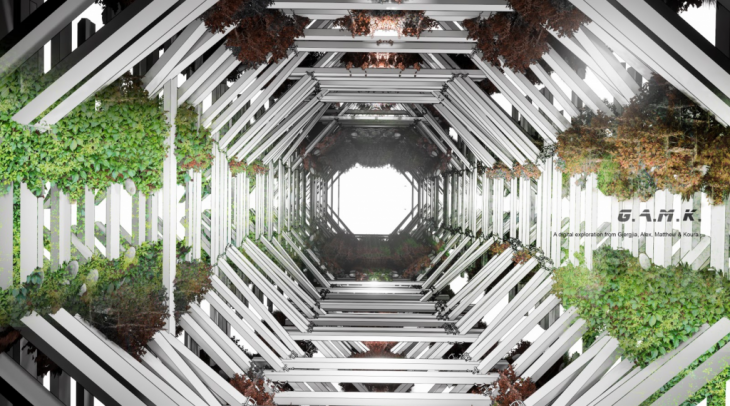
Keeping in mind the current issues of climate change and the projections of CO2 particles in our atmosphere for the near future, we chose to incorporate cryptograms in our concrete structure. Cryptograms such as mosses and lichens, grow on stone and rough surfaces. They thrive on a cool and humid environment with shade. To create such an environment by using the components we have, we decided to follow a process of stacking the slabs and enclosing an area where the cryptograms can grow.
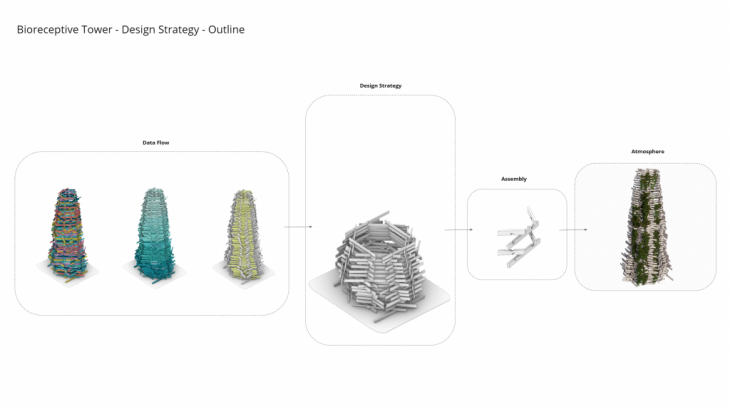
Bio-receptive Tower – Design Strategy – Outline
 Bio-receptive Tower – Design Strategy – Sorting by volume

Bio-receptive Tower – Design Strategy – Sorting by deviation
 Bio-receptive Tower – Design Strategy – Sorting by usage per level
 Bio-receptive Tower – Design Strategy – Sections – Overall Layout
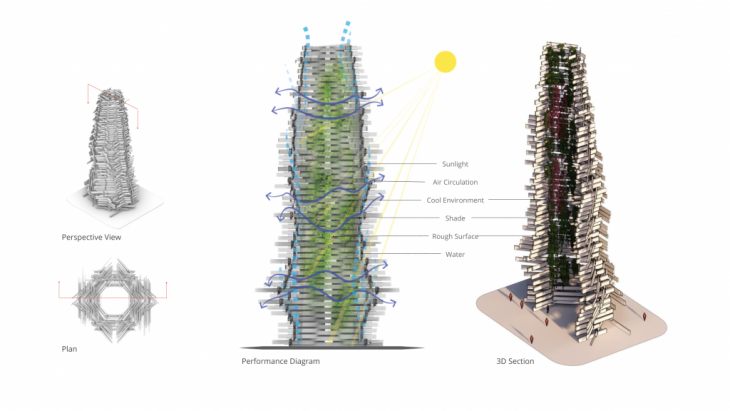
The air can flow through the tower and water is able to get in while the sun rays get filtered to provide shade. The rough faces of the slabs are located on the interior side of the tower to increase the surface area.
Components – Slabs – Detail Analysis via Point Cloud Scan
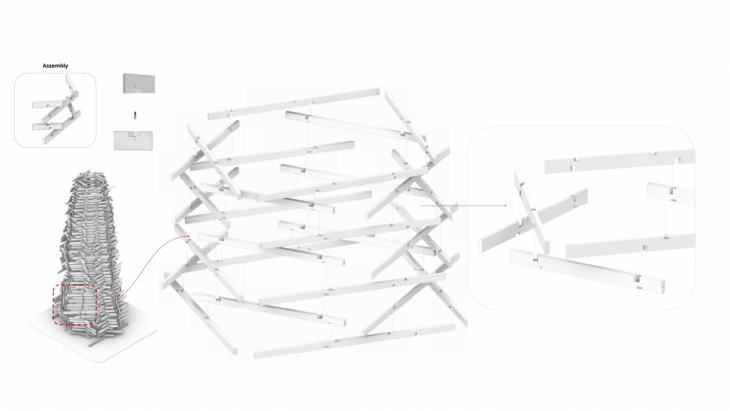
 Components – Slabs – Assembly – Interlocking Pieces
Final Renders
Bio-receptive Tower is a project of IaaC, Institute for Advanced Architecture of Catalonia developed at Masters of Robotics and Advanced Construction in 2019-2020 by Students: Abdelrahman Koura , Alexandros Varvantakis, Gjeorgjia Lilo & Matthew Gordon, Faculty: Stuart Maggs, Alexandre Dubor, Pol Cirujeda & Alejandro Nespereira, Faculty Assistant: Soroush Garivani.