I am a permanent user of Endomondo application. From April 2013 I use it every week to track my sport activities, mainly running and biking. So far, the most important data for me was total distance. During this assignment I had opportunity to analyze deeper all the data collected by Endomondo.
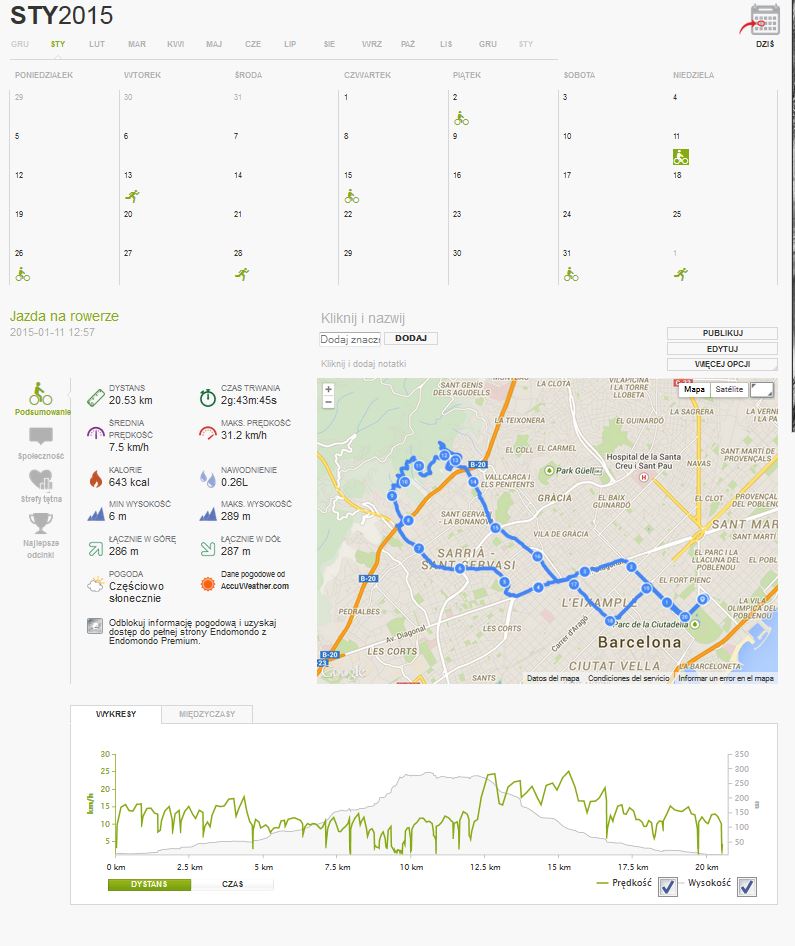
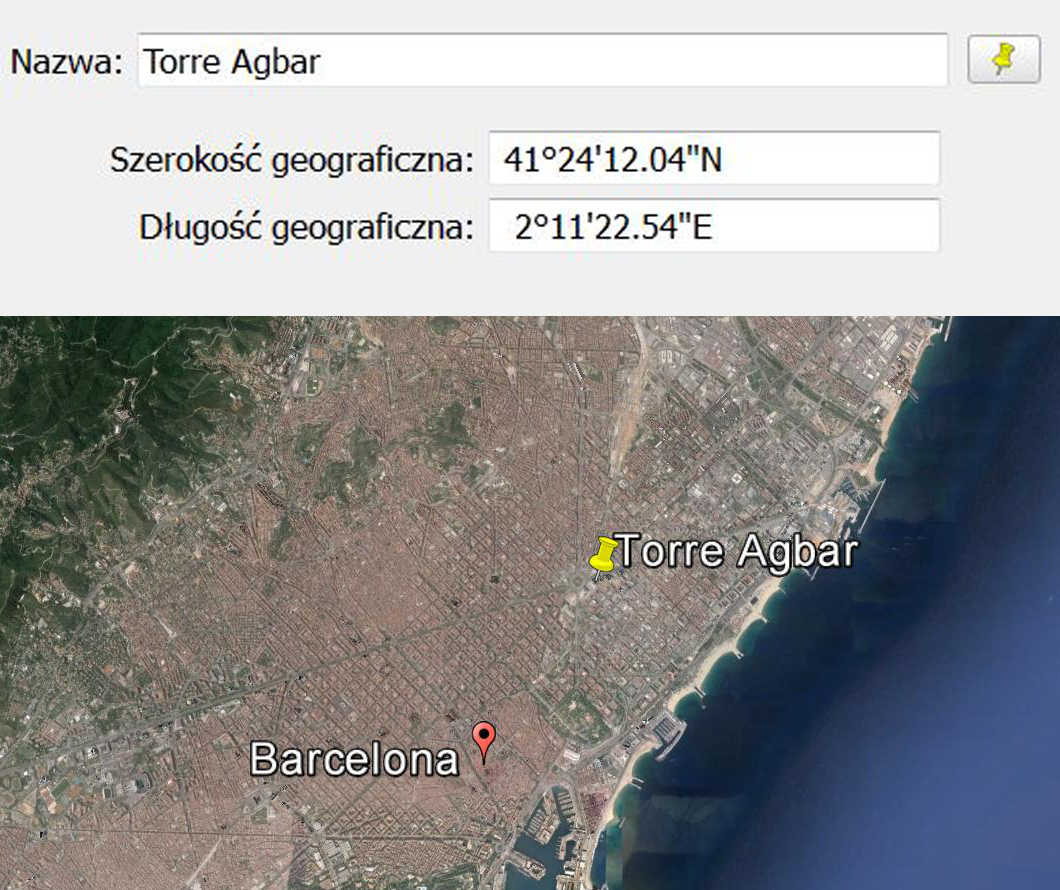 The data was exported in gpx. format then processed in Grasshopper. The route was adjusted to the map surface in Rhino by using coordinates from Google Earth.
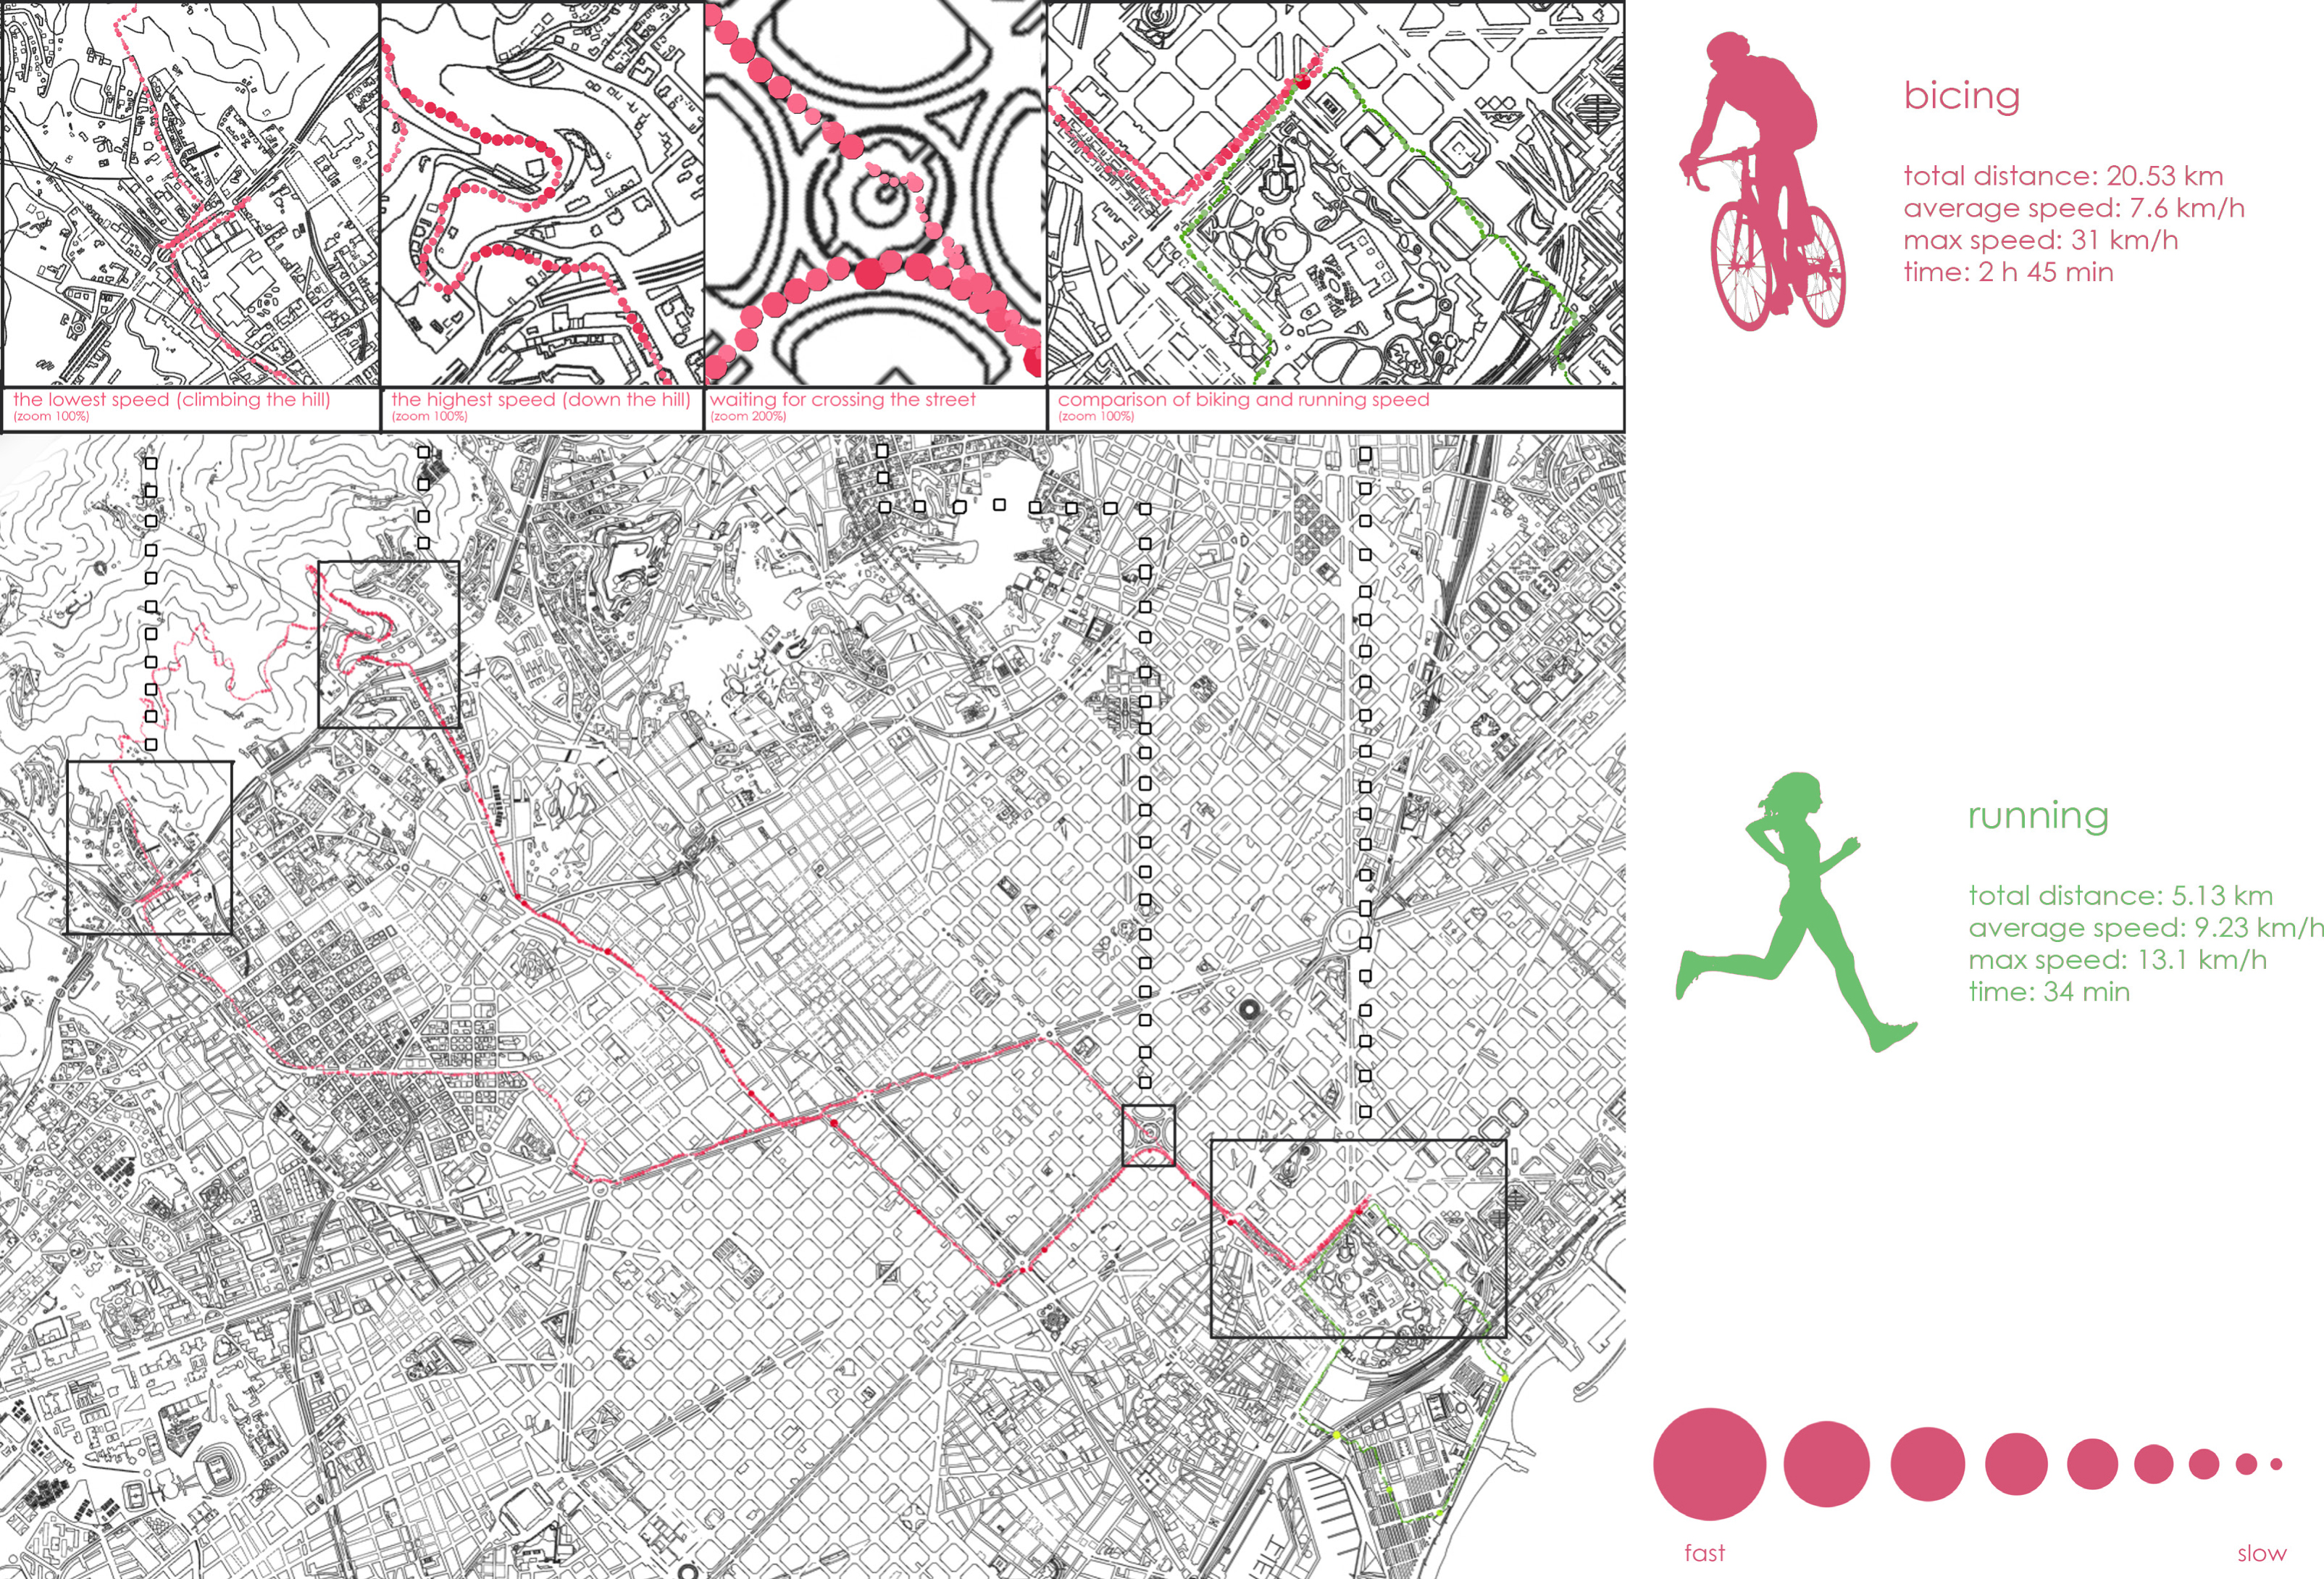
 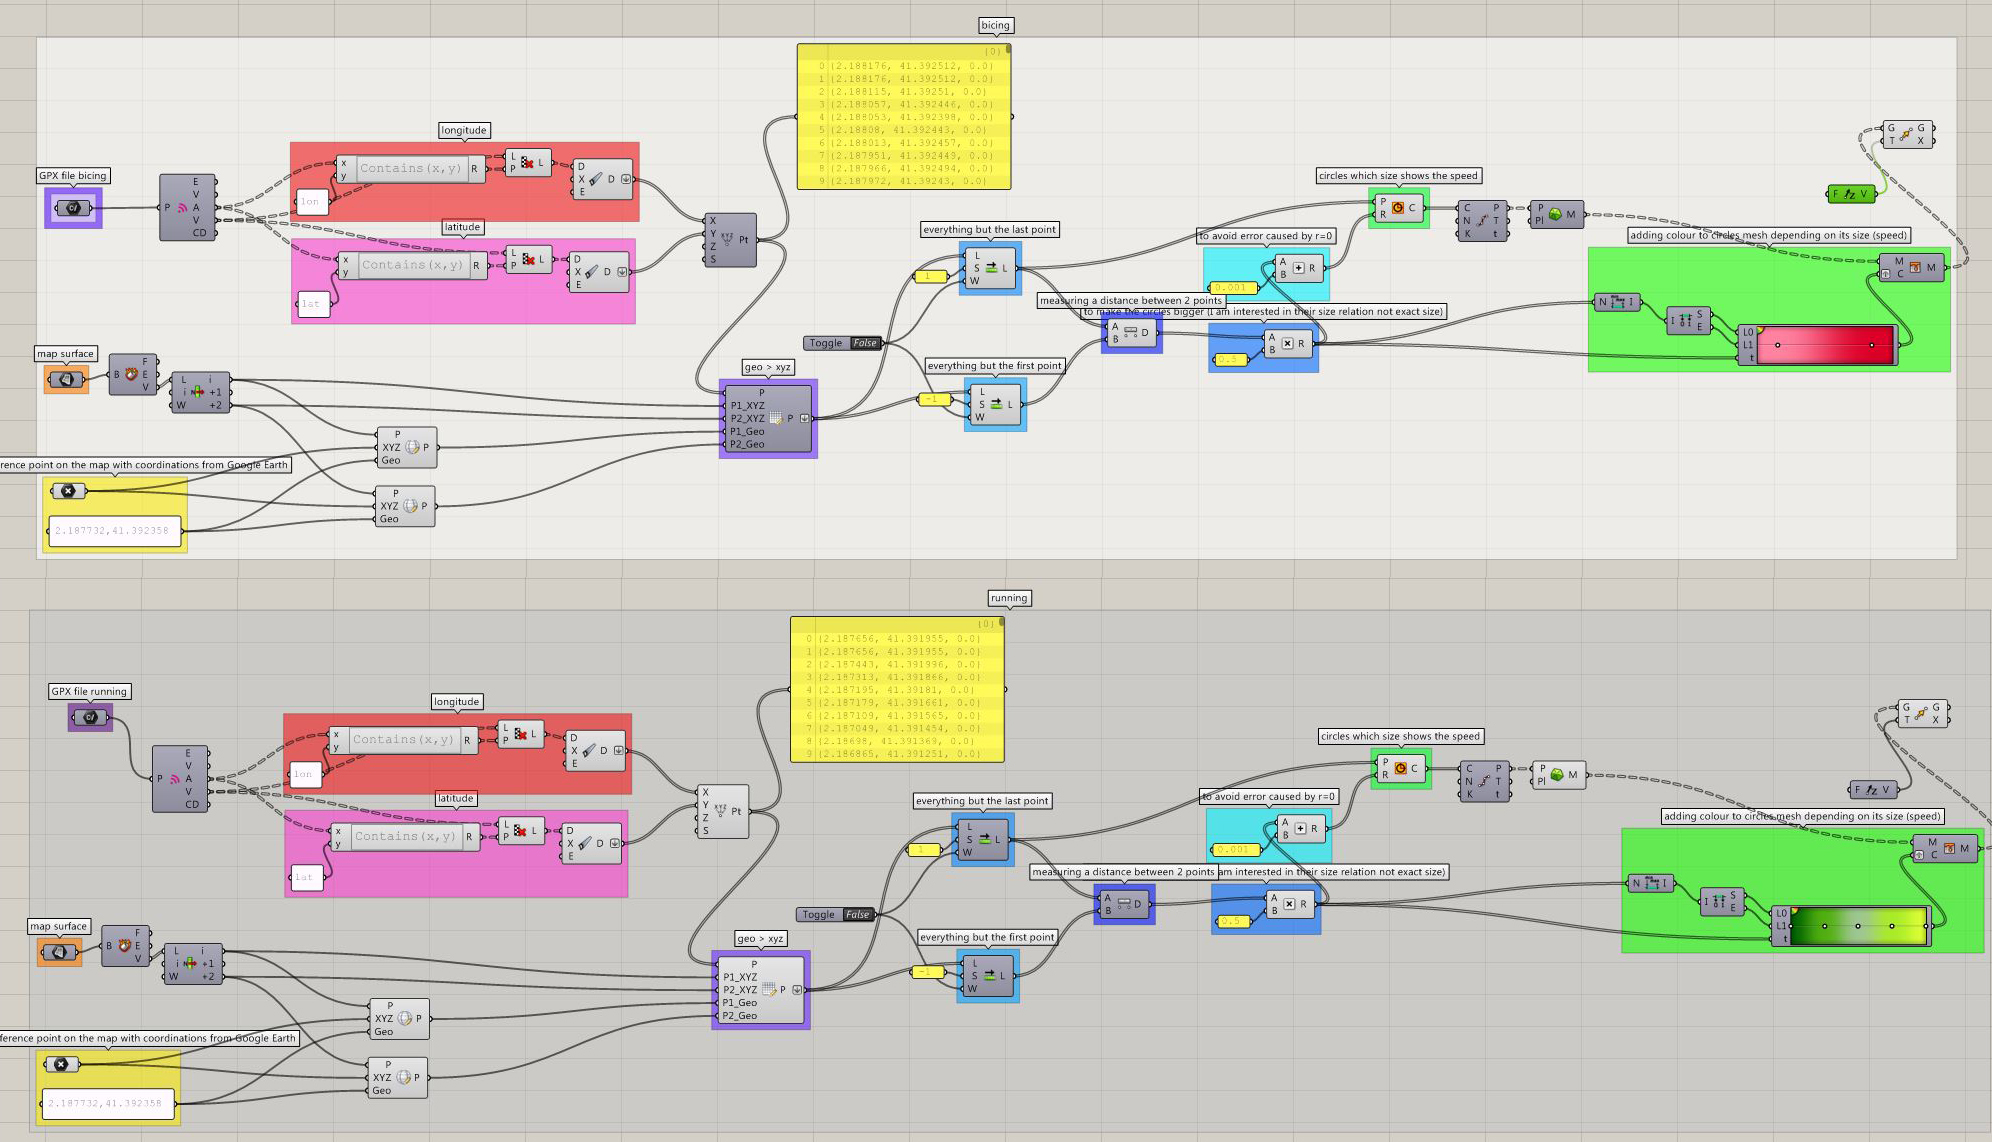 The visualization shows the route and the speed. Big circles show places where my speed was high, small ones where my speed was low. Surprisingly, my speed during biking and running was very similar (before I thought that I am much faster biking then running). On my biking route we can easily see when I was climbing the hill and when going down (extreme speed values). It seems my running has quite constant rate. I don’t have breaks. During running the only visible breaks are before crossing the street (traffic lights)