BikeMapper
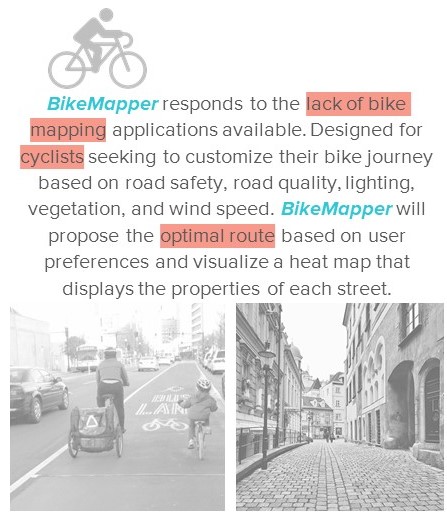
problem / solution
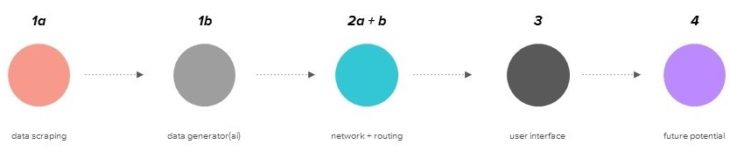
project phases
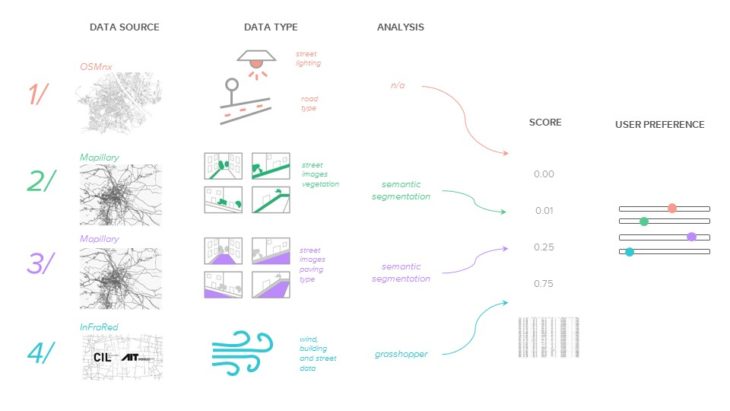
methodology
The methodology for executing the project is as follows.
We gather data from 4 sources:
- From OSMnx, we get data about the street lighting and path type.
- From Mapillary, we get data about the paving type and vegetation.
- Aufritte provides data about bike racks and service stations.
- InFraRed provides wind conditions.
After gathering and parsing the data, we assign a score to the street segments based on their characteristics. These scores are used to generate route options based on user preferences.
1a // data scraping
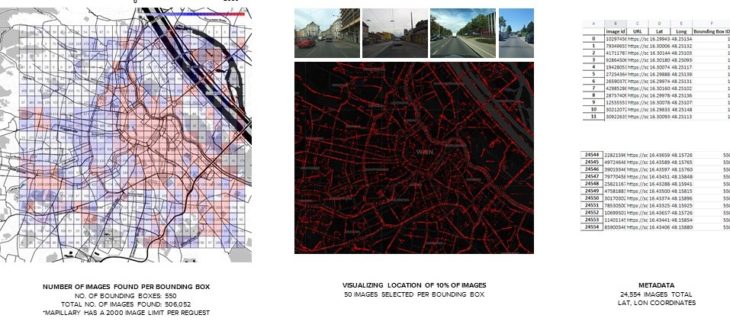
mapillary image scraping
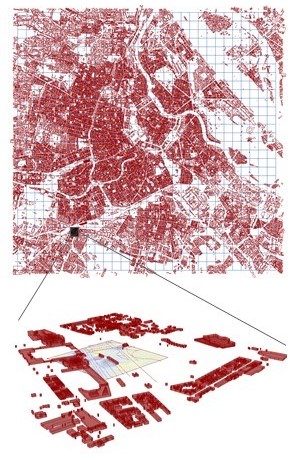
We utilized semantic segmentation to identify amounts of vegetation and street paving types throughout Vienna. We used Mapillary to obtain street view images across the city, but due to their 2000 image limit per request we had to first divide the city of Vienna into smaller regional bounding boxes. From there, We took a random sample of 50 images per bounding box, resulting in a total of 24,000 images being downloaded along with the latitude and longitude of where each image was taken.
1b // data generator(ai)
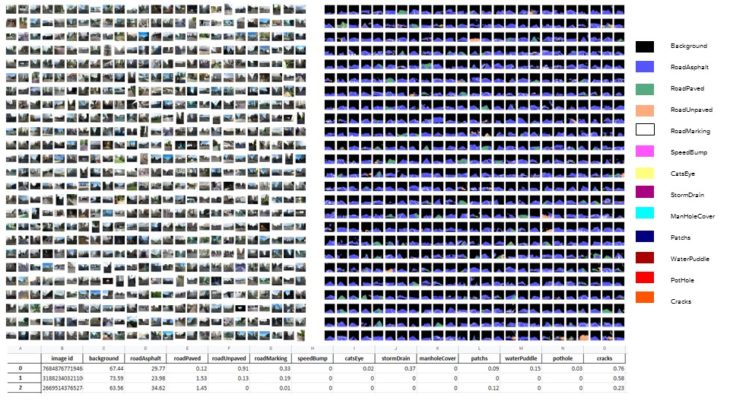
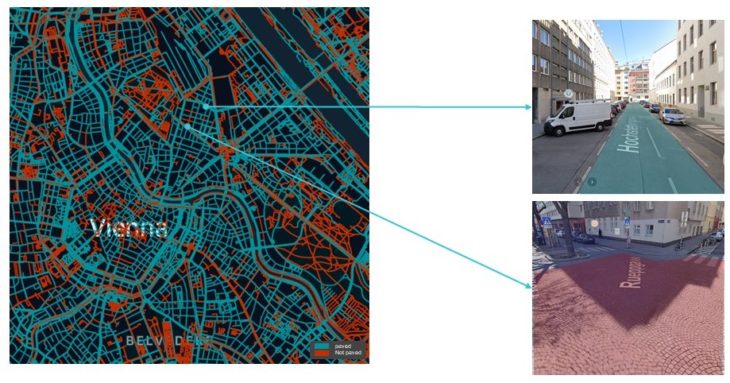
road surface segmentation
First we used a road surface segmentation script to identify roads that were paved and unpaved. Semantic segmentation is basically the process of assigning a label to a group of pixels to identify various objects in an image. Here you can see some of the raw street view images on the left with the corresponding pixel label generated by the AI model on the right.
Source:
https://github.com/AbhayVAshokan/Semantic-Segmentation-of-Road-Surface
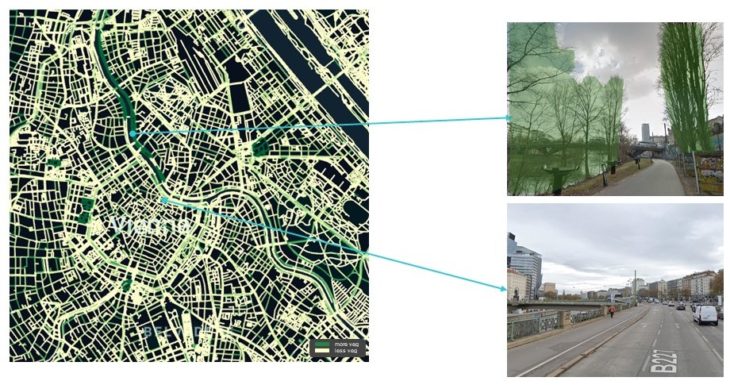
vegetation/biker detection
We also used a pre-trained model from MIT to detect the amount of vegetation we had in each image. Shown above are some of our results. After we performed the detections, we filtered out the bad images, which we categorized as the images with high amounts of ‘void’ detections or less than three unique detections, indicating that the image was zoomed in too much on one object.
Source:
https://github.com/lexfridman/mit-deep-learning/blob/master/tutorial_driving_scene_segmentation/tutorial_driving_scene_segmentation.ipynb
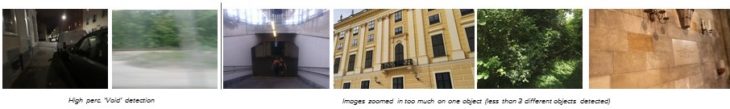
FILTER OUT BAD IMAGES
InFraReD wind
Lastly, we used infrared, a program developed by City Intelligence Lab that uses machine learning to perform almost instantaneous wind simulations, to get the wind speeds across the city. Due to analysis size limitations of InFraReD, we had to perform our analysis in batches defined by 500 by 500 meter bounding boxes. A normalized wind speed was applied from 8 different directions and the resulting speed recorded at 10 meters intervals along the street segments. To visualize the real-time wind speeds, we make a request to a weather API to get the current wind speed and direction and then multiply our normalized wind speed data by the current speed. In our results, we see the highest wind speeds at the rivers and large boulevards which we believe to be accurate and also at the parks which we understand to be inaccurate due to the fact that we only included buildings as our analysis context and no trees.
1) SUBDIVIDE AREA INTO 500X500 BOUNDING BOXES
2) ITERATE THROUGH EACH BBOX, ANALYZING EACH ONE SEPARATELY. WIND SPEEDS ARE ANALYZED EVERY 10M ALONG ROAD SEGMENTS AND AVERAGED AND FROM 8 DIFFERENT DIRECTIONS
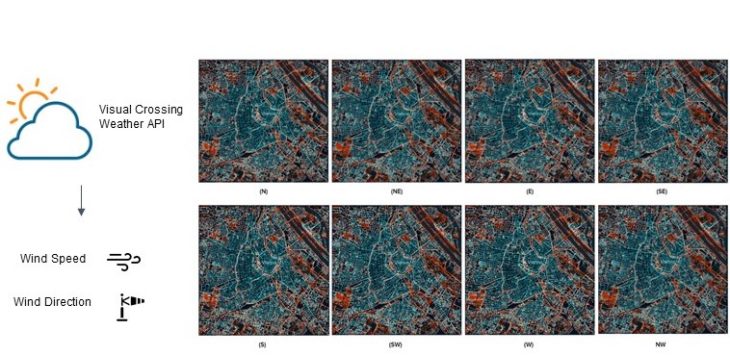
3) VISUALIZE WIND SPEED RESULTS (8 DIRECTIONS)
2a // network
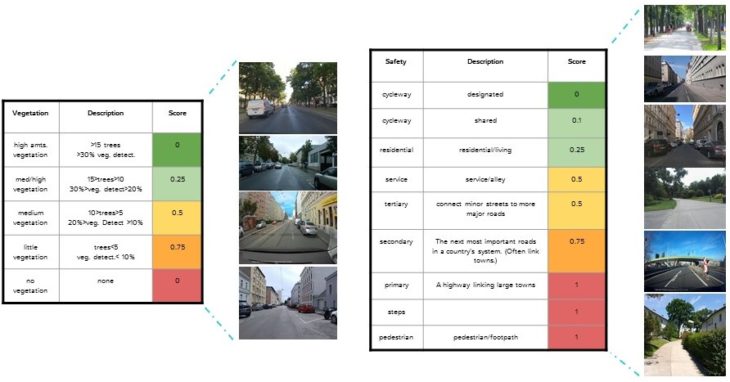
scoring system
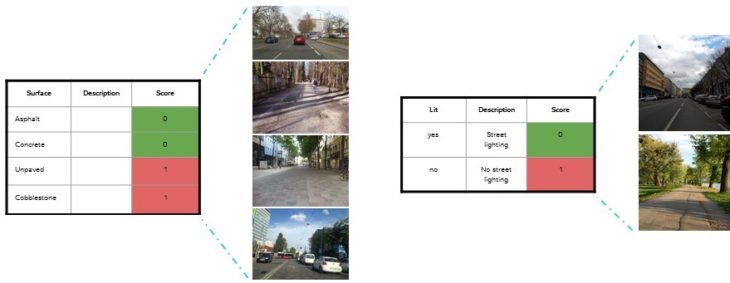
Scores can fall between 0 and 1, with zero being the best score possible and 1 being the worse. Here you can see an example of paved and unpaved roads and their corresponding scores on the left and similarly for lit and unlit streets on the right.
scoring system
Then roads with more vegetation are scored better than than roads without. In terms of safety, the best score goes to roads with a designated bike lane, then the next best score for a shared bike lane and then progressively worse scores as the roads get busier and speed limits faster. Even though a person could ride on a pedestrian street or sidewalk, we have penalized these road types for the safety of pedestrians.
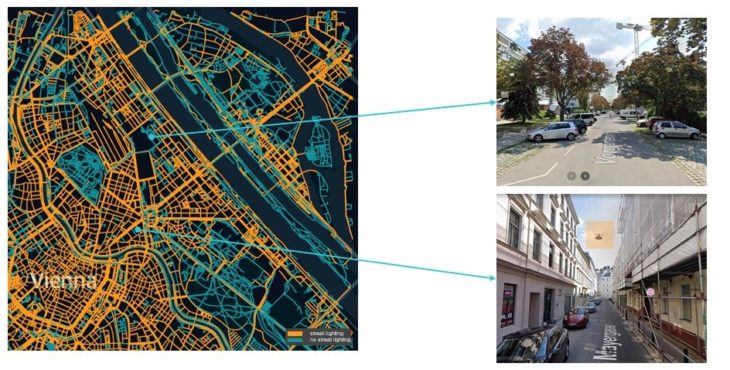
validation
Once we generated our networks, we ran a sanity check using google street view to make sure our results are correct.
litScore
Below is the lighting network. You can see the top photo doesn’t have a light, and the bottom has a light highlighted in the yellow box.
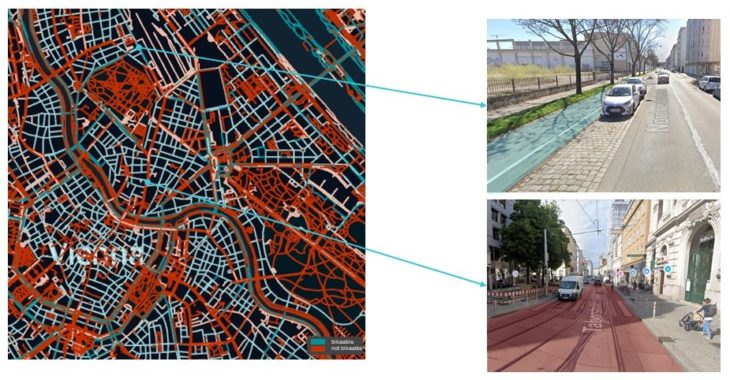
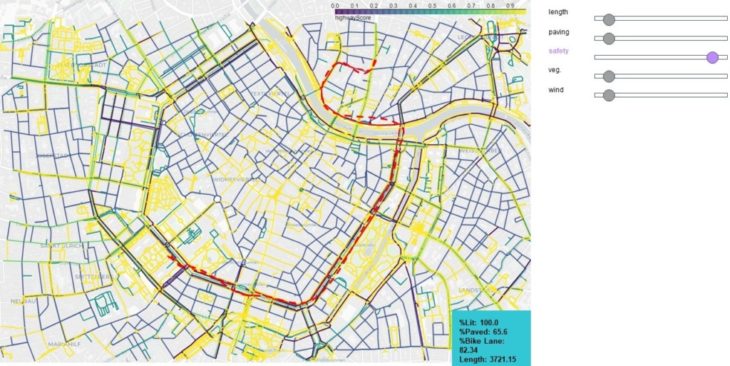
safetyScore
Here is the bikeability network. The top photo has a protected bike path, while the bottom has tram tracks.
pavedScore
Here is a paved street on the top and a cobblestone street on the bottom.
vegScore
Lastly, we see a vegetated bike path above and no vegetation below.
2b // routing
route
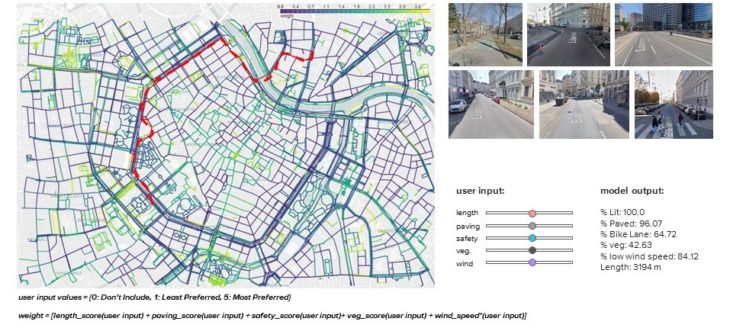
We wanted to test our network with different input preferences, with the same start and end points to see if our algorithm could produce different but customized routes. On the left, streets are weighted by length, so using a shortest path algorithm, we are able to suggest a ride with a shortest distance. In the ‘bike lane’ image below, we weight the network the most for bike lane inclusion, resulting in a route that is longer, but enables a rider to have a bike lane for 82% of their the ride compared to only 1% of the ride for the ‘shortest path’ image below.
shortest path
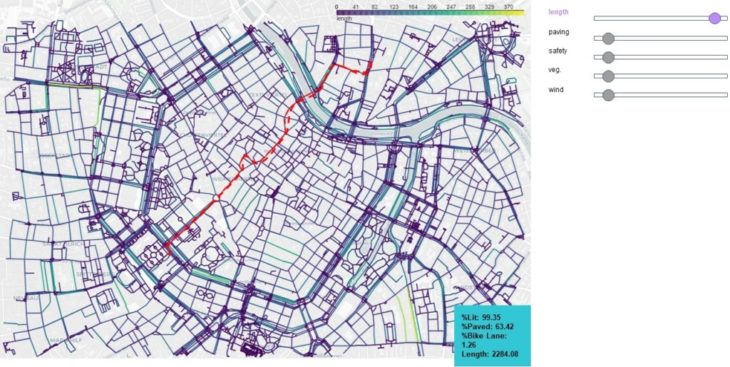
bike lane
balanced
Next we tested what would happen when we have a balance in user inputs. While not the shortest route, we see that the route is well lit, avoids cobblestones for 96% of the time, has moderate amounts of vegetation along the route, and travels across areas with low wind speeds 84% of the time.
3 // user interface
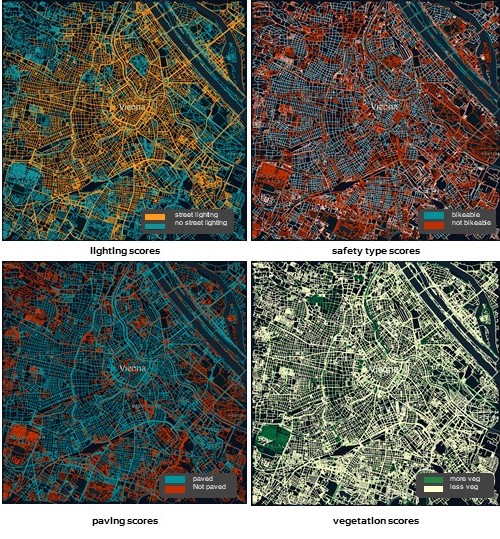
static layers
Users can toggle between different layers to visualize the results on a web application:
- bike racks and service stations
- lit score
- paved score
- safety score
- vegetation score
- average wind
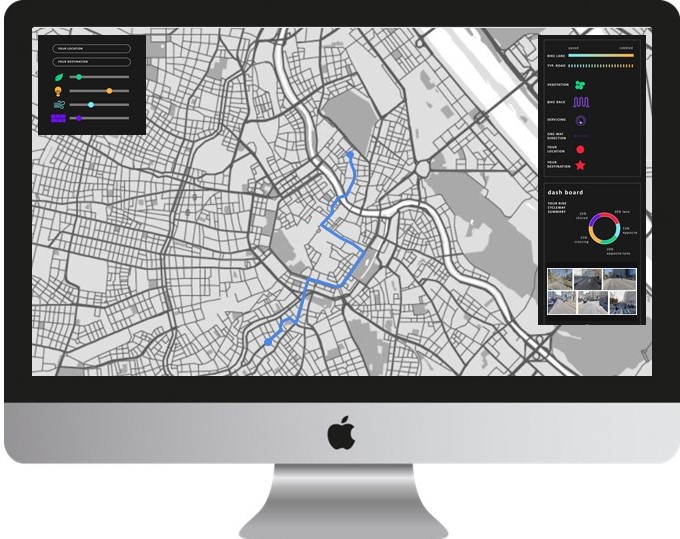
live layer
For the interactive layers, the user inputs their start and end location and route type preferences, and on the right a dashboard will display the properties of their route, for example how much of their ride contains a bike lane or unpaved streets and also a preview of street view images along their path.
4 // future potential
additional inputs + wheelchair accessibility
As for future potential, this project would benefit from additional inputs for predicting the safest route. They could include:
- adjacent car speed
- width of the bike path
- integrity of the road
- distance between cars + bikes
- slope of the bike path
As for a secondary application, similar inputs could be collected for an accessibility score allowing people with a disability to have more independence getting around the city.
All these additional inputs can be collected using live data from community contribution using cameras mounted to a bike or car so that the map can always be kept up to date.
With this approach, the methodology can be applied to any city, especially ones with less favorable cycling conditions and perhaps even make suggestions to the city to improve certain areas.
Credits
BikeMapper is a project of IAAC, Institute for Advanced Architecture of Catalonia developed at Master in Advanced Computation for Architecture & Design in 2021/22 by
Students: amanda gioia . salvador calgua . sophie moore . zoé lewis
Faculty: angelos chronis . aleksandra jastrzebska . nariddh khean . serjoscha duering