Bicing BCN – Data Visualization
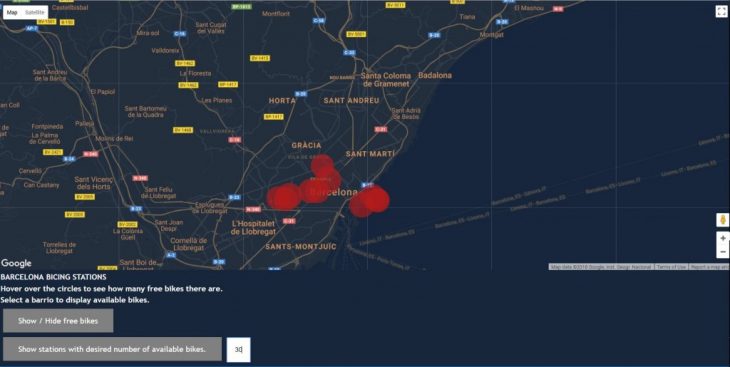
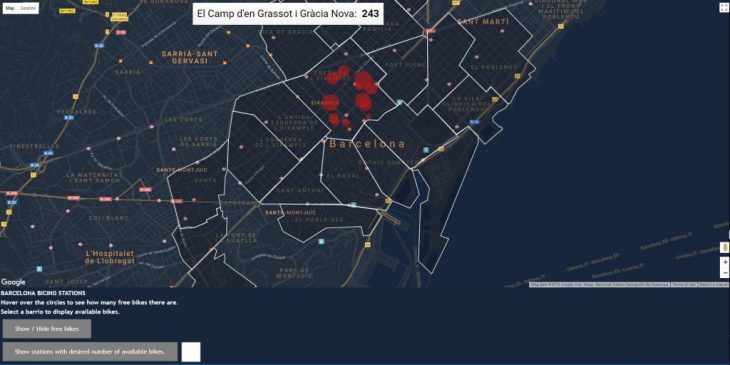
For this Data Visualization Seminar, we decided to use the information given about Bicing stations around Barcelona on opendatabcn, and created a web interface. This web interface allows users to visualize the empty Bicing stations around the city. By hovering over the circles, the user sees how many bicycles are available at that station. The user can also also hover over a district and see the total number of free bicycles in that district. The user is also able to request to see all the stations with a desired number of free bikes or more.

All the files can be found on github :
https://github.com/suzimifsud/BicingVisualisation-
Tool Seminar 2C: Interaction Tools
Tutor: David Dalmazzo
Students : Susannah Mifsud and Ioannis Vogdanis
