An Integrated Workflow for Structural Optimization with Clustering for Generative Design
Introduction
While performances of the building are depending on early design stages, building performances tend to be analyzed later design stages when most of plans were decided already.
Computational aided design tools can allow architects and engineers to combine their fields in early design stages.
In this research, I studied a workflow for early design stages of architectural design with structure analysis tool and machine learning tool. In the case study, exoskeleton structure was focused on. Basic idea is to optimize homogenized diagrid structure into building specific structure.
Research Methodologies
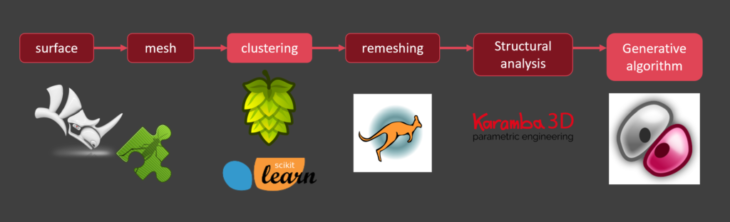
Workflow overview
The methodology implemented tools for structural optimization and machine learning.
All the workflow is integrated on an architectural CAD software Rhinoceros and its programming interface grasshopper.
Model Description
Three different models are used for input surface
- Model A: a conventional rectangular solid
- Model B: with voids
- Model C: with more curves than the other ones.
These models are selected to represent shapes which change structural behavior due to its cantilever or curvature
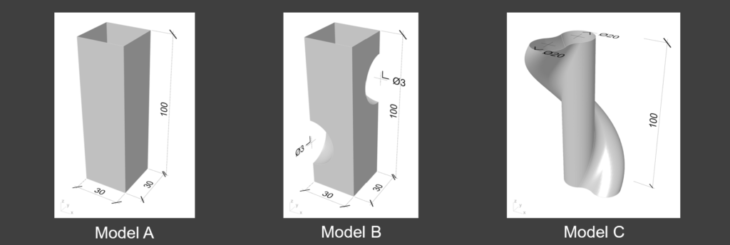
Model description
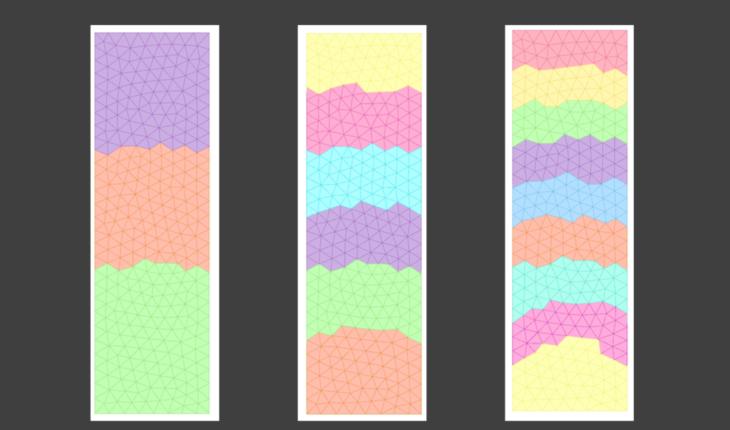
Clustering
Mesh faces are clustered into each segment by means of:
- Distance from the origin of point
- Maximum curvature
- Minimum curvature
- Gaussian curvature
- Mean curvature
The count of clusters were 3, 6, and 9
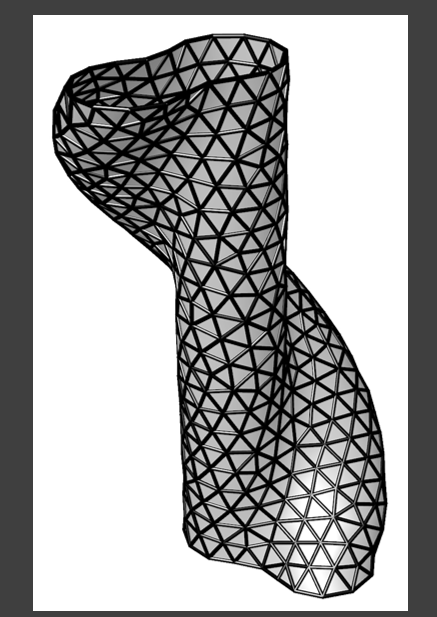
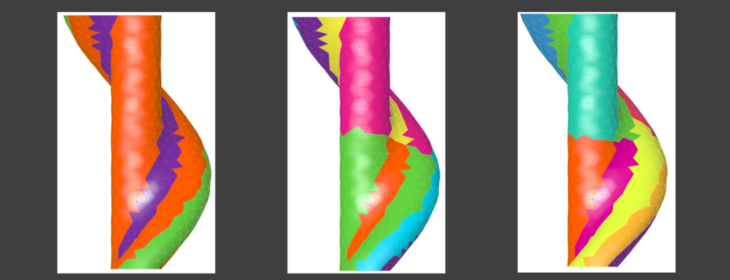
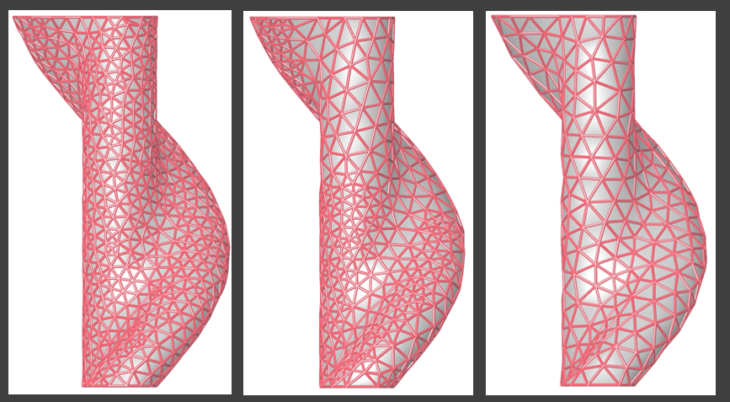
Remesh by colour component from Kangaroo 2 changed the length of mesh edge gradationally in range of 3 to 7 m.
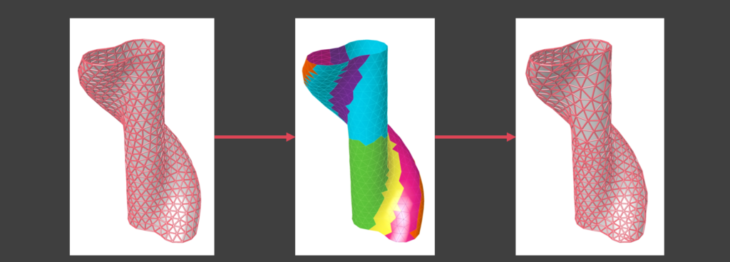
Model C example for remeshing
Structural Analysis
Loads of self-weight and wind load as 1 kN/m2
Steel was used as material
The section was circular, with diameter of 40 cm and thickness of 0.4 cm.
Reference structures with homogenized triangle mesh with 5m edge length
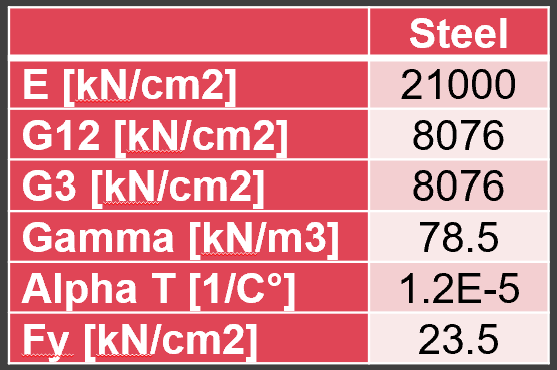
Mechanical properties for steel
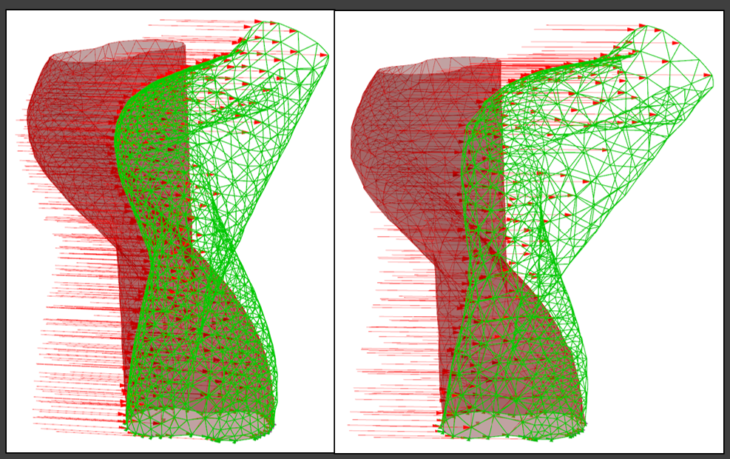
Structural analysis results in different mesh density
Reference structure
Genetic Algorithm
Galapagos was employed to optimize the structure with genetic algorithms.
- Genes (input): sliders from 0.1 to 0.9, which used for color remeshing
- Fitness (goal): self-weight * max displacement per total floor area
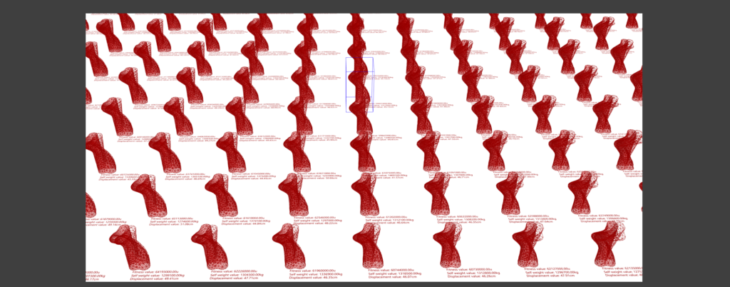
Generated samples by Galapagos
Case Study
Results on model A
The numbers for samples were 603, 1301, and 901 for model with 3 clusters (A3), 6 clusters (A6), and 9 clusters (A9), respectively.
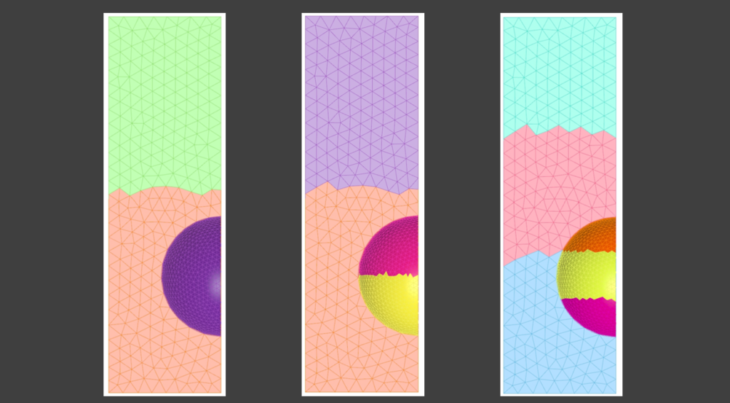
Results of clustering for A3, A6, and A9
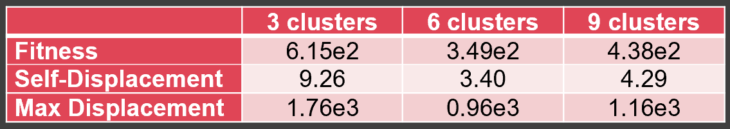
A3 model showed the largest distribution of crowd with 6.15e2 in standard deviation for fitness
In A6 and A9, distribution was relatively small
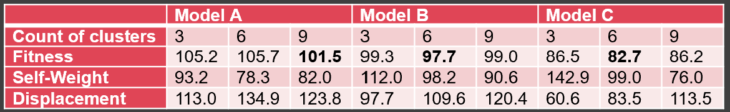
In this model, A9 model showed the smallest fitness, 0.822, with 82.0% in self weight and 123.8% in max displacement compared to the reference structure.
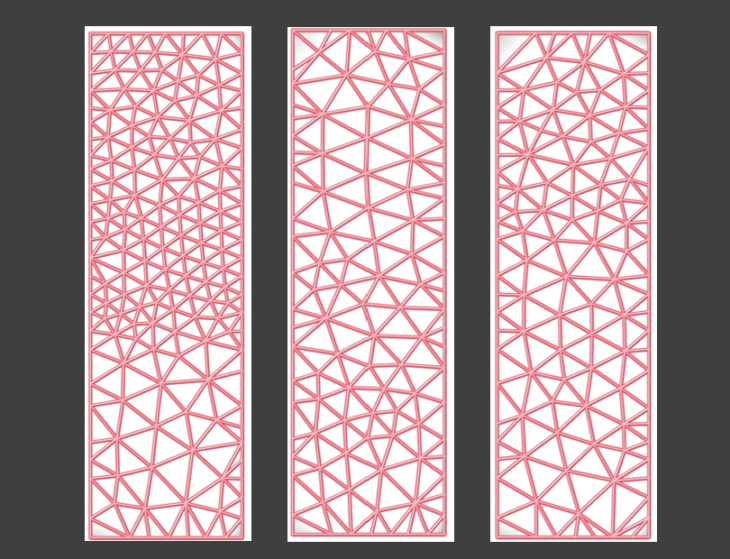
Best result visualizations: A3, A6, A9
Standard deviation for model A
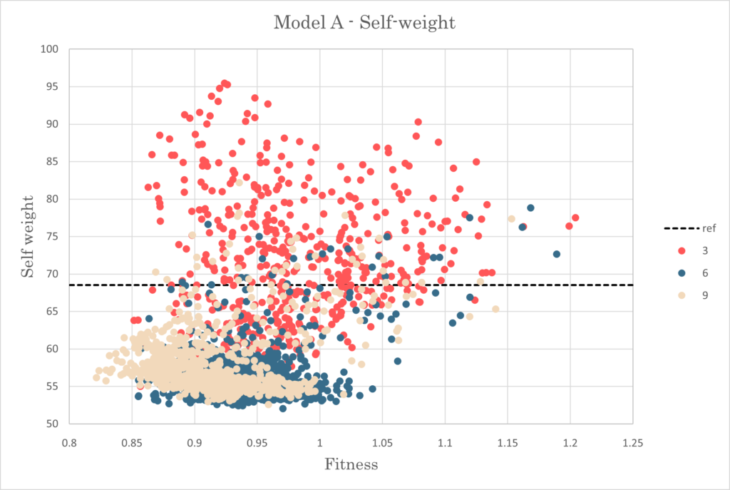
Self weight-Fitness relationship for model A
Results on model B
The numbers for samples were 726, 1251, and 750 for model with 3 clusters (B3), 6 clusters (B6), and 9 clusters (B9), respectively.
Results of clustering for B3, B6, and B9
Distributions were similar to that of model A, whereas standard deviation for fitness was almost twice
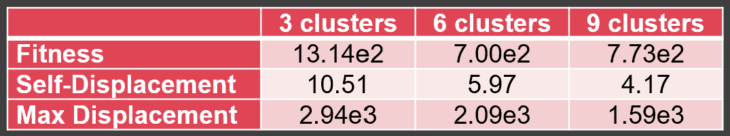
The best fitness was 0.907 from samples of B6
The best sample showed 98.2% self-weight and 109.6% displacement in comparison to the reference structure
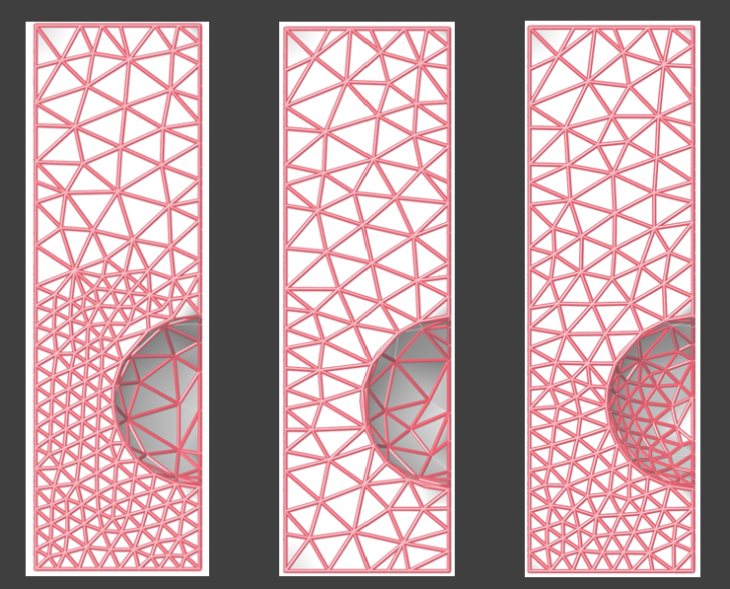
Best result visualizations: B3, B6, B9
Standard deviation for model B
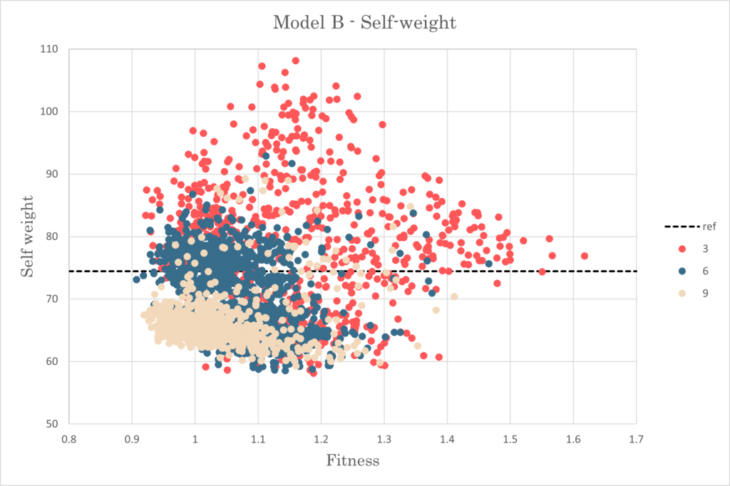
Self weight-Fitness relationship for model B
Results on model C
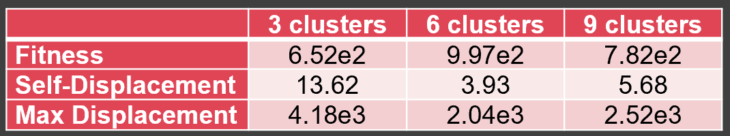
The number of samples were 594, 1078 and 976 for model with 3 clusters (C3), 6 clusters (C6), and 9 clusters (C9), respectively.
Results of clustering for C3, C6, and C9
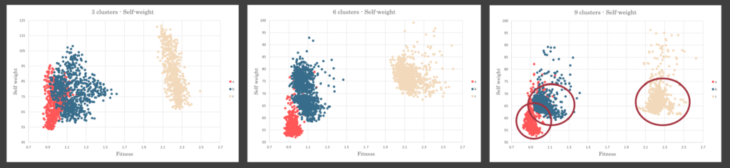
All the crowds indicated relatively large standard deviation
Results showed big differences depending on the counts of clusters as results from C3 aimed lower displacement with higher displacement, while C9 model aimed totally opposite in the graph.
The best sample with 1.950 in fitness was generated from C6 model with 99.0% in self-weight and 83.5% in displacement.
Best result visualizations: C3, C6, C9
Standard deviation for model C
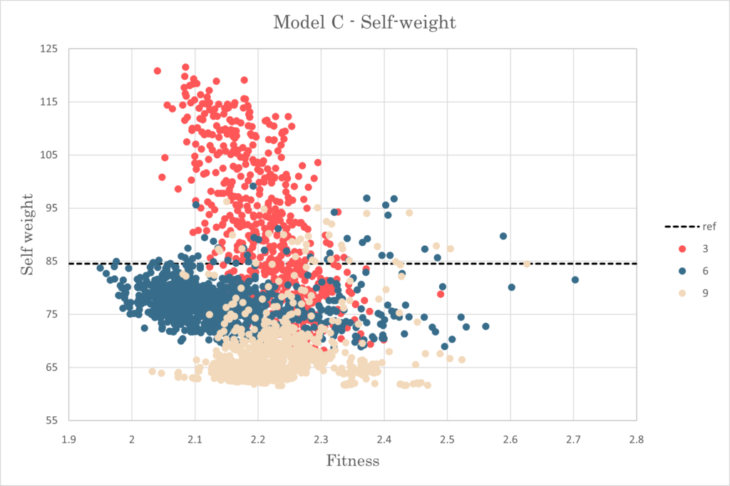
Self weight-Fitness relationship for model C
Discussion
Distribution
- By increasing the number of the clusters, shapes of the crowds were changed.
- Graphs shows that samples were generated densely around a specific side of the crowd by increasing number of clusters.
- Genetic algorithm created more samples with lower self-weights to find models with better fitness.
- Though it is needed to shift the number of clusters and select proper count to each model.
Comparison of self weight-fitness graph
Fitness
- Relative fitness in comparison to reference structure were smallest in model C, followed by B and A.
- Best number of clusters in terms of fitness were different by models.
- These models would cluster the mesh faces of models better than the others.
Comparison of best results with references
Conclusions
- The result shows application of clustering within a workflow for structural optimization allowed genetic algorithm to find tendency of better results in early generations.
- Changing count of clusters tend to cause less standard deviation of fitness, even though, improvements of fitness from self-weight and max displacement was depending on models.
For improvement of the workflow
- Selecting numbers for clusters by rational methodologies
- Comparing calculating time for structural optimization by genetic algorithm
For further researches:
- Adding new parameters or weights for clustering
- Changing models and parameters for structural analysis
An Integrated Workflow for Structural Optimization with Clustering for Generative Design is a project of IAAC, Institute for Advanced Architecture of Catalonia developed in the Master of Advanced Computation in Architecture and Design 2021/22 Student: Takeaki Sakakibara Thesis Advisor : Oana Taut
