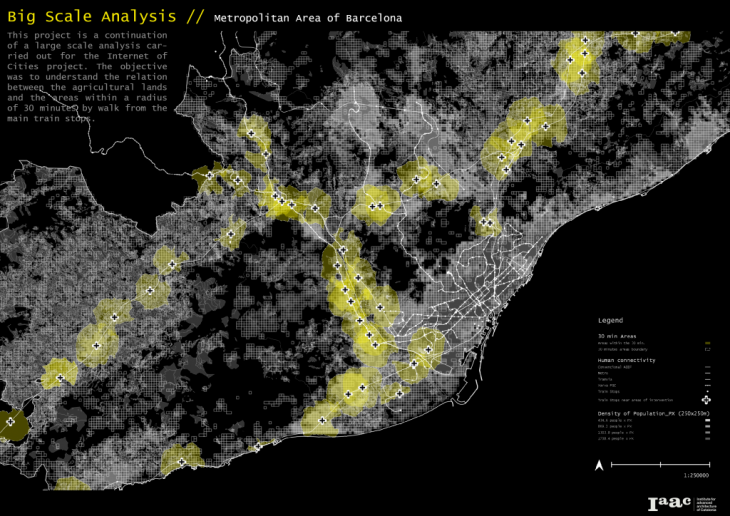
This project is a continuation of a large scale analysis carried out for the Internet of Cities project, which look for the creation of a big sustainable organism in the urban surrounding through a sustainable agriculture. The objective was to understand the relation between the agricultural lands and the isochrones of 30 minutes by walk from the main train stops in the Metropolitan Area of Barcelona. The proximity it´s a key parameter in our proposal, because we need to connect the urban environment with the rural one.
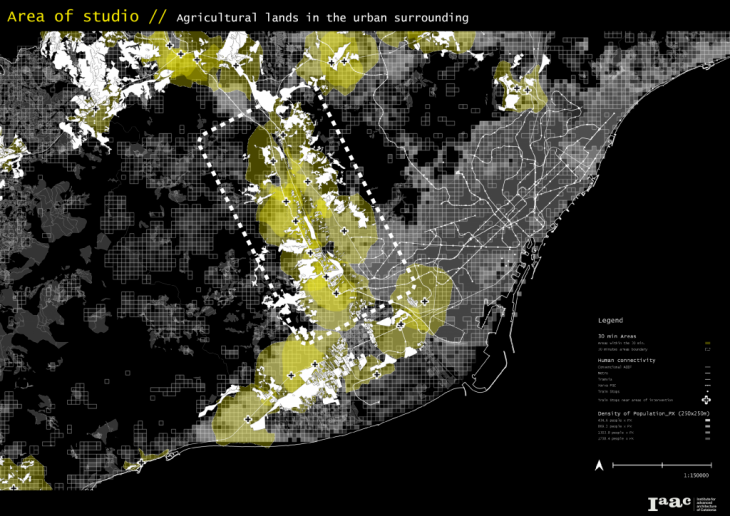
Opportunities in the urban surrounding
The aim in this case is to analyse the density of the agricultural lands within the isochrones of 30 minutes by walk in the periphery of Barcelona and study them in more detail than in the previous analysis. This allows us to understand where to locate one of the key elements of our study, the U-Pick farms. Their main function is to relate people living in urban areas with sustainable and organic agriculture, as well as with the local farmers. We think about this element as a promoter to start the change.
We can map where we have more probabilities to find potential agricultural areas in the urban surrounding in relation with the connectivity infraestructures. The area of studio is selected based on the time connectivity to the urban node of Barcelona and the disponibility or agricultural lands inbetween the local urban nodes.
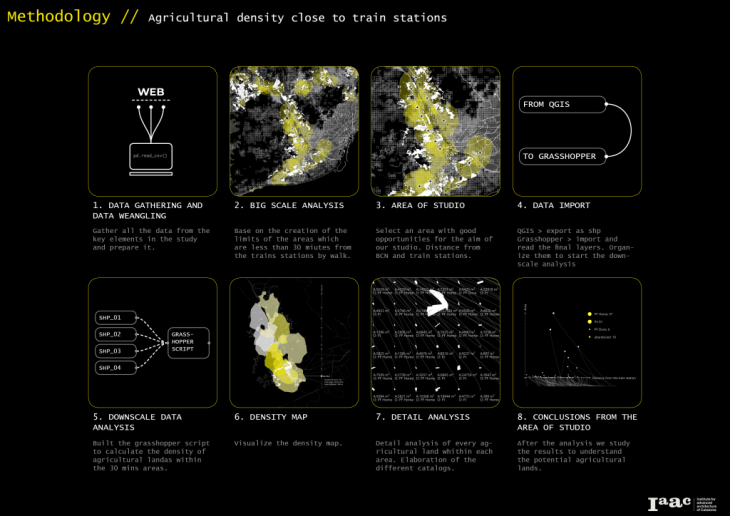
Methodology
- Data gathering and data wrangling: Gather all the data from the key elements in the study and prepare it.
- Big scale Analysis: Base on the creation of the limits of the areas which are less than 30 miutes from the trains stations by walk.
- Area of studio: Select an area with good opportunities for the aim of our studio. Distance from BCN and train stations.
- Data import: QGIS > export as shp // Grasshopper > import and read the final layers. Organize them to start the downscale analysis
- Downscale data analysis: Built the grasshopper script to calculate the density of agricultural landas within the 30 mins areas.
- Density map: Visualize the density map.
- Detail analysis: Detail analysis of every agricultural land whithin each area. Elaboration of the different catalogs.
- Conclusions from the area of studio: After the analysis we study the results to understand the potential agricultural lands.
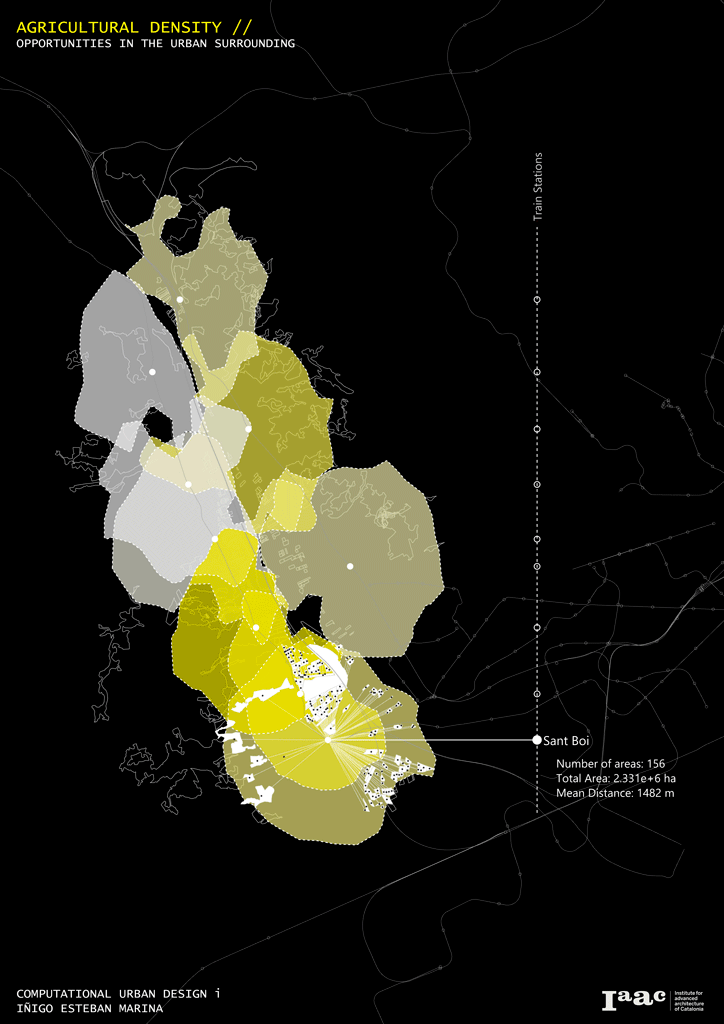
Analysis of density in the different Areas of Study
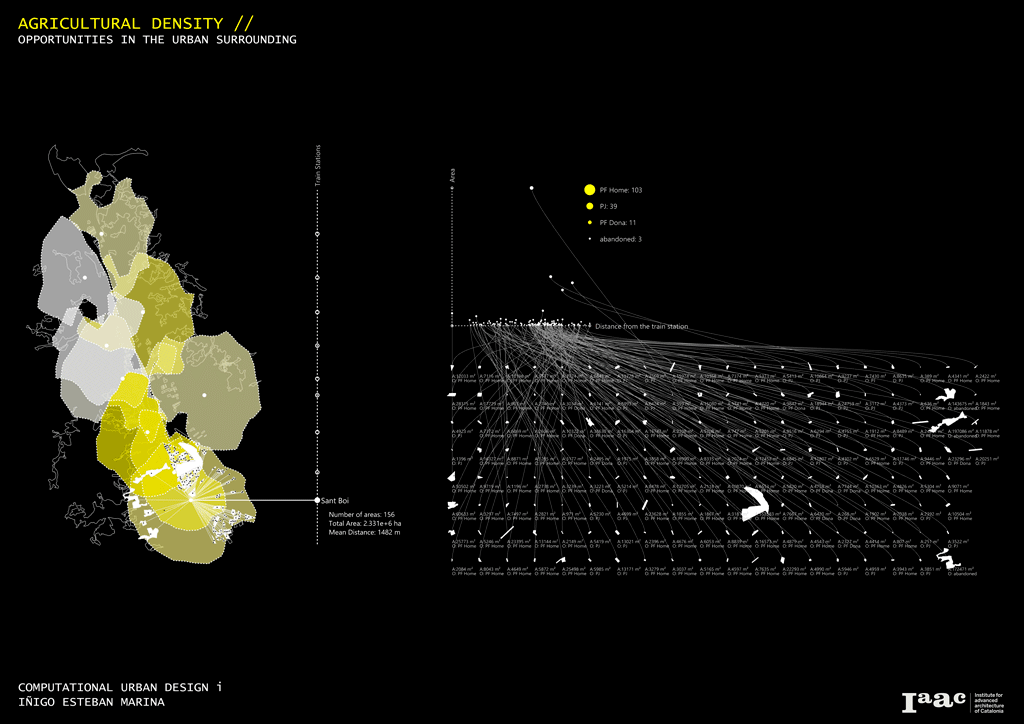
Once we have the information in grasshopper, the first objective is to obtain the density map of the studied area. To do this, the number of agricultural lands per area is measured and their surface is added. With this information it can be clearly visualized which isochrone has more possibilities and the density of agricultural lands.
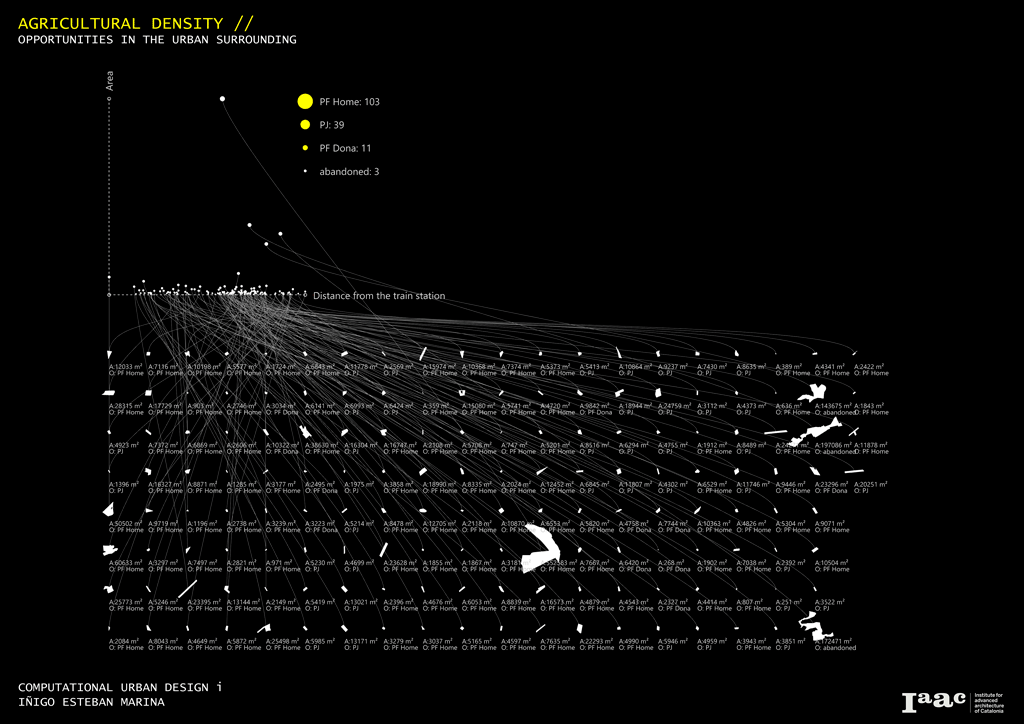
Detail Analysis_Catalog of crops per Isochrone: Shape, area and owner
We have a big number of agricultural lands in the more densities isochrones. This last part of the analysis focus in the understanding of each land. In order to do that a catalog is presented. It describes the shape, the owner and the area. With a scatter plot we can see the correlation between the area of the land and the distance to the closer train station. We focus our attention on the lands with a big area and a short distance to develop the U-Pick farms.
Conclusion
A detail analysis within an intentional framework can bring new insights to the table and help in order to drive decisions. In this case it´s not easy to go through all the possibilities. Instead, through data analysis, understanding of correlations between the parameters and data visualization you can built a documented design process and take more concious decision.
Agricultural Density: Opportunities in the Urban Surrounding is a project of IAAC, Institute for Advanced Architecture of Catalonia developed at Master in City & Technology in 2020/21 by student: Iñigo Esteban Marina, and faculty: Eugenio Bettucchi & Iacopo Neri.