For this Seminar, we had the chance to keep working on the project we developed in class to understand how to work with Data Visualization about Bicing stations around Barcelona or create something new from scratch.
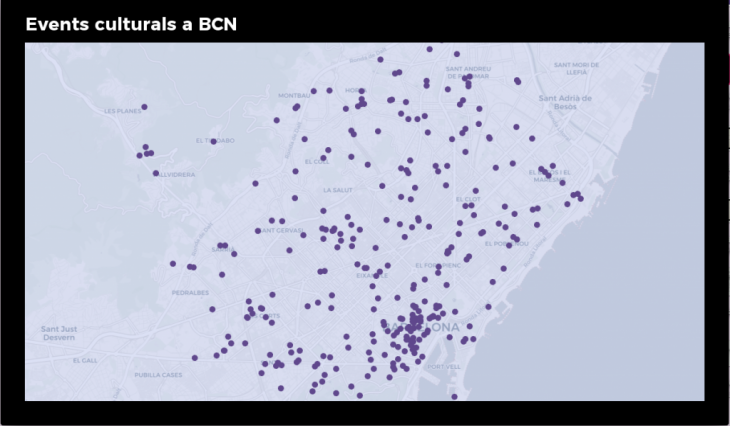
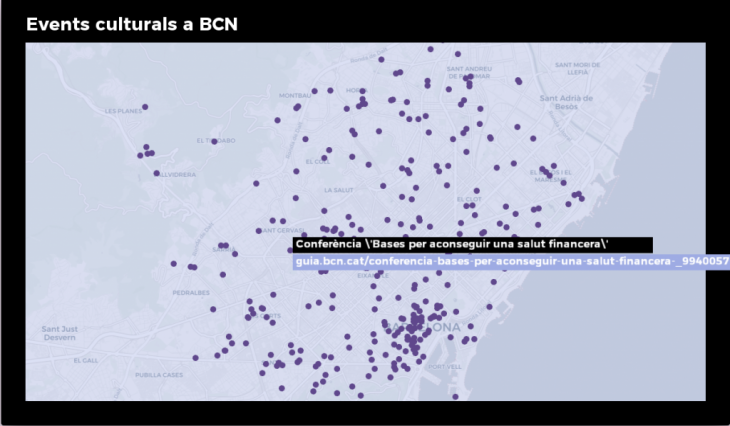
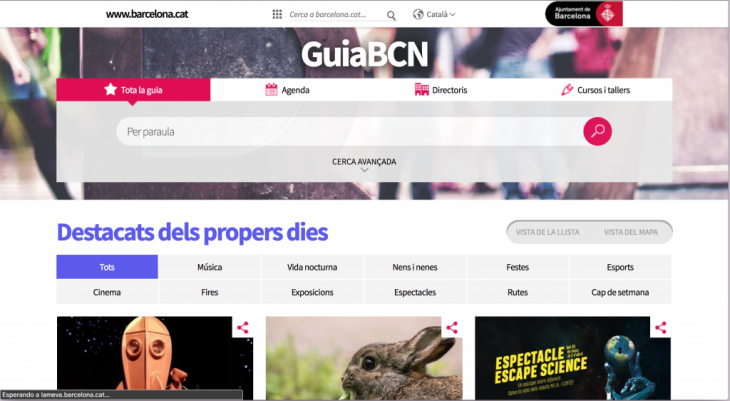
We chose to create something new, using the data of Cultural Events in Barcelona obtained from this link,
http://opendata-ajuntament.barcelona.cat/data/ca/dataset/agenda-cultural
, to create a simple but effective map of events of the city.
The project consists on three parts.
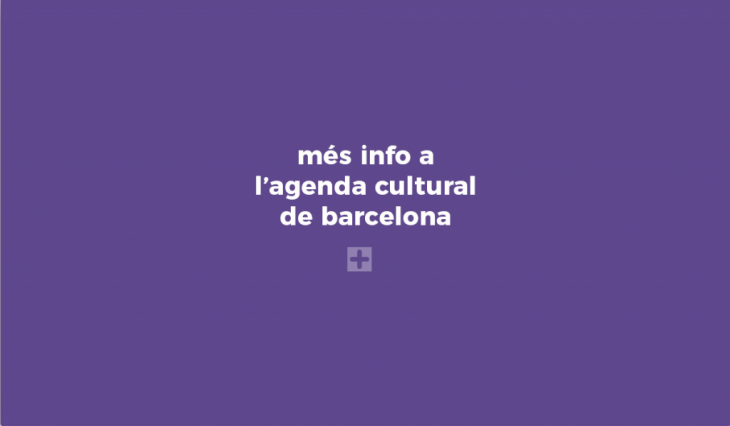
1.Welcome to Barcelona’s cultural agenda. 
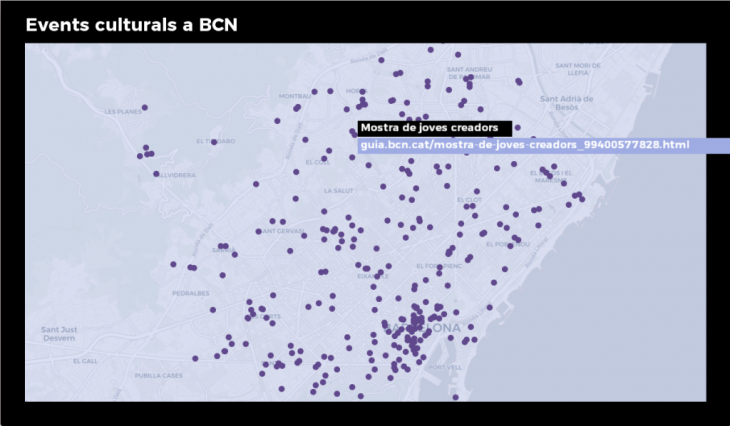
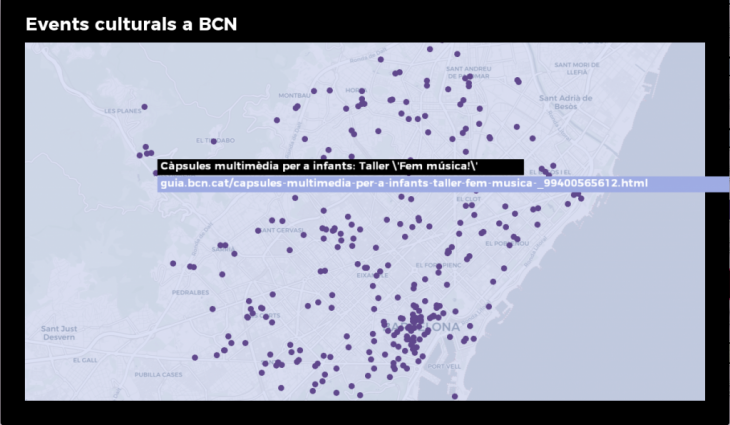
2. Choose which location are you interested in. By hovering, you will find the name of the event and its specific link (next step would be make that link a clickable button that redirects you to the webpage of that link).
3. Get more information on the events by hovering on the ‘+’ button.
Example of reading a xml file for the Data Visualization Workshop (IaaC’s Masters in Advanced Interaction, 2018)
Maria Abou, Martina Solés, Agustina Palazzo
Tutor: David Dalmazzo
