Intro
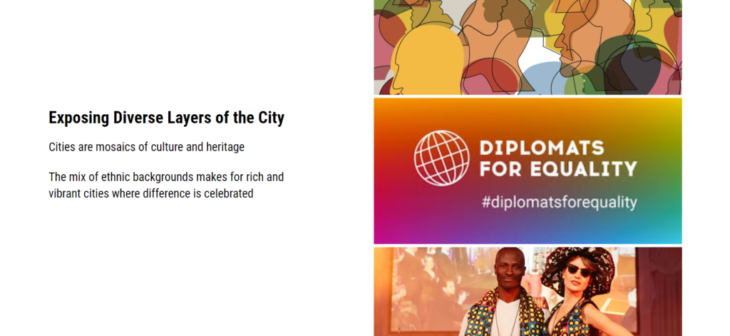
Like many ,major cities around the world, Vienna is fast becoming more and more diverse, and increasingly multicultural; a mosaic of culture and heritage, blending belief systems, habits, cultures, foods and style from all over the world; making for a rich and vibrant city where difference is celebrated
Intro
Problem
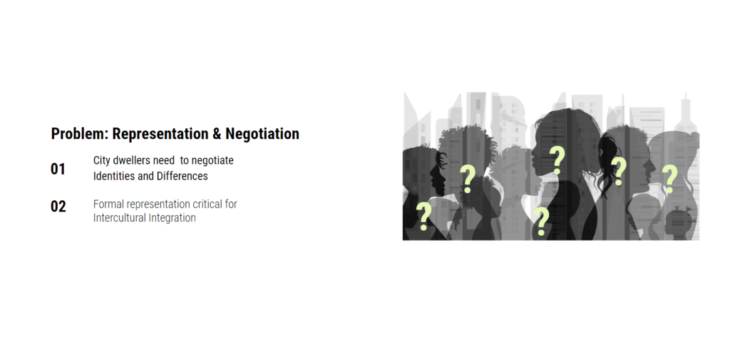
With increasing diversity, city dwellers will have to negotiate identities and their differences such as language, race, class and many other factors important for self identification, forging connection with city on a personal level, and on the macro scale,diversity representation in formal systems need to capture minority groups for intercultural integration, and inclusivity in cities.
Problem
Proposal
Our project tackles this in two scales. First, we map the diversity of Vienna, visually representing the aspect of the city in static layers on a map. Secondly, we provide users with a tool that allows them relatable spaces in the city, based on their profile and preferences.

Proposal
Workflow
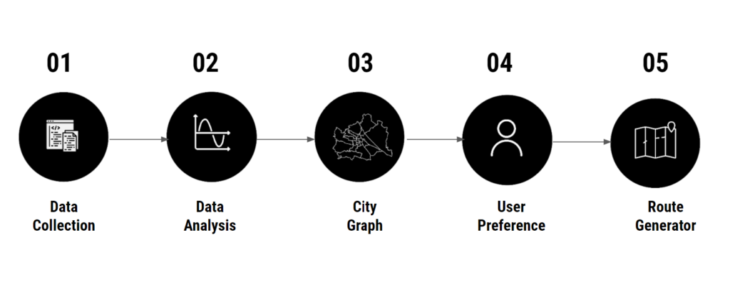
To achieve this, our work flow starts with data collection and analysis, constructing the city graph, getting user preference and the route generator.
Methodology
To expand, we collected data on demographics, used machine learning algorithms to analyze and generate more data, we then assigned weights and points to the city streets and points of interest in the city, for the purpose of finding applicable points of interests and route generation.

Methodology Flowchart
Data
- Population & Demographics
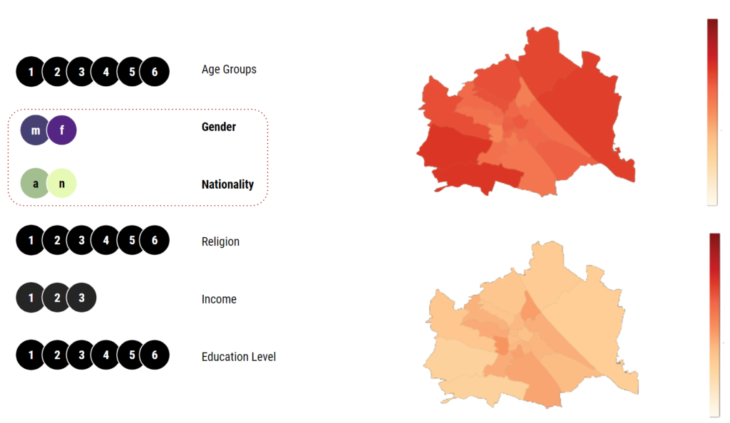
With data collection, started with demographic data available from open gov data. While the information is rich and shows varieties in religion, income, age demographics, there were certain generalizations that excluded minority groups. For example, gender was classified as male and female, and ethnicity was reduced to just Austrian and foreigners. And for that, we looked to alternative means of data.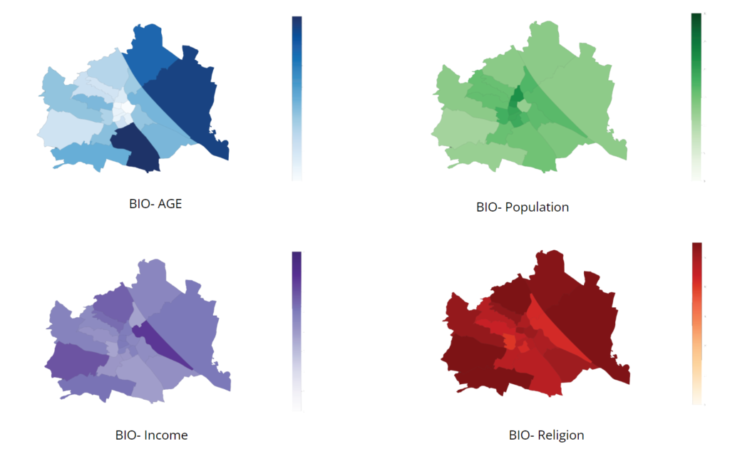
Data- Population & Demographics
- Public Space
Places where people meet and infrastructure serving basic needs are good indicator’s of a city’s multiculturalism. Therefore, we Proceeded To Collect Data On Public And Recreational Establishments, Such As Restaurants, Playgrounds, Sports & Leisure Centers, Etc. We collected data from open street maps and google maps. Here we looked for data that could help classify points of interests according to how friendly they are to different groups. We collected data of a total of 6800 points of interests. We collected data from open street maps and google maps. Here we looked for data that could help classify points of interests according to how friendly they are to different groups. We collected data of a total of 6800 points of interests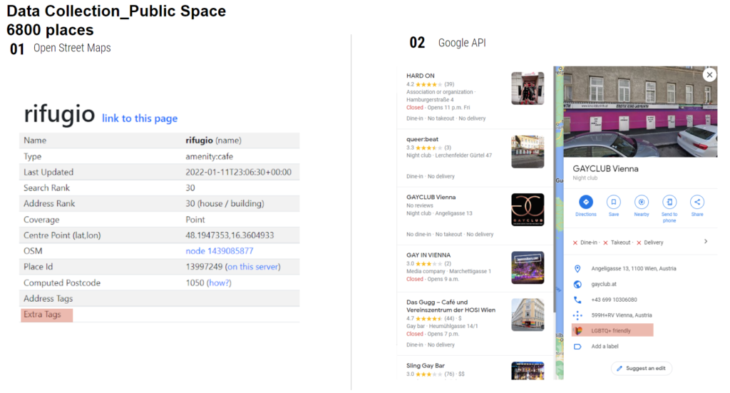
Data- Public Space
- Recreational Spaces
We wanted to see different age friendliness, gender and ethnicity and restaurants that respect dietary preferences of different religious groups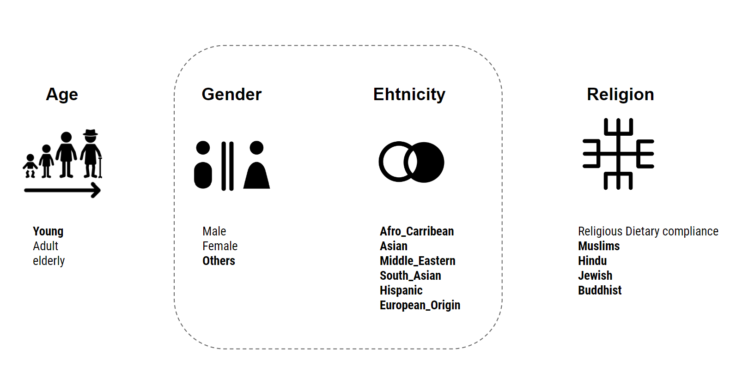
Data- Recreational Spaces
- Ethnicity
From the data collected, we analyzed for ethnic diversity, for six ethnic groups, classified along geographic location or origin. Using Hill’s diversity formula, we calculated the diversity index with sensitivity to the predominant population. We see that the 9th district is most ethnically diverse, with a mix of trendy spots, international schools, and culture on every corner. And the 13th district, which is a residential, upper-class district with a lot of elderly people.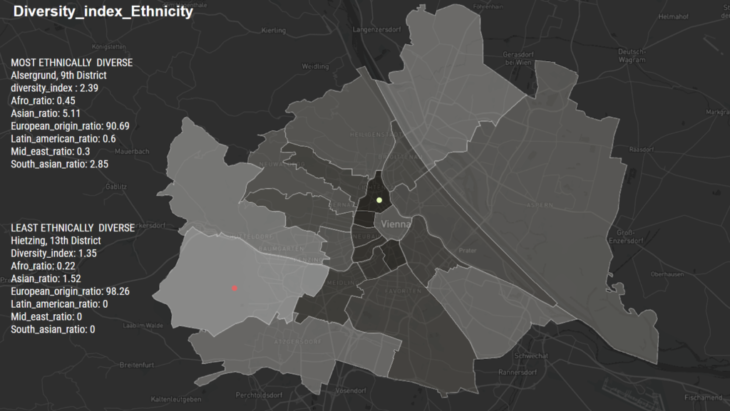
Data- Ethnicity
Looking into the different groups, we see the Afro Caribbean community are least abundant immigrant group, while the Asian is the most abundant.
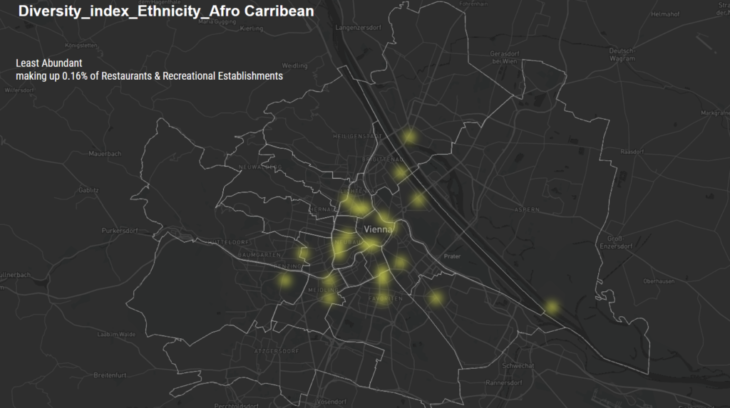
Data- Ethnicity Afro Carribean
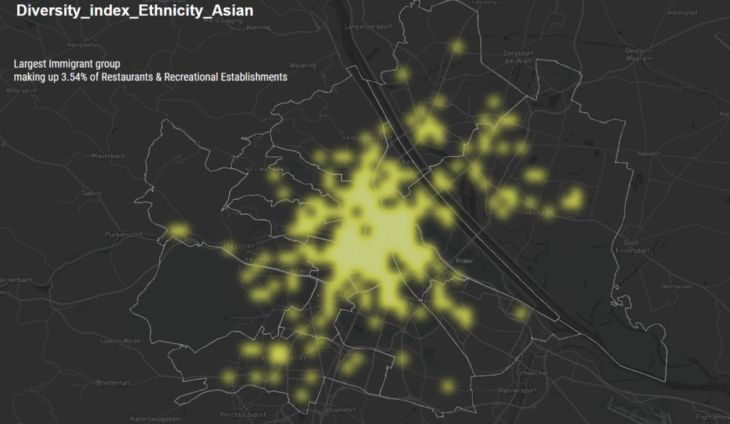
Data- Ethnicity Asian
AI
Our integration of AI was to extract more generic forms of data…data that isn’t as direct in nature, more perceptual.
Data- Public Space
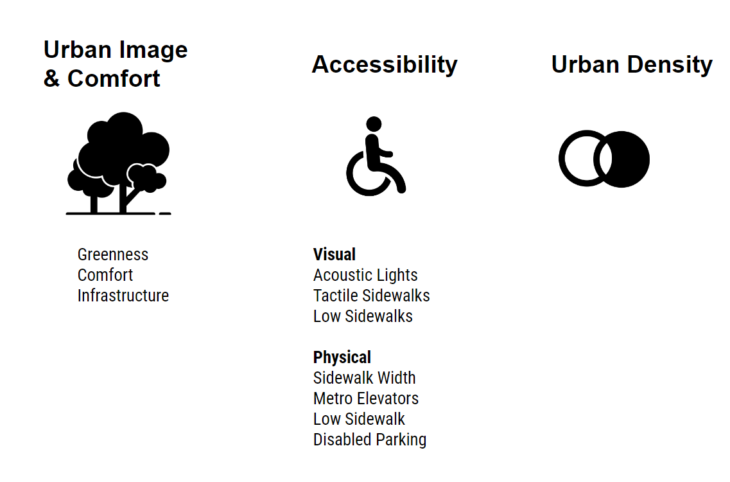
For the more spatial aspects of the city, diversity takes form in greenness, public perception and accessibility.
Data Collection & Analysis
We analyzed some street view image datasets, segmented them and measured their specific pixel count to measure a certain metric.
Kappa – In the case of urban density, it was calculated by the amount of perception covered by infrastructure. Our primary dataset was a. The official city’s open data website kappazunder data.
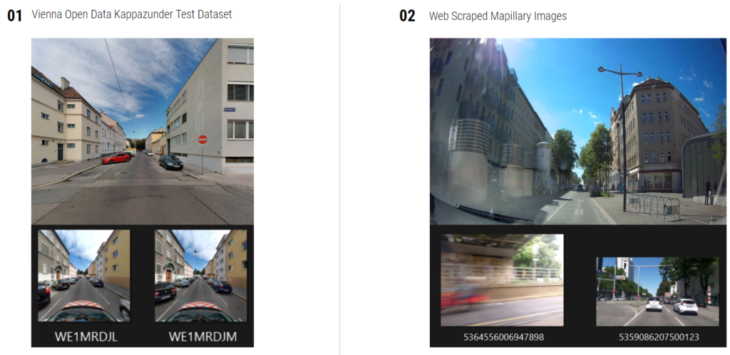
Urban Image Dataset
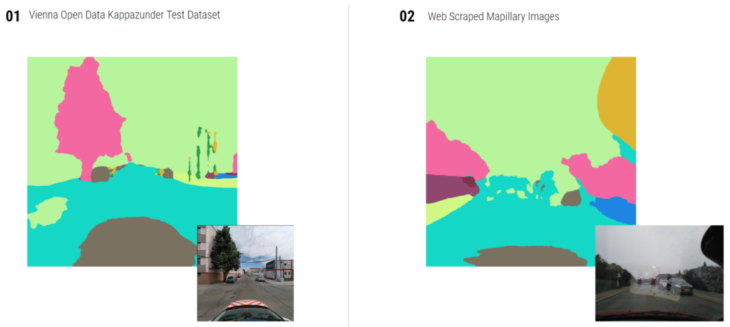
Urban Image Segmentation
Although we did try segmenting them both for the sake of comparison. Segmentation was performed on pretrained AI model called PSPNet, finetuned on a cityscapes data, but would’ve needed some more training had time permitted.
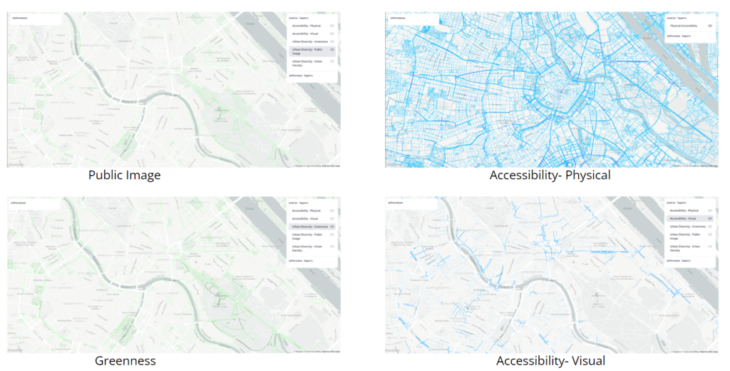
We were able to map out the percentage scores on the city. As part of our static/analytical layers, but also influence the route.
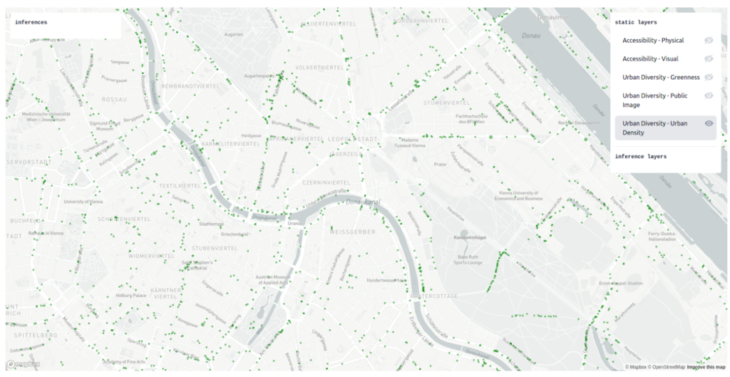
Urban Density
User Experiences
In the last section, we will demonstrate user experiences. Have fun!
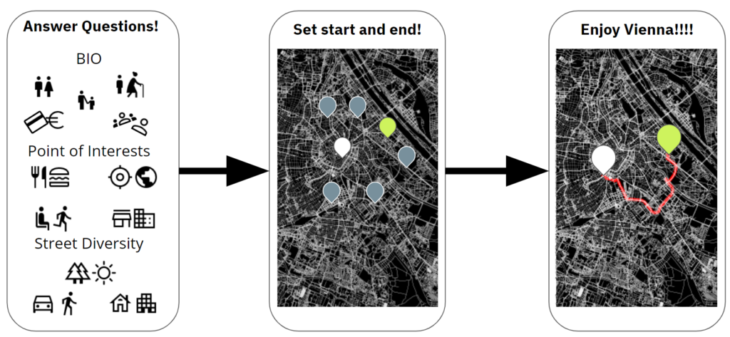
With A.EYE, You can find yourself within Vienna as a route which matching your preferences and diversity of Vienna. It takes only 3 steps. Answer simple questions, set start and end points, and boom, you can enjoy Vienna matched to your preferences.
Usage of the project
Let’s go through our project with Takeaki! These are his inputs for BIO.
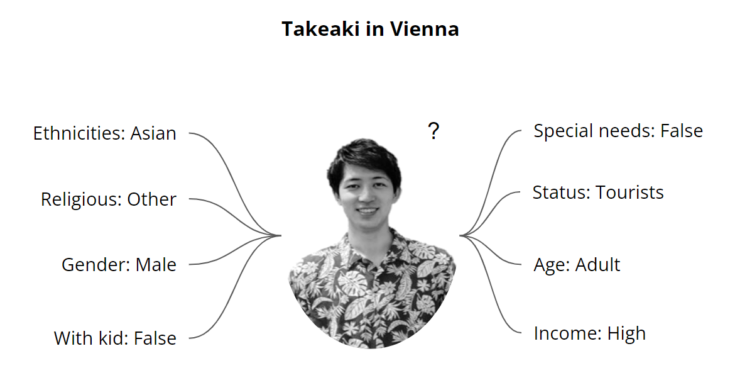
BIO
And then with the slider inputs for Point of Interests, A.EYE present some points related to my preferences.
He found this Asian restaurant within Vienna, 4.4 stars hmmm.. He will pick this point as the end point!!
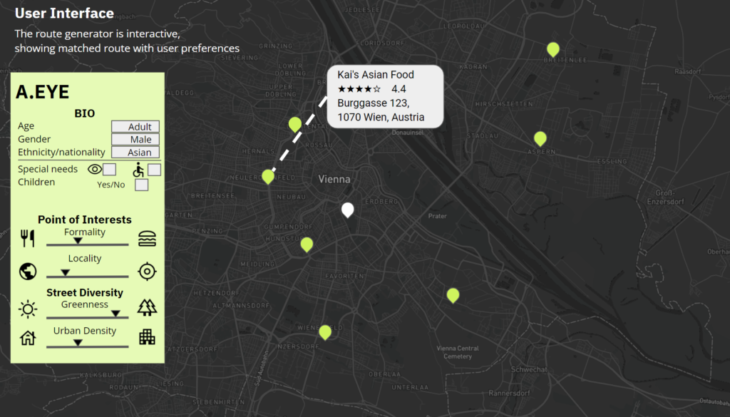
POI Selection
Once he clicks the restaurant and select it as the end point. He will get this route which considering all the information from slider inputs for Street diversity as well.
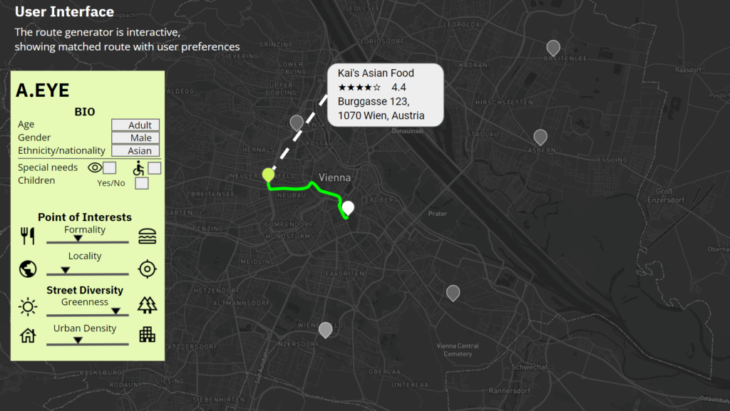
Route Generation
As you can see in this google street view, a street within route has many trees and less urban density as he selected with slider!

Route Example
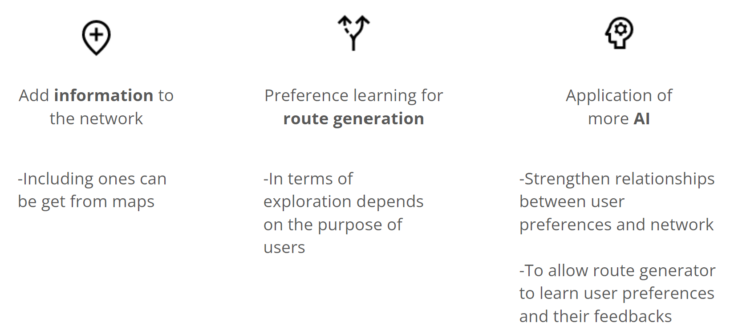
Further Potentials
For further potentials, we could add more information to the network to improve our route generator. User could get a route for one-day tour around the city. These methods can be improved by applying more AI including preference learning by user feedbacks.
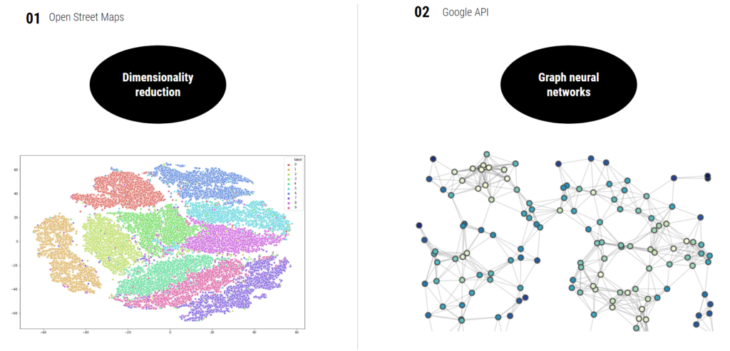
To effectively incorporate ‘diversity’, a few other improvisations like dimensionality reduction for polar opposite images to relate to User preferences, and a graph neural network methodology that would attribute the nodes such a way so as to process the route would be approached, if we can.
Further Potentials
Further AI

A.EYE is a project of IAAC, Institute for Advanced Architecture of Catalonia developed in the Master of Advanced Computation in Architecture and Design 2021/22 by Students: Oluwadamilola Akinniyi, Takeaki Sakakibara, Maryam Deshmukh and Hanna Lakk Faculty: Angelos Chronis, Faculty assistant: Aleksander Jastrzebska, Serjoscha Duering and Nariddh Khean