Data Workflows: Stalking Classmates
Introduction:
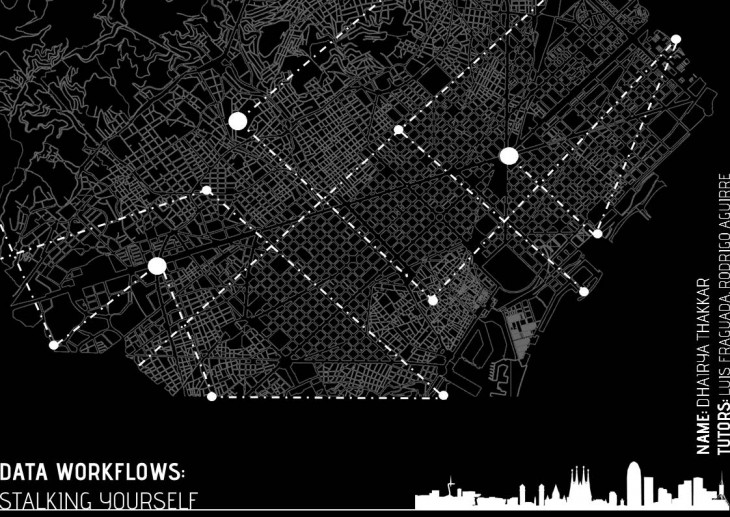
Today, most of us have access to a device that is capable of tracking movement through GPS. While the data which results is of a very simple nature (latitude, longitude), there is a lot to discern about where we spend our time, how we get to places, and even perhaps, places we go that we’d rather keep secret.
Procedure:
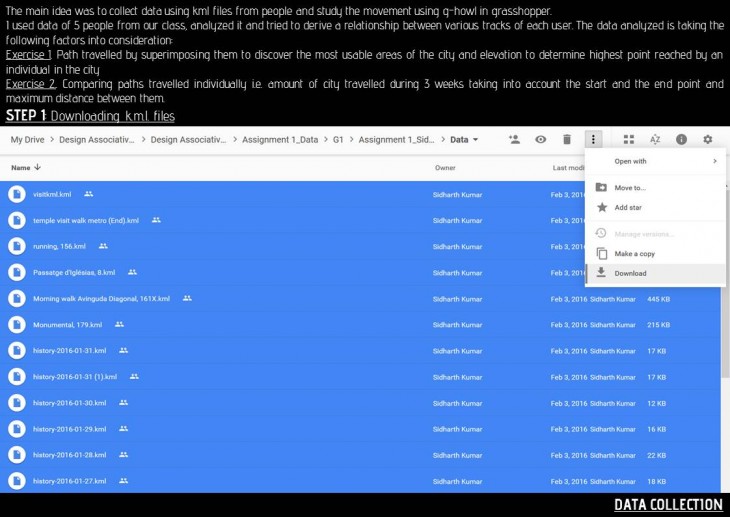
- A GPS tracking application (preferably which gives .kml, .tcx, .kmz format) – My Tracks was installed in the phone which gave files in .kml format
- Once installed and verified that the app is working, I started recording myself switching on the application as and when I left my house. This data was collected over a period of 15 days. Once this was done we were asked to exchange files and use people’s data to generate a visualization. I collected data of 5 of my classmates in order to get a systematic and relevant data.
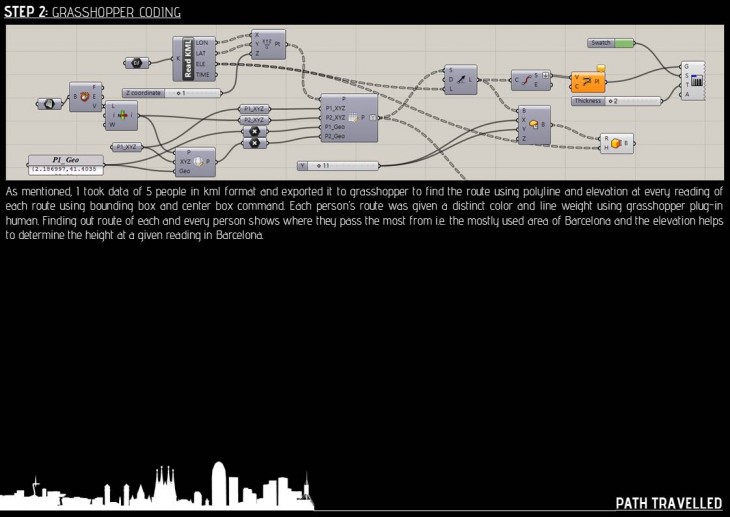
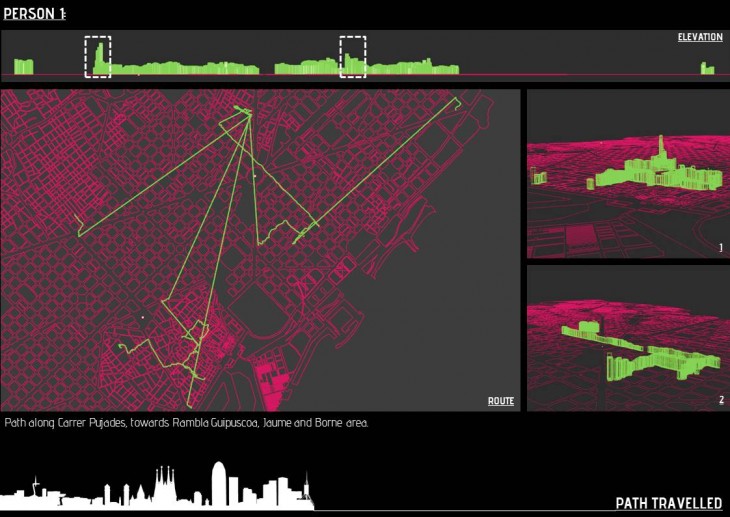
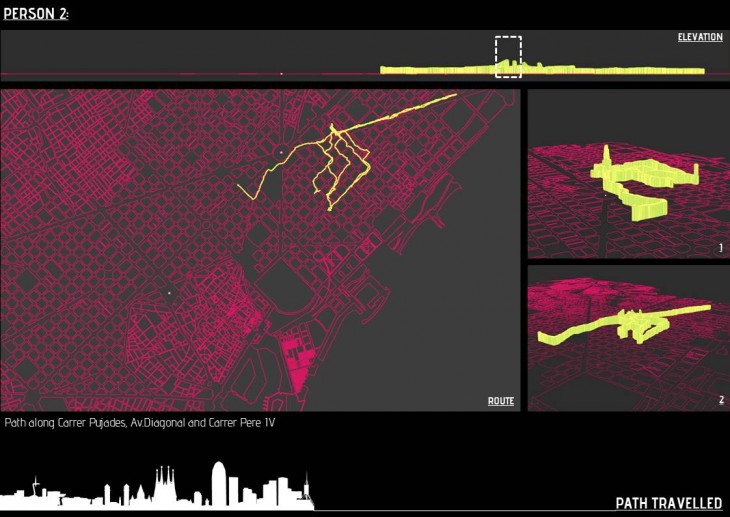
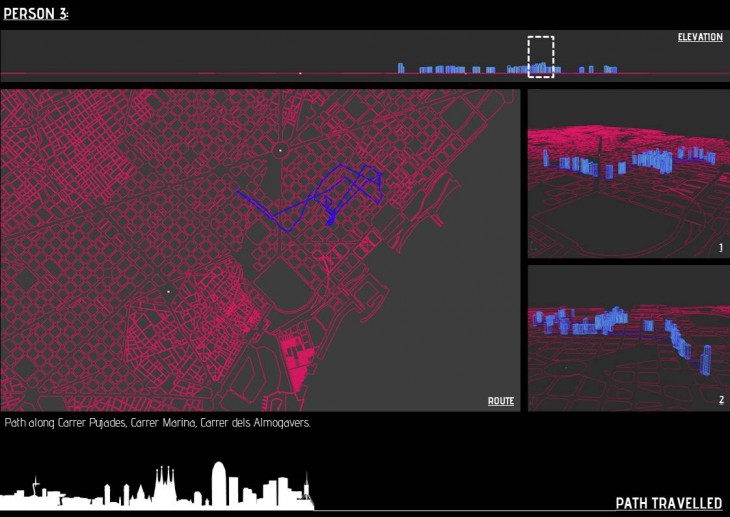
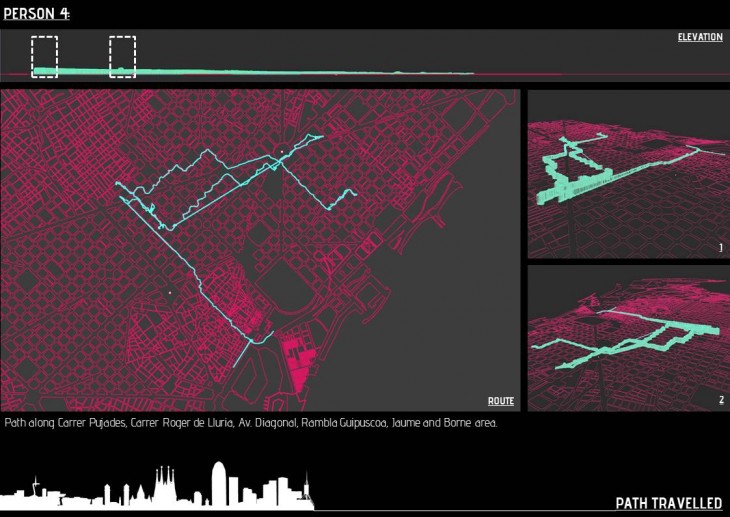
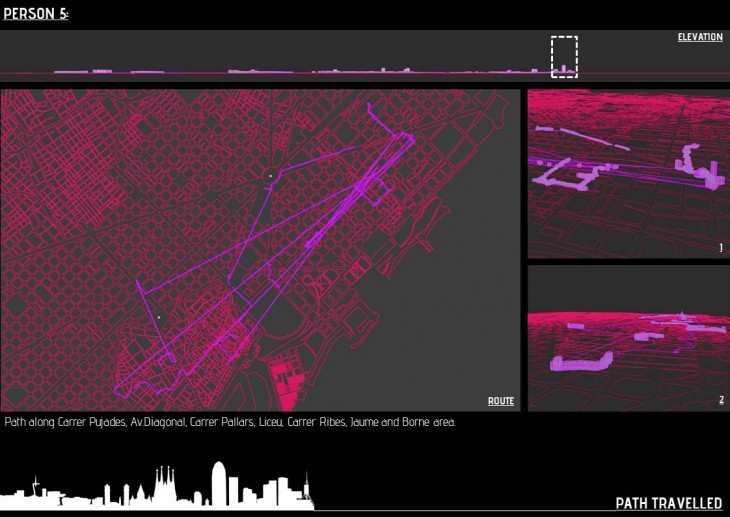
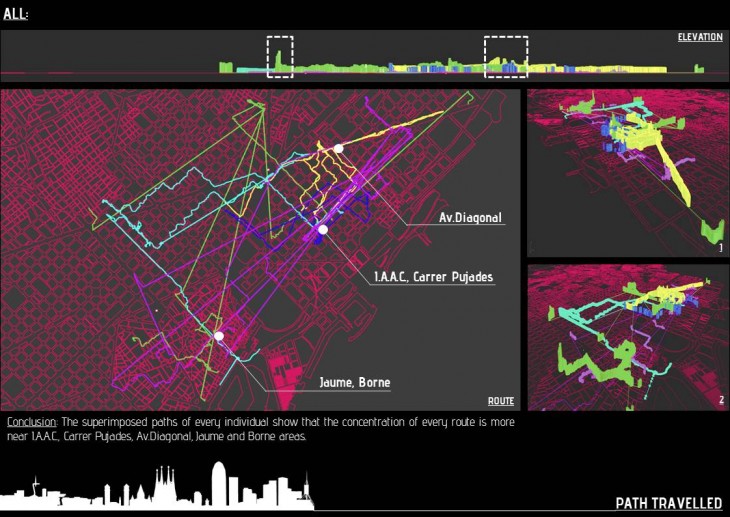
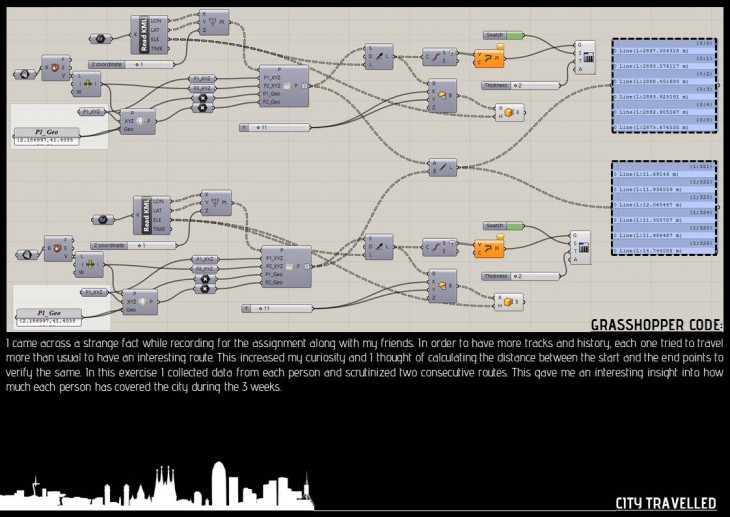
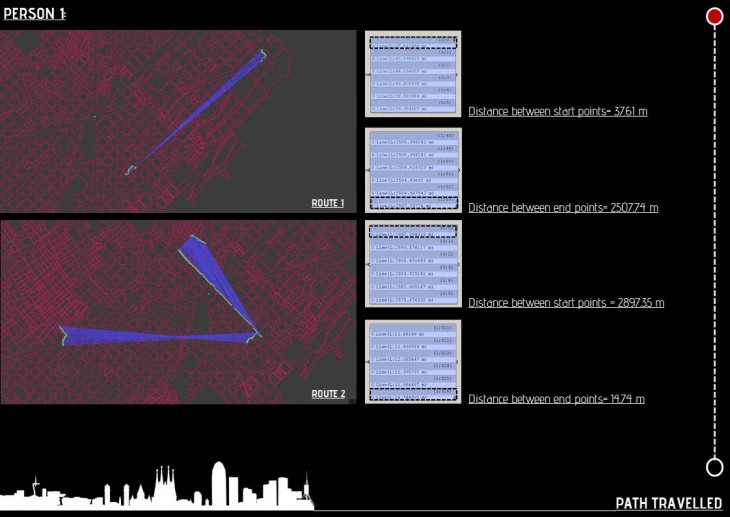
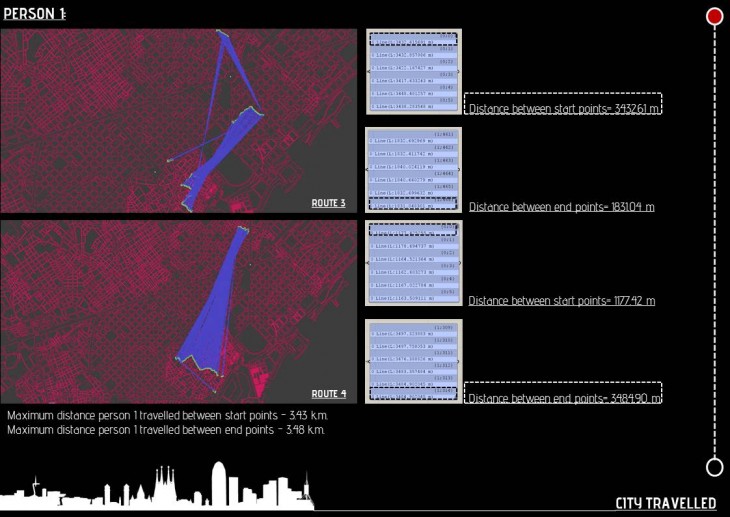
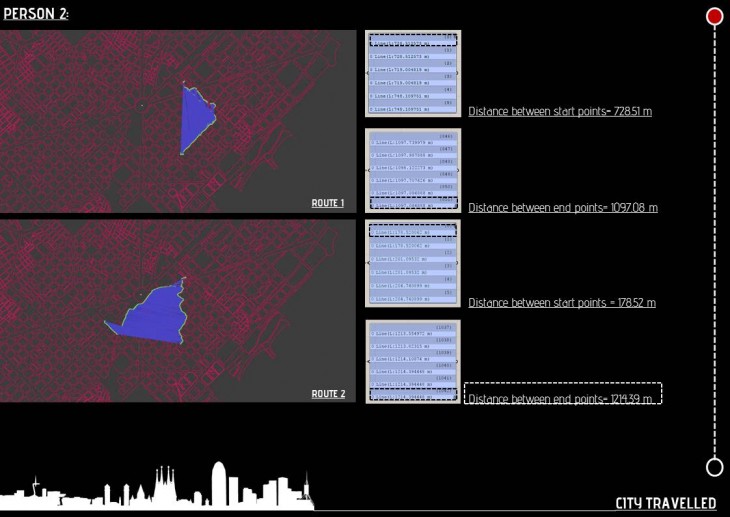
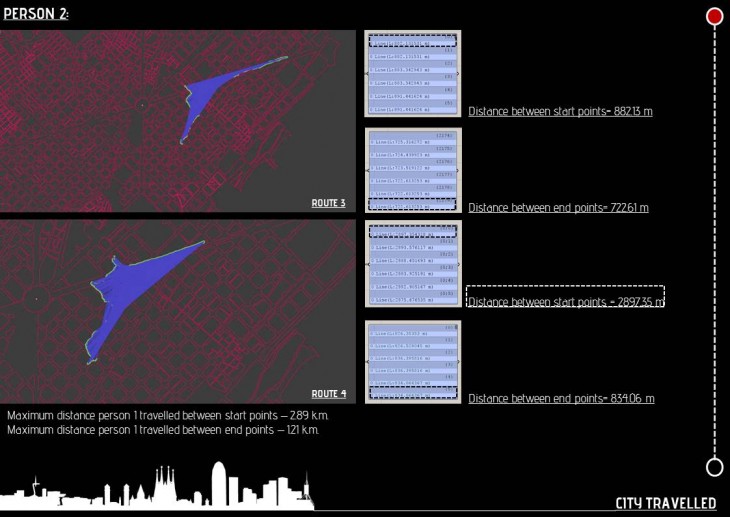
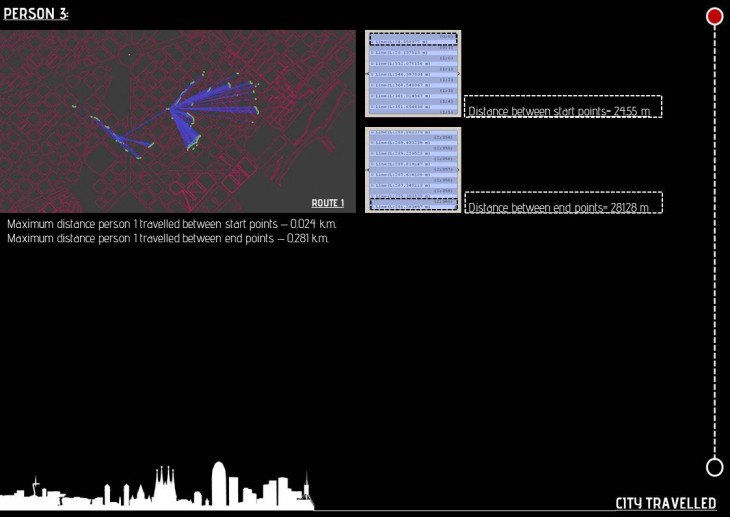
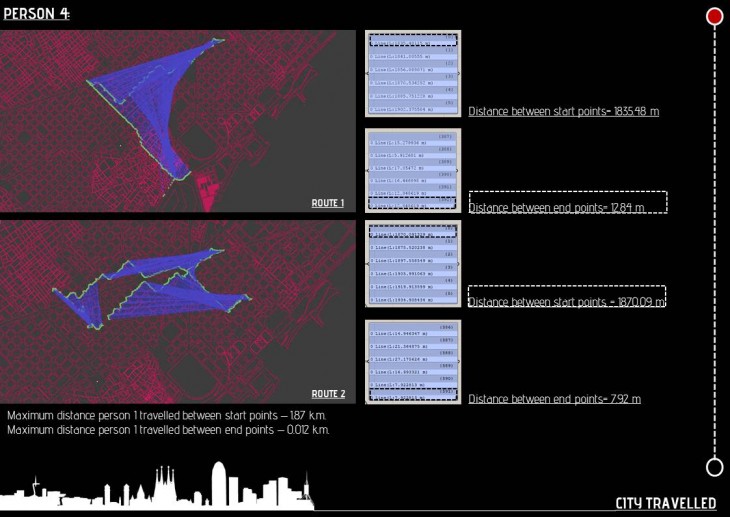
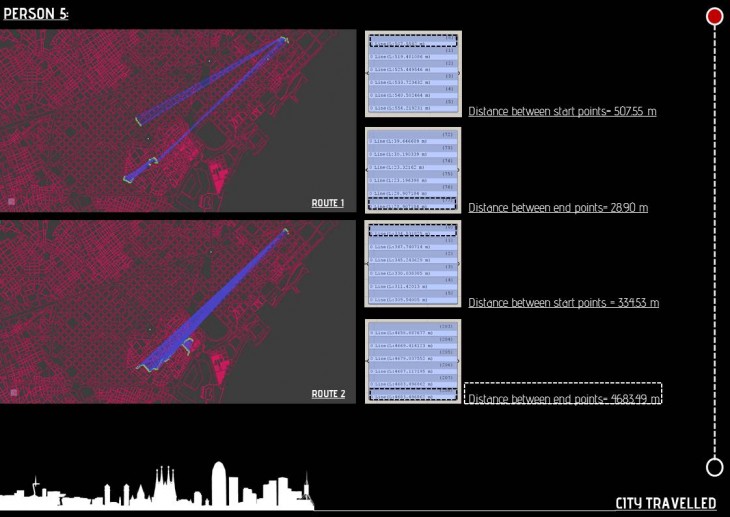
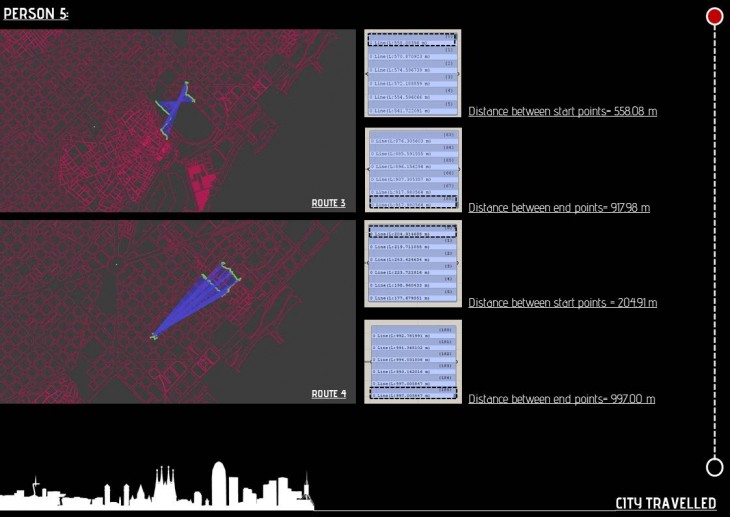
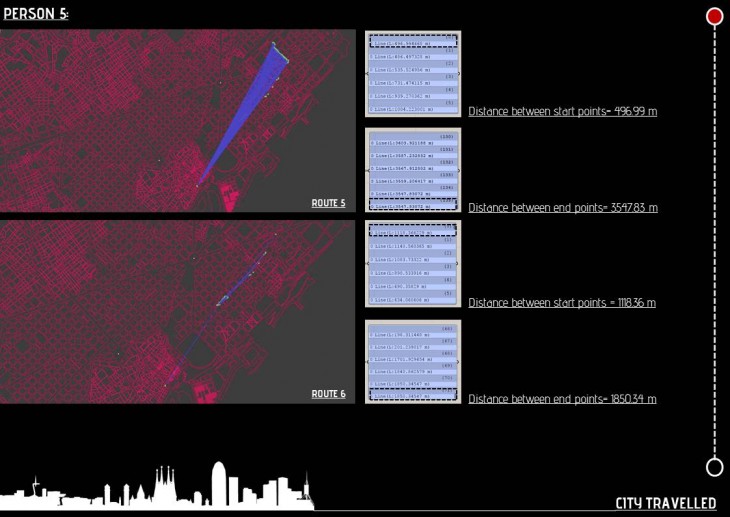
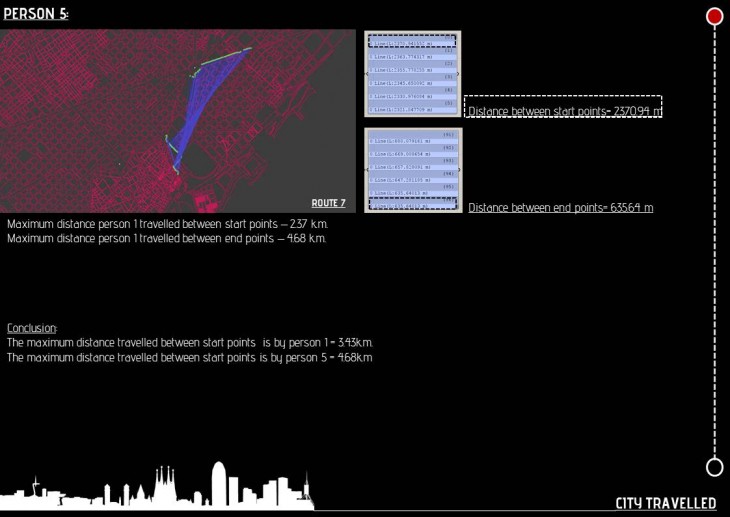
- The GPS data was exported to Grasshopper to generate a visualization with the data obtained of 5 of my classmates. An attempt was made to show how time is spent in specific places, correlations in crossed paths, path traveled to generate data on My Tracks is shown in the presentation.
Conclusion:
With the use of latest android applications and computational tools, interesting and meaningful visualizations can be generated by superimposing data.
Computational design: Data workflows is a project of IaaC, Institute for Advanced Architecture of Catalonia developed at Master of Advanced Architecture in 2015/16 by:
Student:
- Dhairya Thakkar
Faculty:
- Luis Fraguda
- Rodrigo Aguirre