In the spirit of “the year in review”, this post examines the year 2017 in regards to movies. What time of the year are movies most produced? What countries have the most influence on movie entertainment? What genres are the most created? The answers to such questions are sought here through data analysis.

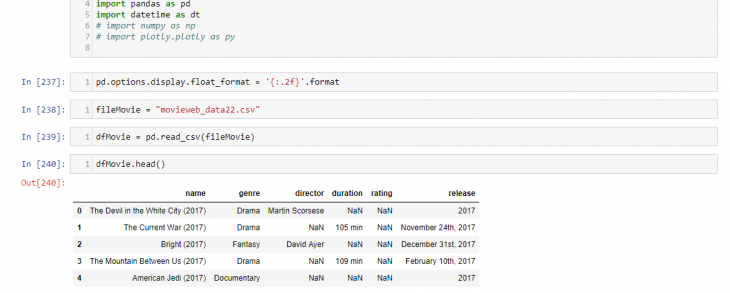
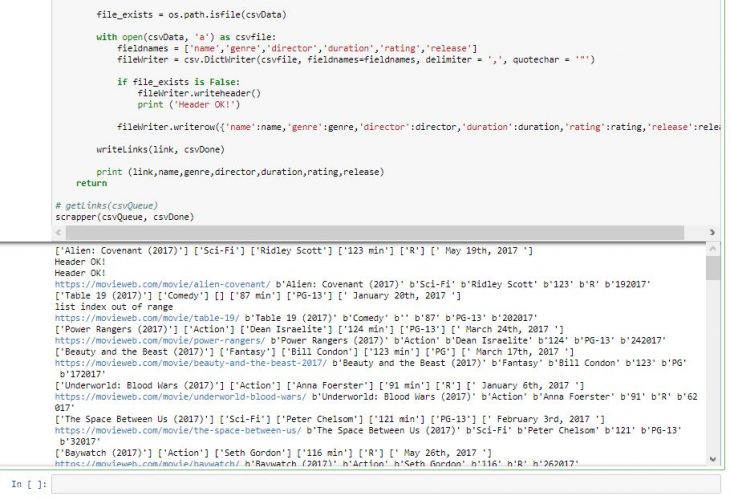
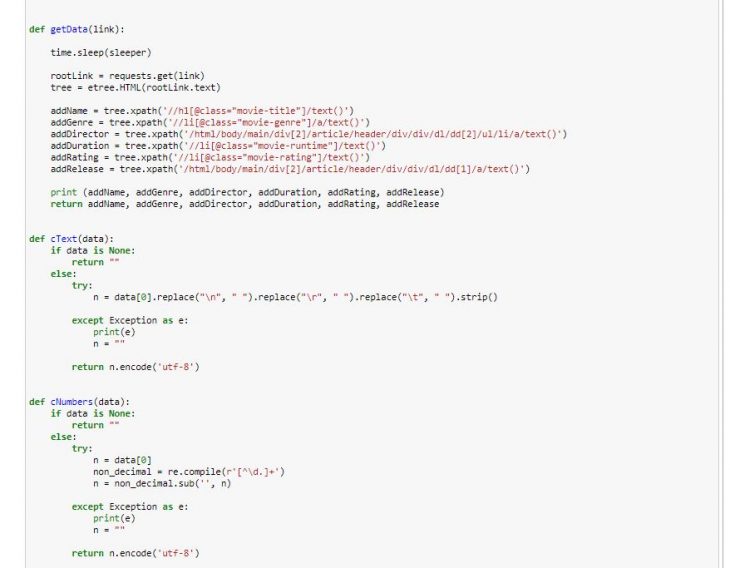
A popular movie viewing website was scrapped to get a list of links to movies created in 2017, including details of each movie such as; viewing rating, genre, release date, director, and duration. The scraped data was then converted to a csv and using pandas, visual illustrations were created to show the relationship between different variables.
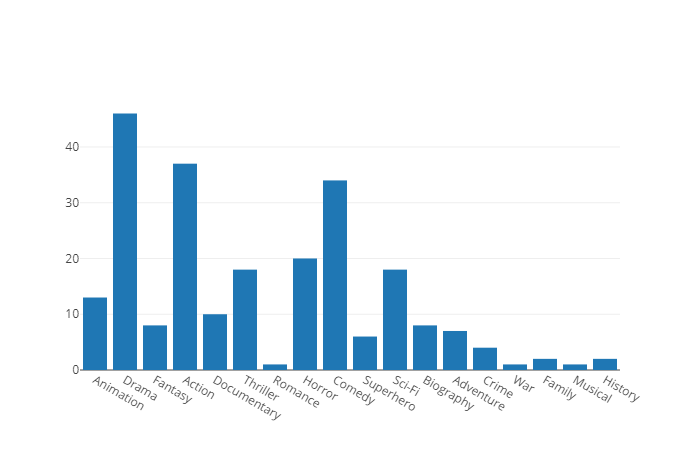
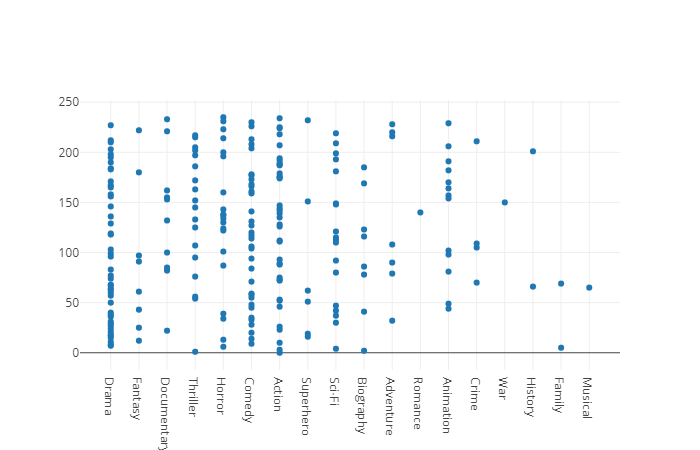
This chart shows Drama as the most produced genre with about 46 movies out of the 236 top movies scraped.
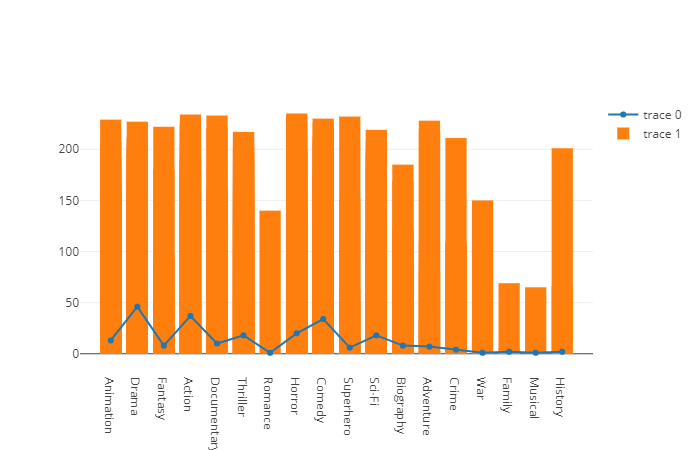
The chart below shows the duration of the 18 top genres. Action and Horror movies seem to span the longest.
The bar chart (trace 1), illustrates the relationship between genre and duration as above, while the scatter line graph shows the amount of movies to genre (trace 0) as in the first chart.
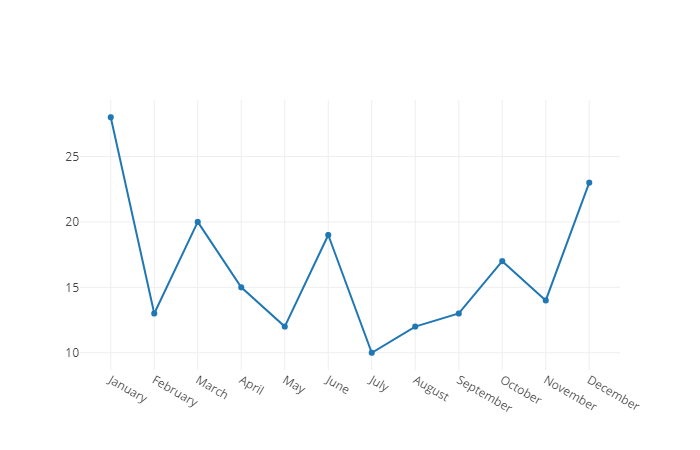
The scatter diagram below shows the months with the most releases. January and December come out on top, with July as the month with the least produced movies in 2017.
2017 IN MOVIES is a project of IAAC, Institute for Advanced Architecture of Catalonia, developed at MaCT (Master in City & Technology),
2017-18 by:
Students: Venessa Williams
Faculty: Andre Resende
2017-18 by:
Students: Venessa Williams
Faculty: Andre Resende