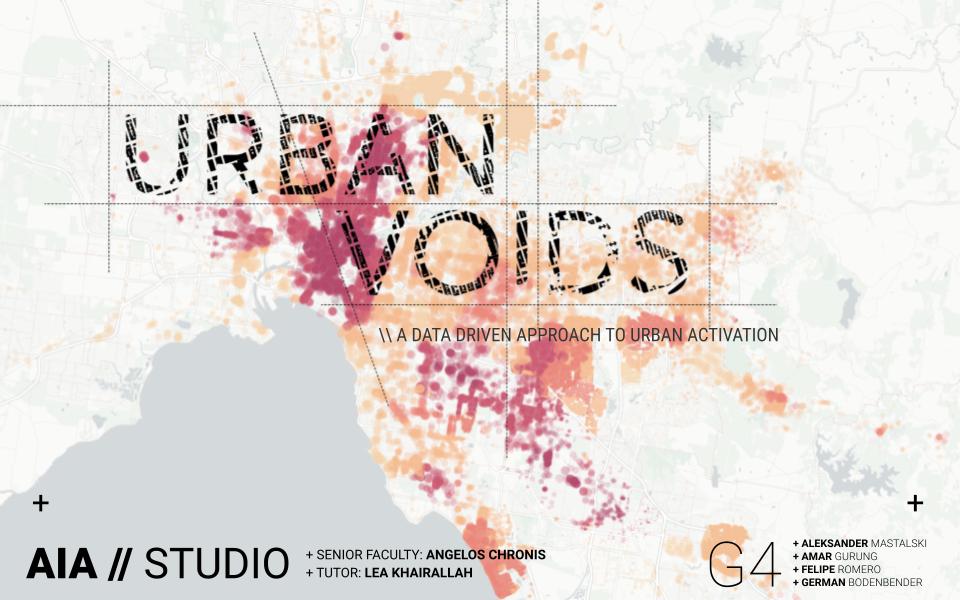
//URBAN VOIDS
Link to website
//Abstract
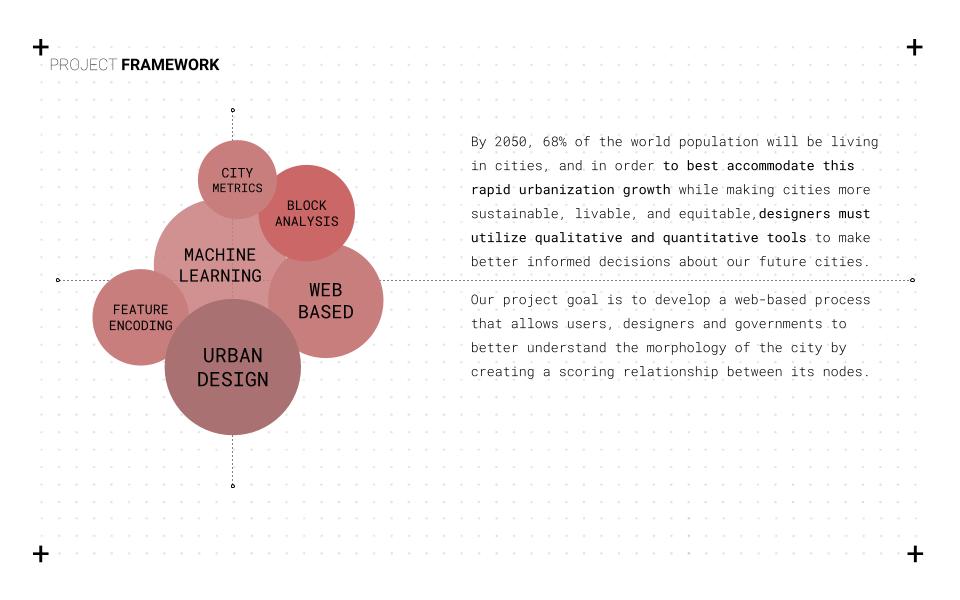
Big urban data now being easily available online, there is an opportunity to utilise this information to generate new relationships between various features within the urban fabric. This new information will be useful not only to architects and developers but also to any individual or institutions looking to understand the urban features whether it is to set up a new cafe, particular shop, housing, school or a clinic. Urban Voids is a data-driven approach to analyse and predict potential locations for the addition/intervention of amenities within the city. The predictions and scores are based on a series of urban analyses, simulations and the use of KMeans clustering. The aim is to create a tool that will work on a feedback loop system where the information is constantly being updated. At the back end, there are the various analysis, simulations and clusterings, the results from this are then being visualised in a web-based platform (Mapbox) and to complete the loop, the user inputs a new location and amenity type to generate a new prediction and scoring for the new information
//Project Methodology
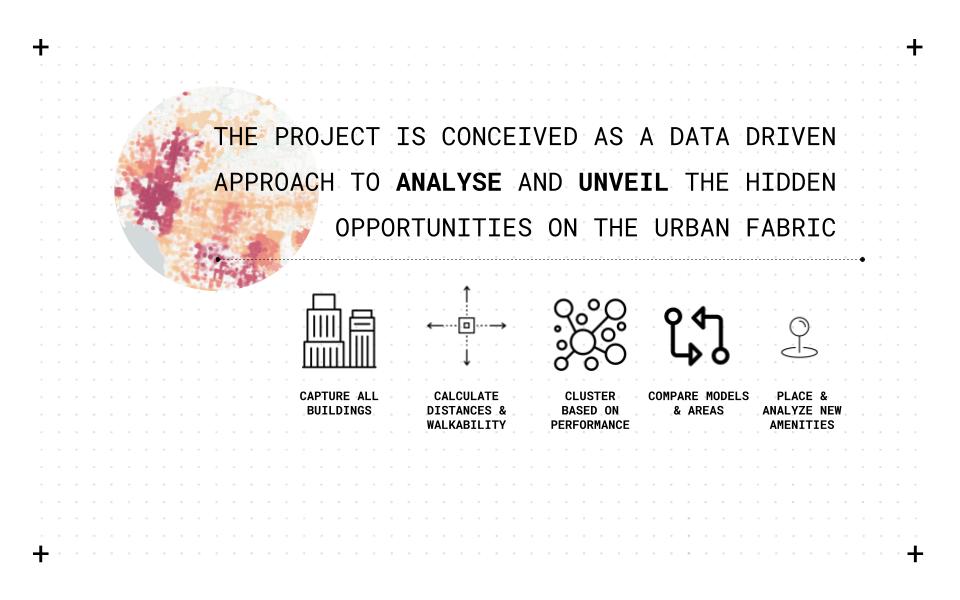
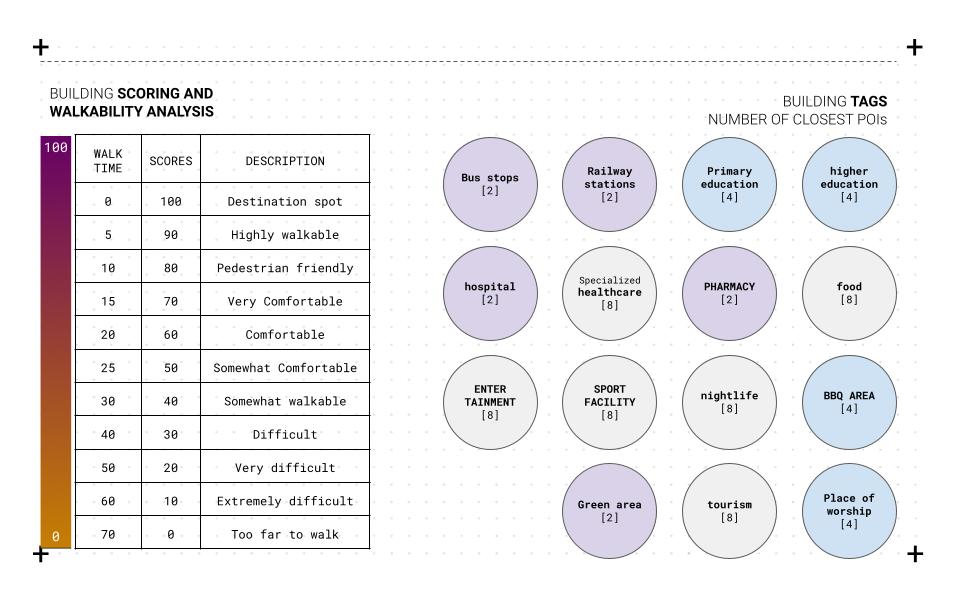
The project is conceived as a data-driven approach to analyze and unveil the hidden opportunities on the urban fabric by capturing all buildings, calculating distances and walkability, clustering based on performance, comparing models/areas, placing and analyzing new amenities. The first step is collecting data from open street maps OSM into a CSV file to calculate walkability scores using python. The second step is to cluster all different scores gathered from python and networkX to be later visualized within a web interface. The final step is the user input, whether it’s a location or amenity type that will feed into the database that will recalculate the scores resulting in a new score and clustering based on the new input.
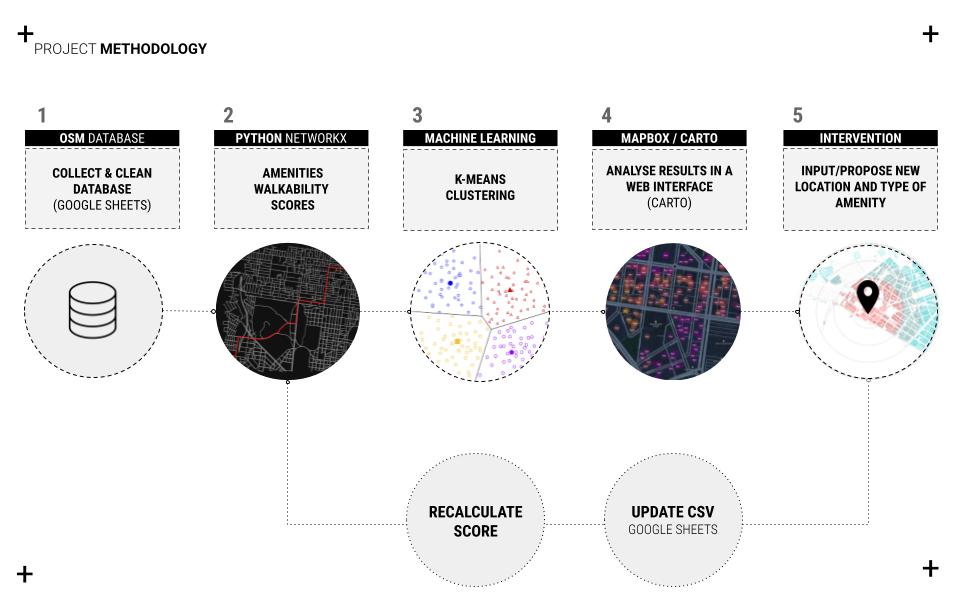
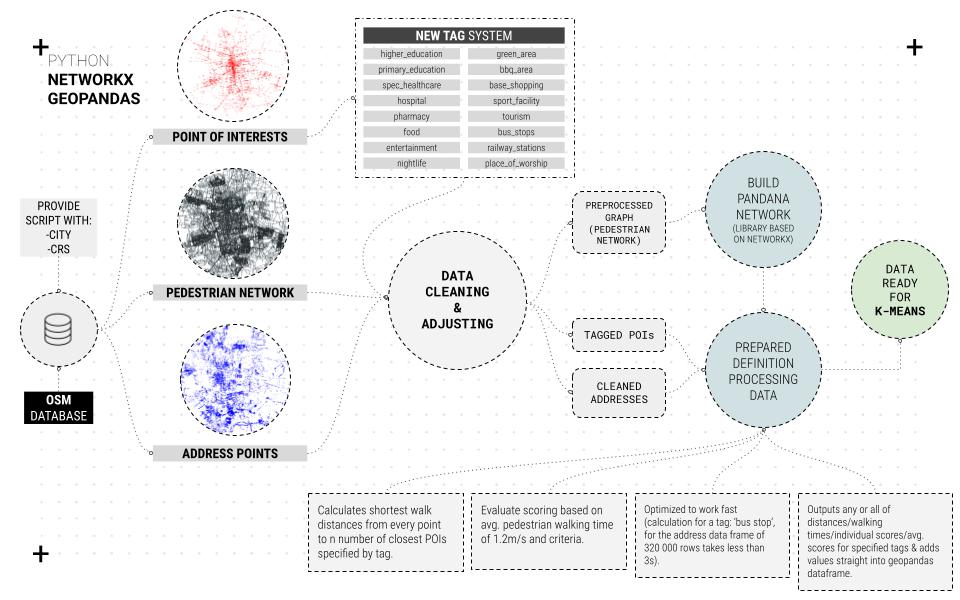
//Dataset Creation / Extracting/compiling/ clustering
For the reliability and efficiency of the process, python and OSMX libraries are used to extract the data from open street maps to provide the script with the city-CRS, which extracts three main data frames, points of interest, pedestrian network, and address points. After that, cleaning and adjusting the data that is used for K-Means clustering
//Machine Learning / K-means clustering
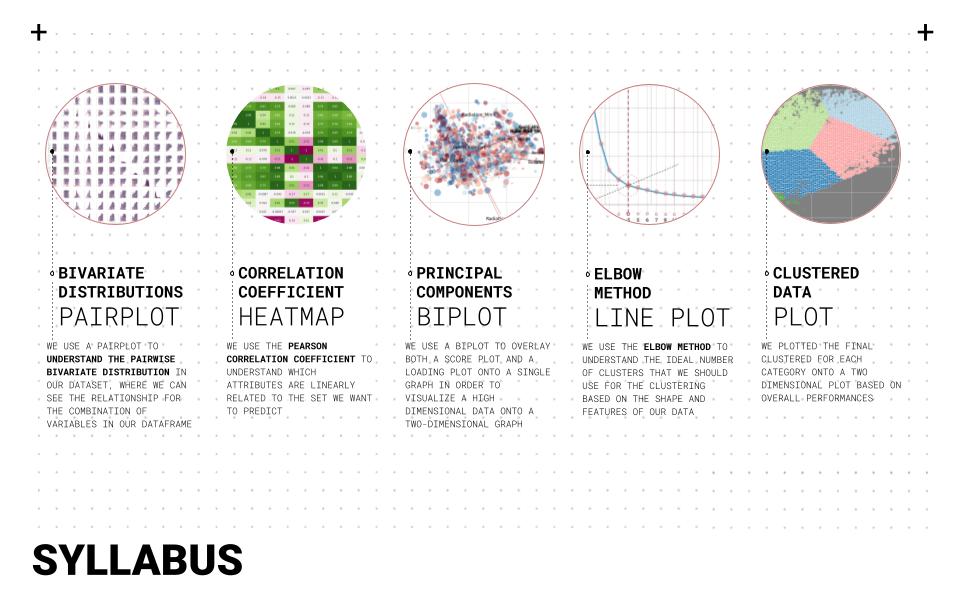
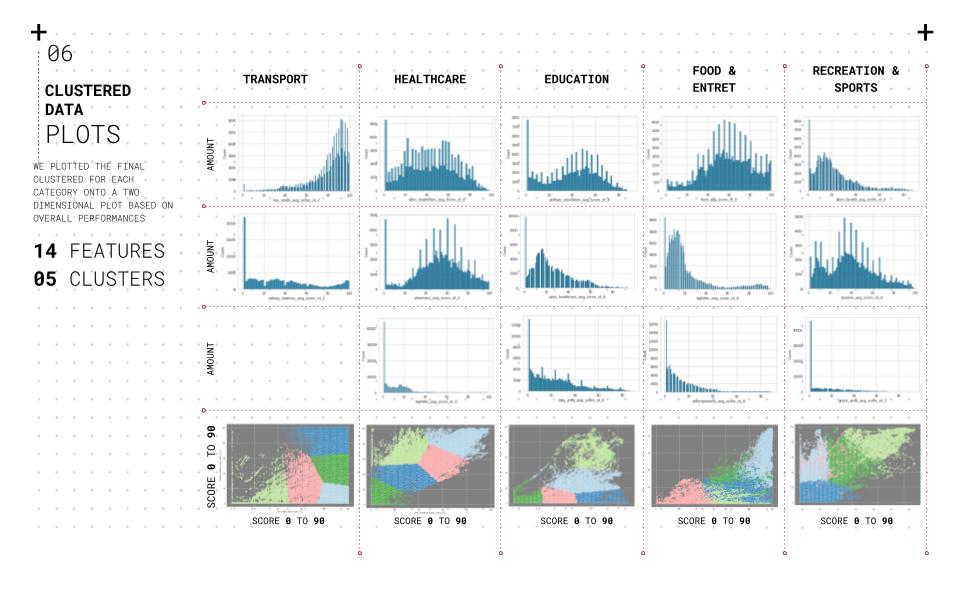
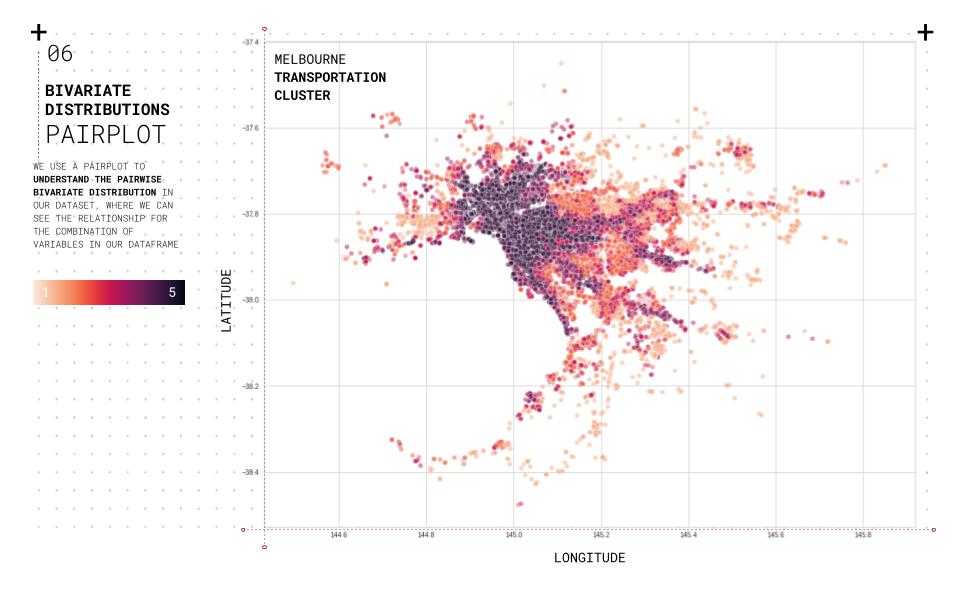
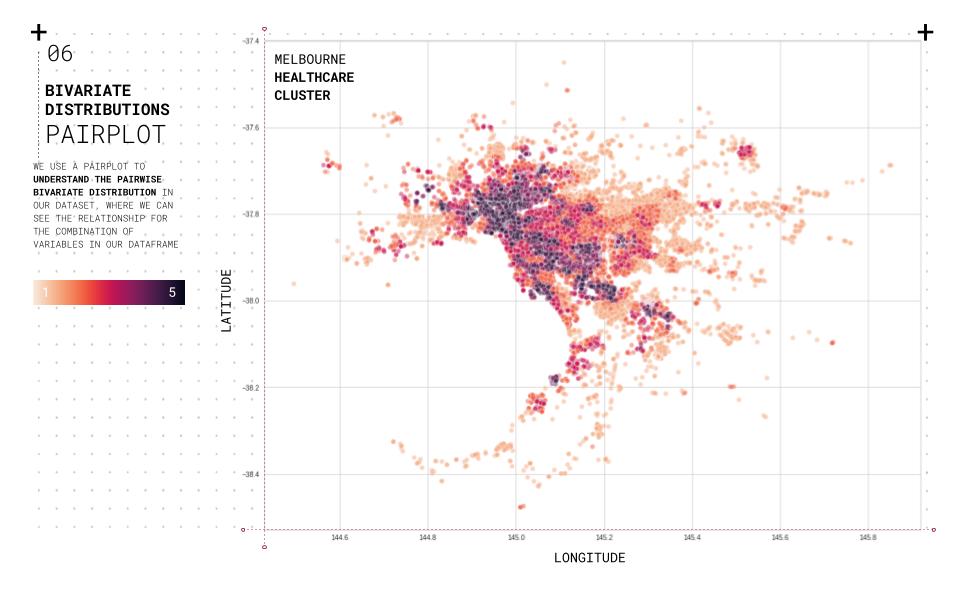
We use a pair plot to understand the pairwise bivariate distribution in our dataset to understand the data and their relationships. The relationship between the combination of variables in our data frame is straightforward. In addition, the Pearson correlation coefficient is used to understand which attributes are linearly related to the predicted set. Also, a biplot is used to overlay both a score plot and a loading plot onto a single graph to visualize high dimensional data onto a two-dimensional graph. Using the elbow method to understand the ideal number of clusters that should be used for the clustering based on the shape and features of the data. The final clustering is plotted for each category onto a two-dimensional plot based on overall performance.

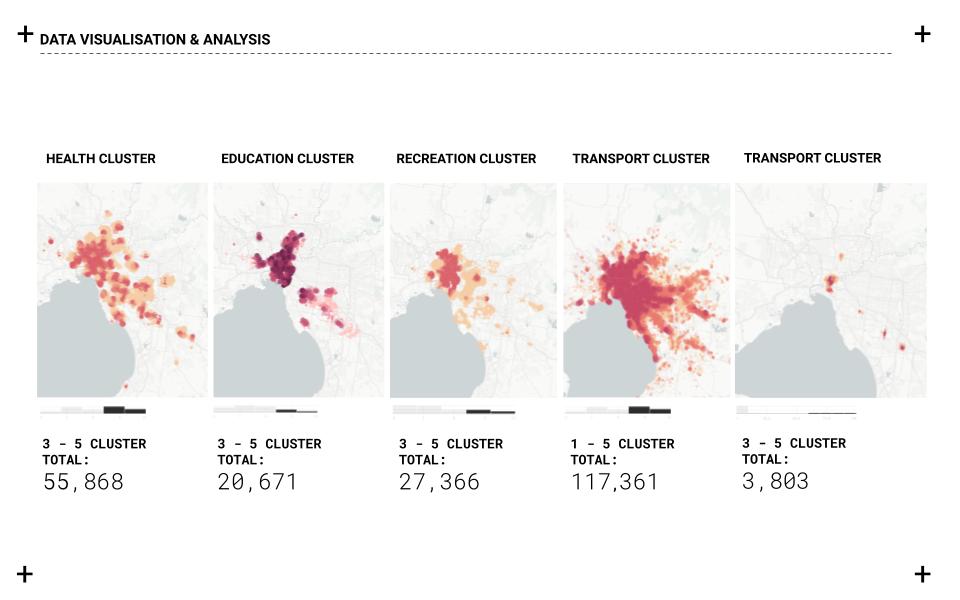
//K- MEANS CLUSTERS


//DATA VISUALISATION
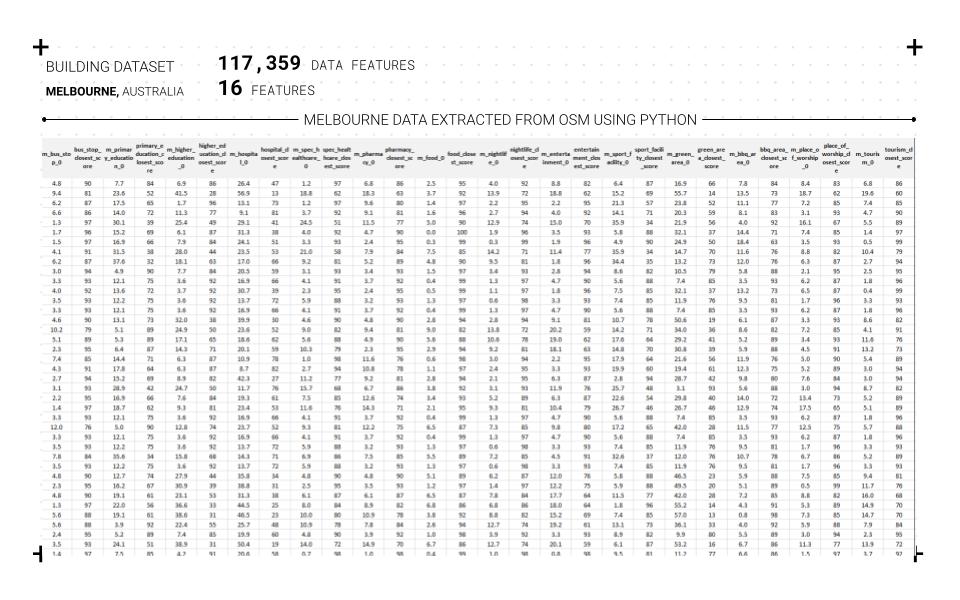
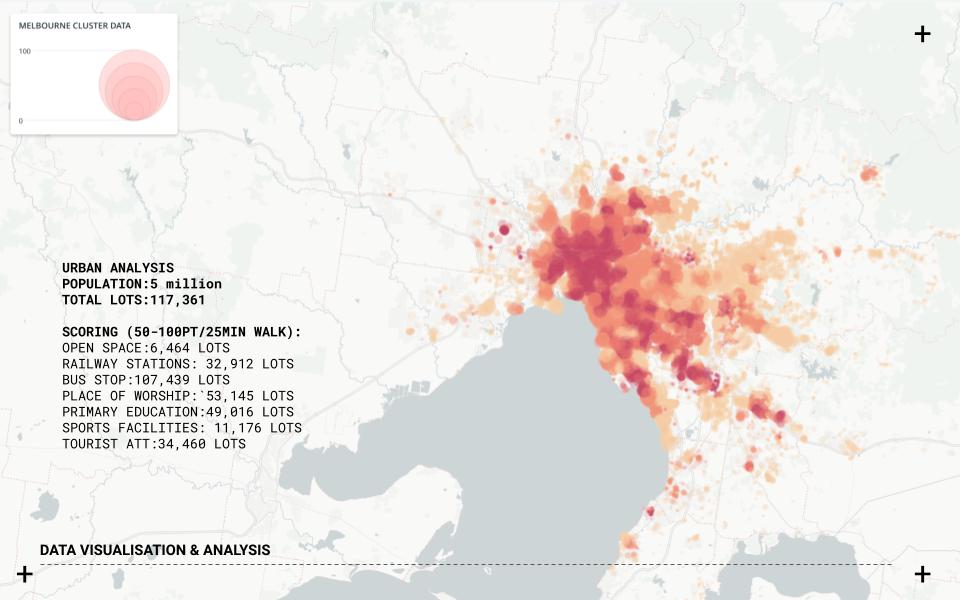
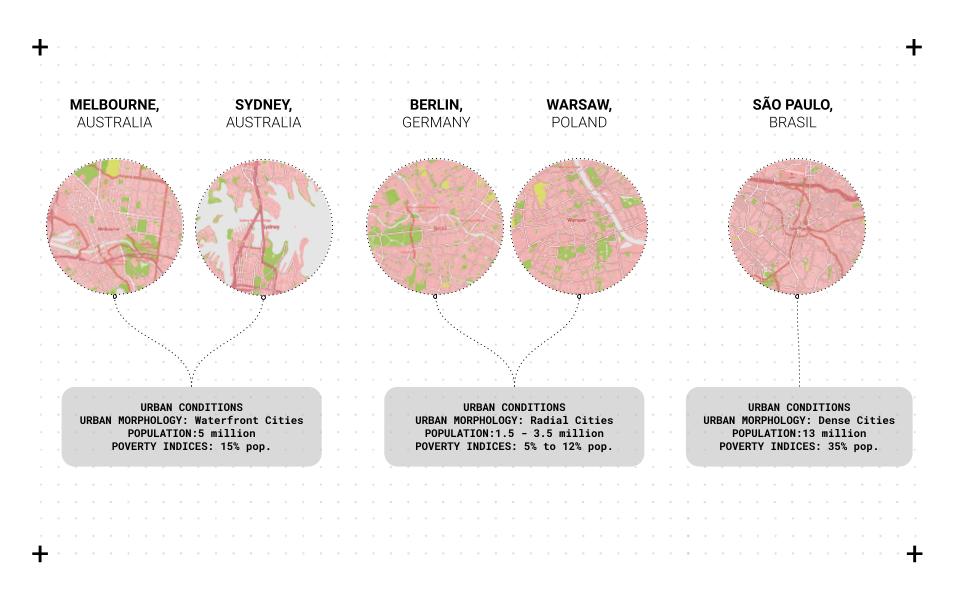
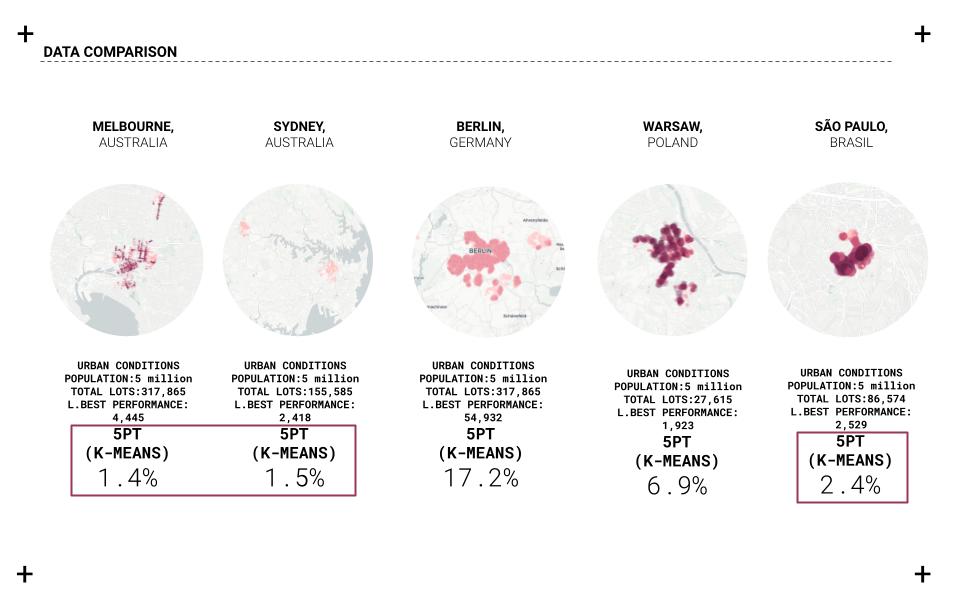
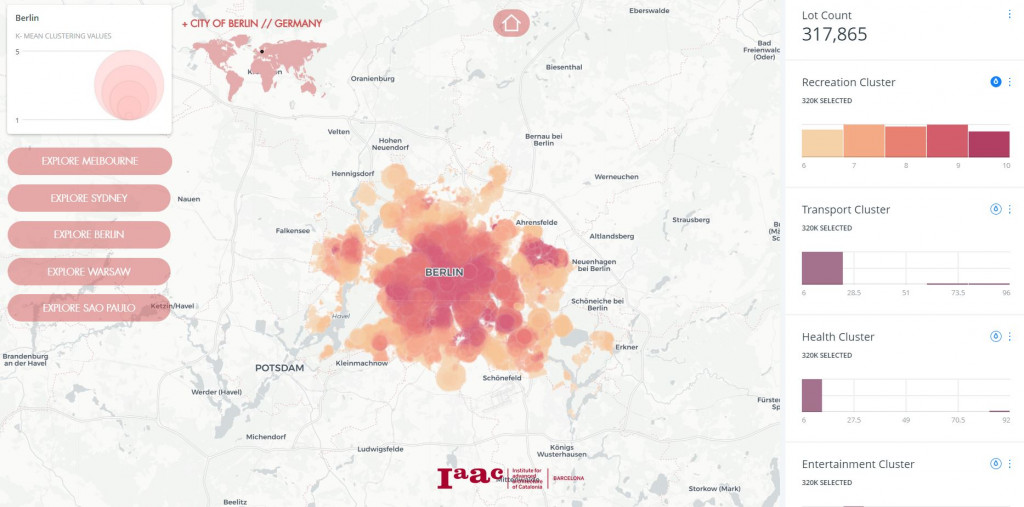
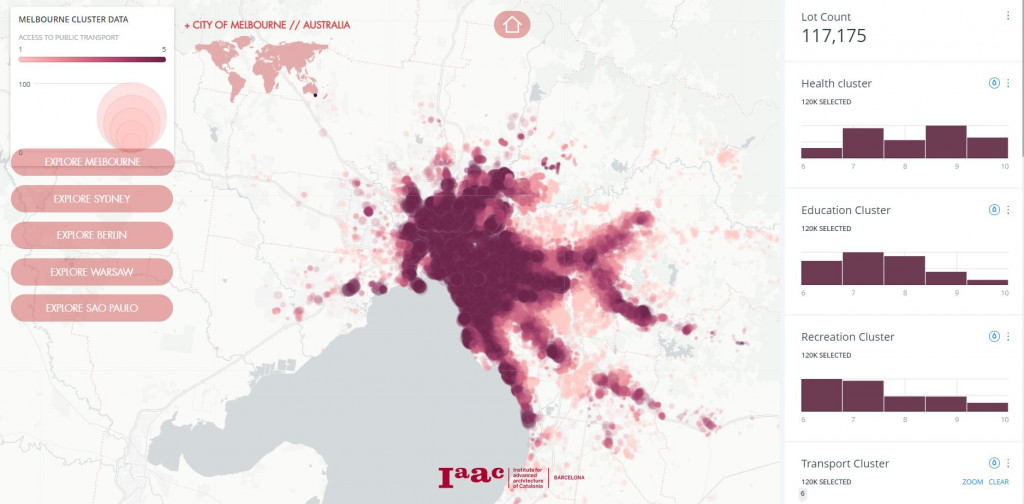
Carto is used to visualizing and filtering the information based on the project criteria. Melbourne city is used as a case study to test the different clusters and their relationships and create a web-based application that allows us to analyze and unveil the hidden opportunities for multiple cities. Five cities with different urban conditions were used as case studies for the analysis and comparison: Melbourne, Sydney, Berlin, Warsaw, and Sao Paulo.
//WEB APPLICATION
//Conclusion
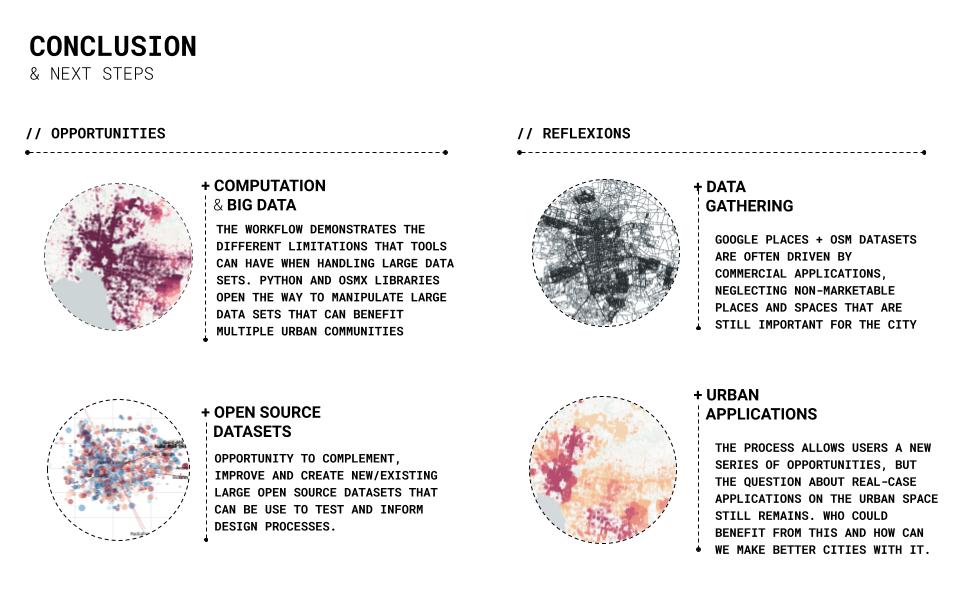
The workflow demonstrates the different limitations that tools can have when handling large data sets. Python and Osmx libraries open the way to manipulate large data sets that can benefit multiple urban communities. Opportunity to complement, improve and create new/existing large open-source datasets that can test and inform design processes. Google places + osm datasets are often driven by commercial applications, neglecting non-marketable areas and spaces that are still important for the city. The process allows users a new series of opportunities, but the question about real-case applications in the urban area remains. Who could benefit from this, and how can we make better cities with it.
//CREDITS
VOIDS is a project of IAAC, Institute for Advanced Architecture of Catalonia developed in the Master in Advanced Computation for Architecture & Design in 2020/21 by Aleksander Mastalski, Amal Algamdey, Amar Gurung, German Bodenbender and Felipe Romero. Faculty: Angelos Chronis and Lea Khairallah.