G-City | Generative DCGAN
High-carbon cities of Transportation
Concept
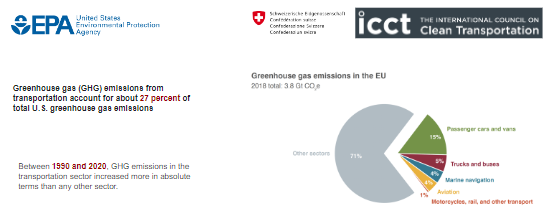
Carbon Emissions reduction is a topic on the table for a long. The EPA stated that 27% of carbon emissions is from transportation, while the EU has found the percentage to reach 29%. Hence, decreasing the traveled distance and accommodating zero-carbon transportation are proposed solutions.
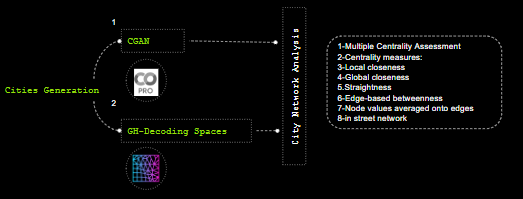
This project addresses city generation by utilizing two different approaches
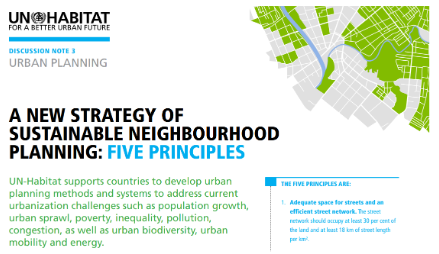
The UN habitat for a better Urban future has set 5 main principles to address the transportation issue. These principles incorporate solving urbanization challenges of population growth, urban sprawl, poverty, inequality, pollution, and congestion.
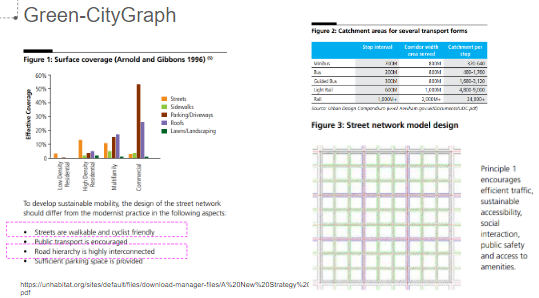
Consequently, a green city graph of nodes and streets or edges should provide walkable and cyclist-friendly streets, provide public transportation and transit lines, promote interconnected hierarchal roads, furthermore encompass sufficient parking spaces.
Approaches
This project has adopted two approaches to address generative city design and planning. Conv-GAN has experimented with processing the City masterplan as lines /edges and nodes which is a common approach everyone explores using the google maps app. Grey infrastructure or streets represents 30% of the city’s total area.
DCGAN
A generative adversarial network (GAN) relies on discriminators and generators, GAN generates new data similar to those used in its training. One of the most popular applications of GAN is people’s photos that don’t exist. People’s facial photos have common features that resemble city plans.
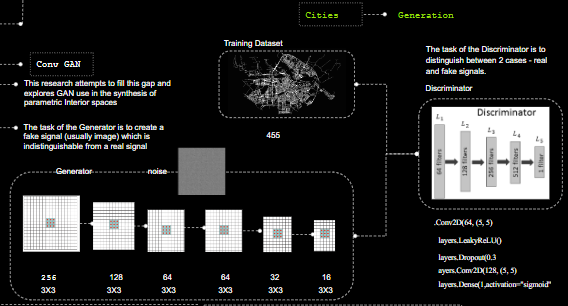
Training samples for epochs 752, 773,902, 997,1009, 1316, till 1877 show how the ConGAN model is training different urban fabric features that will be discussed later.
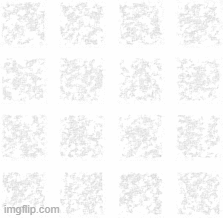
Results|Approach1
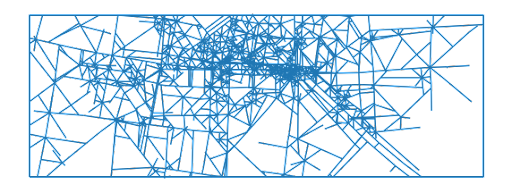
DCGAN Generated Cities Sample
An obvious observation from the results of the first approach, Deep Convolutional GAN has learnt the dispersing of connectors/ streets having some dense forms while other areas/zones have less-detailed configurations.
Approach 2
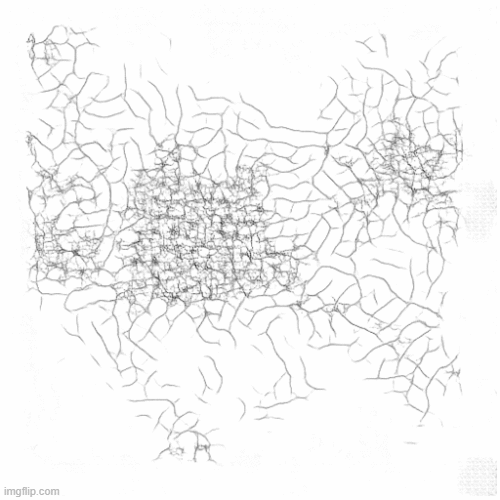
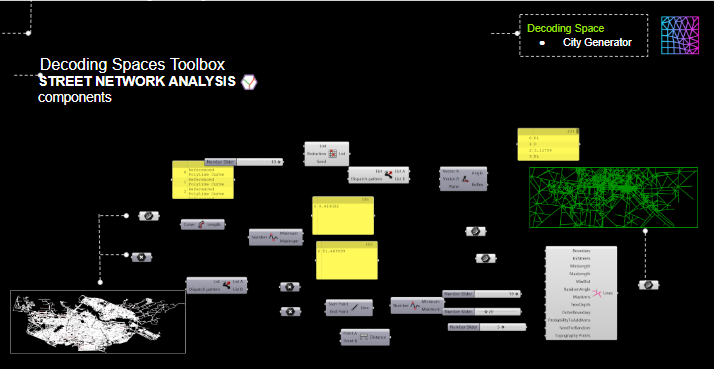
This approach is built on ‘Amsterdam’ city planning attributes that are fed later on using DS in rhino/GH to explore generative cities from another existing one. This approach is adequate for urban growth or expansion of cities to follow the old one, it is more like cloning city attributes and features to support its continuity.
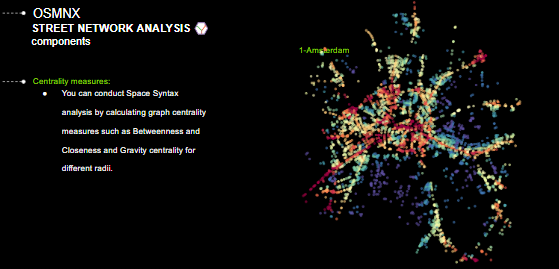
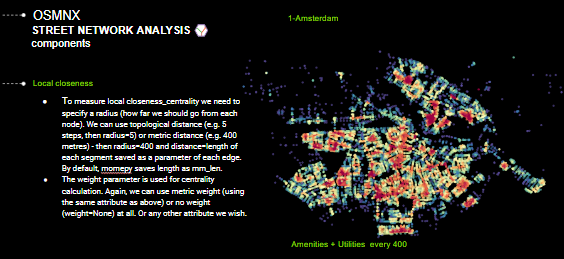
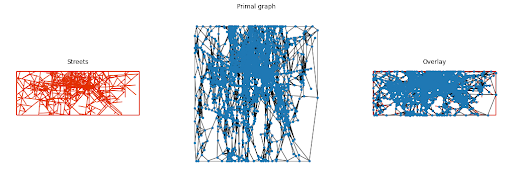
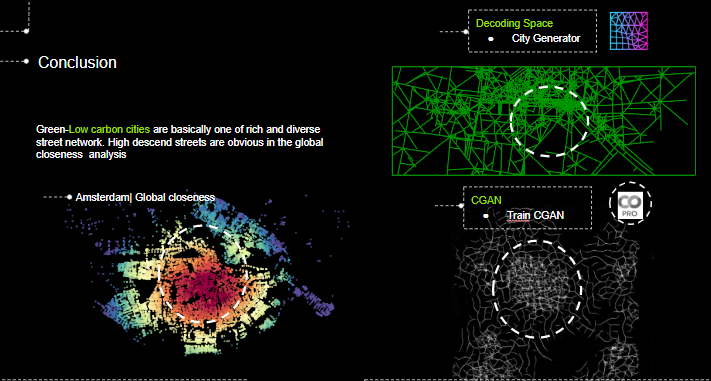
One of the cities that is used earlier in the first approach to train DCGAN is the city of ‘Amsterdam’. It is characterized by a rich centrality as visualized in the following figure. Further city analysis is applied with the aid of many libraries utilized to understand the characteristics and the specification that defines a connected city or green development.
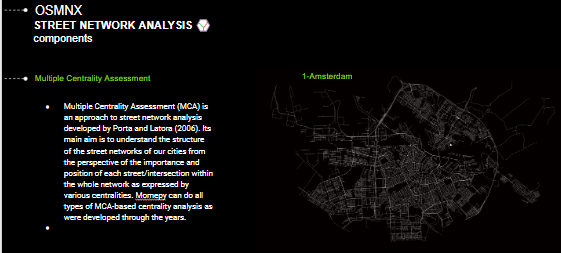
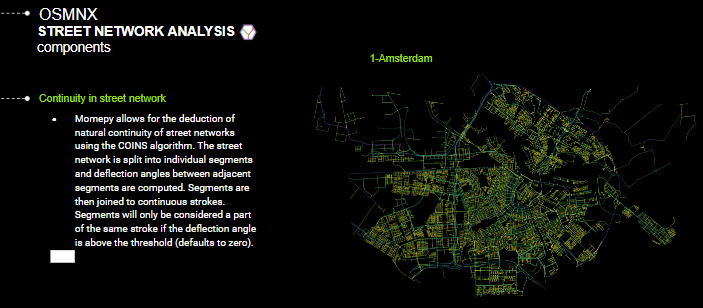
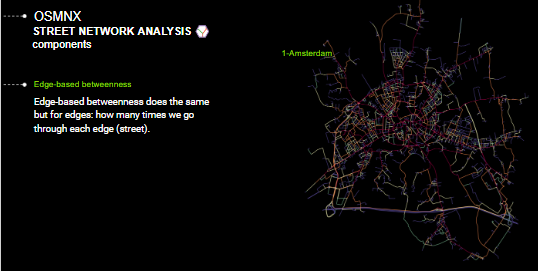
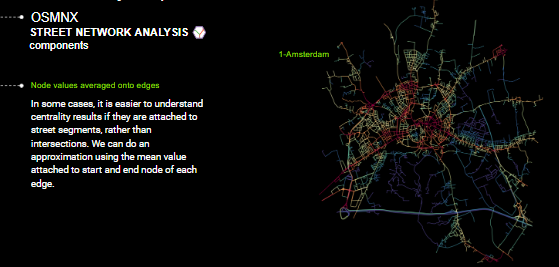
As delineated in the following analysis, streets’ continuity sometimes referred to as city edges are essential to understanding city patterns. Simultaneously, observing the hierarchy of edge-based betweenness that calculates the shortest path from one module to another. As a green inter-connected study, it is essential to cover a 400 m span accessibility.
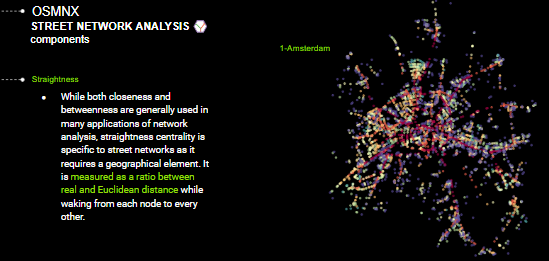
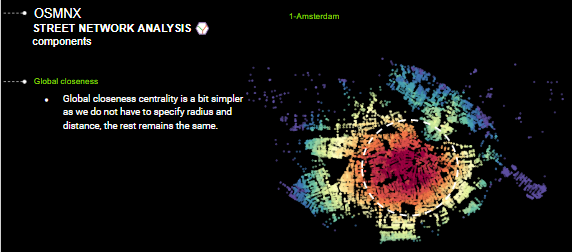
LEED-ND and the UN principles highlighted covering diverse land use and covering streets and green network in modular of 400-500 m which is represented in the local closeness graph yielded below. As a central city, the global closeness represents the dispersion of networks while having a dense one in the middle.
After city plan, analysis, and network studies, deduced attributes and features are used as inputs to generate a new one, this approach can be used to support designers and planners with a proposed or recommended expansion of Amsterdam with the same urban fabric.
Results|Approach 2
The degree of complexity has been reduced but it is based on the original attributes deduced from Amsterdam. This experiment shows that a city built through generations and witnessed great historic events can not be taken for granted to be computed with a quick algorithm. However, it is worth trying and making observations. Nevertheless, city planning is built upon land contours and topography which is missed in this study.
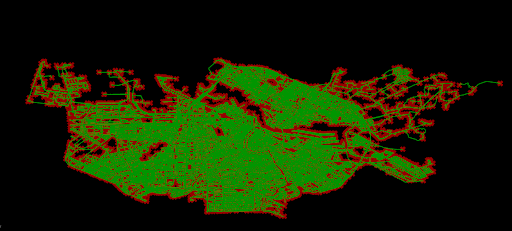
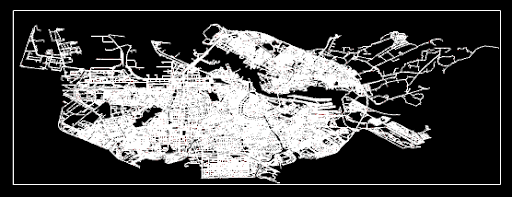
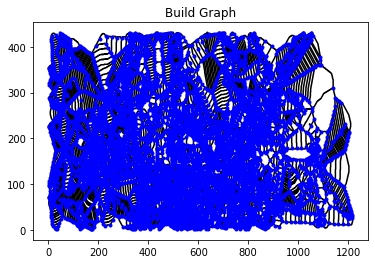
Converting the generated city to a graph is based on the hypothesis that streets are edges, while nodes are the end of edges as well as the intersections of these edges are nodes too. Since, it is a highly dense street network, even building the graph version looks denser.
Comparative Analysis| Approach1 – Approach2
At last, both results show less dense and higher dense areas of the street network, both have generated cities based on deduced attributes or features of high-connected cities, and walkable cities fit the 400-500 m modular system that characterizes the city’s space syntax.
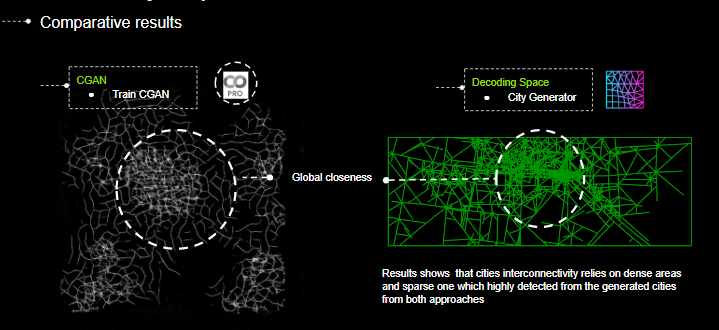
In terms of multiple centrality Assessments (MCA), the results highlight the global closeness that was easily identified in the analysis of the city of Amsterdam. If the aim is to reduce heavy or private transportation, a highly inter-connected city based on global closeness studies and consideration is recommended. Consequently, a Walkable city or cycling-friendly is planned on the local closeness of 400-500m.
Future Work
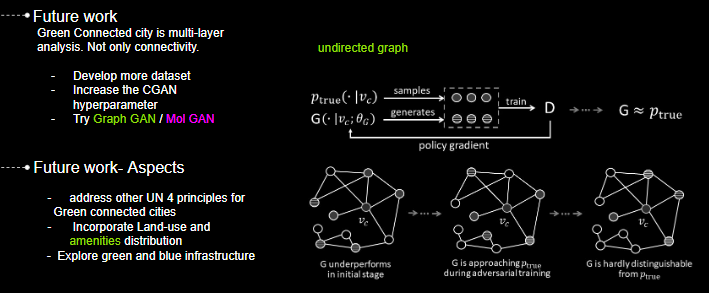
Graph neural networks better understand and interpret nodes and edges of cities. Hence, future work is likely to experiment with training with nodes and edges. In addition, the DCGAN hyperparameter and expanding dataset size are worth trying since the initial results have learned two MCA indices. Consequently, More training and bigger samples are expected to demonstrate other city indices.
City-DCGAN is a project of IaaC, Institute for Advanced Architecture of Catalonia developed at Artificial Intelligence in architecture (AIA) module of the Master in Advanced Ecological Buildings in 2022 by:
Students: Sammar Z. Allam.
Faculty: David Leon.
Faculty Assistant: Dai Kandil.
Faculty director: David Leon.
