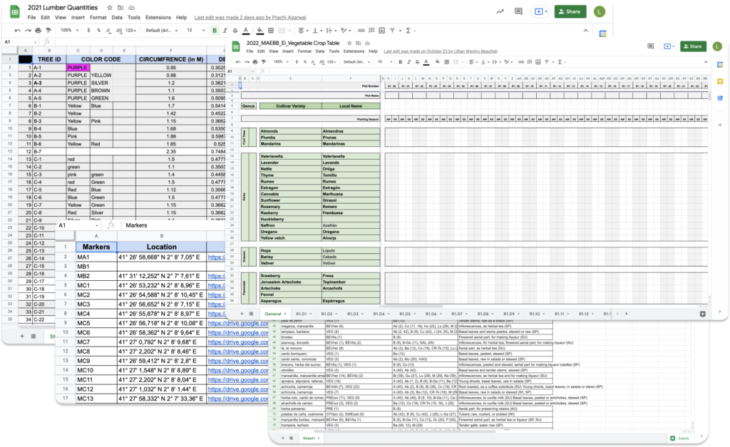
In Valldaura we keep track of many different types of data. Everything from the plants we grow, how many eggs our chickens produce to which trees we have cut and where they were cut.
Today this data lives in different excel sheets spread across different drive folders. Because excel sheets are not relational in nature, there have been several attempts to use quite advanced lookup formulas to create dynamic data that updates aggregated information based on entries across different sheets in the same document. One of the challenges with an approach like this is that information is fragmented and therefore difficult to find when you need it. Good quality data input is also one of the most important aspects of data management if we are meant to make sense of the data over longer periods of time. The way students contributed with data input before was to edit the excel sheets directly, which often lead to mistakes, broken formulas, and non-consistent input formatting.
To improve the data input and output quality AirTable was chosen as a software platform. AirTable makes it possible to organize relational data. This makes it easier to create two-way links between entries. An example would for example be the plants in our garden. We can now create a table with all the vegetable types we have available with some information like a name, a photo, which months you can grow it, how long it takes etc. We can then make a table with our garden beds labeled by numbers and area, and another table contains entries of seedings. Seedings will be registered when we plant something in the garden, something the students can do via an online form that creates a new entry in the database. Seedings will be associated with a specific plant and a bed from each respective table.
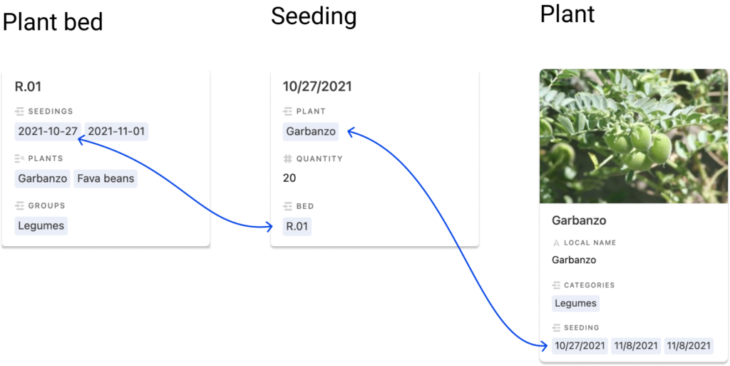
Example of relational data
This approach makes it possible for us to look at the data in a lot of interesting ways. We can see the data from the perspective of plants, and find all the beds that contain a specific plant. We can see the seedings in a form of a calendar to quickly get an understanding of when we planted things. We can quickly get an overview of how many plants there are in each bed.
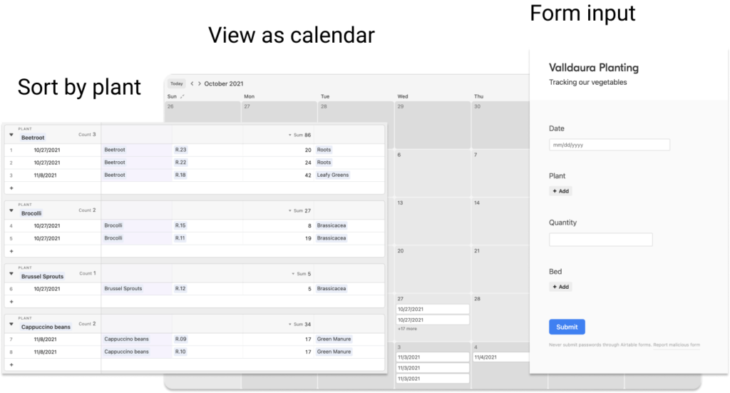
Different views over the same data
This approach has then been applied to all the different types of data we have at Valldaura. A problem that still persists is that the data is still stored in these databases/sheets and is not easily found by students when they need it or need to add something.
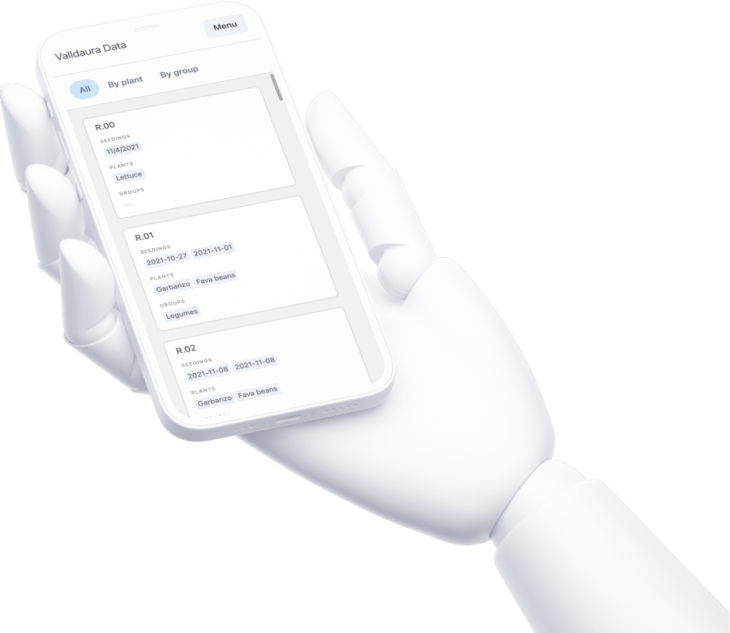
By making a simple website with a CMS system, we enable admins to choose which views and data inputs they want the students to have seen and make it possible to organize them by groups so they are easier to find. Now students only need to remember one website and have a clear overview of relevant data.
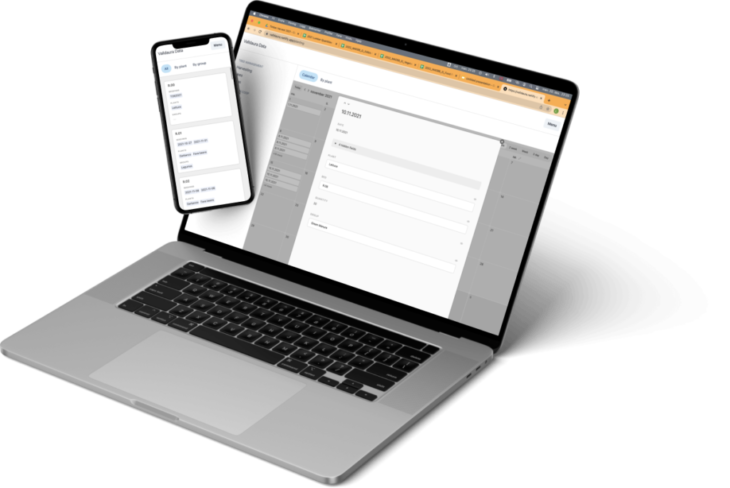
Screenshots of the website
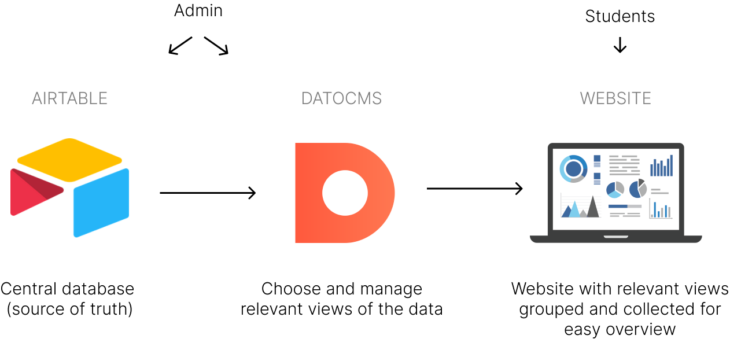
Diagram showing how the systems interact