Introduction
In data science, data is captured and computed in a diverse range of formats and architectures. How these forms interact productively is one of the principal challenges in generating novel insights from data. This is especially true with geospatial data analysis and when communicating diverse data types through maps. In the following exercise, we explore a simple method for joining two data types in Python to test an urban design hypothesis. Our starting point is the idea that there is a correlation between average income and urban greenery in the city of Barcelona. Let’s explore how we used data to inform our understanding.
Methodology
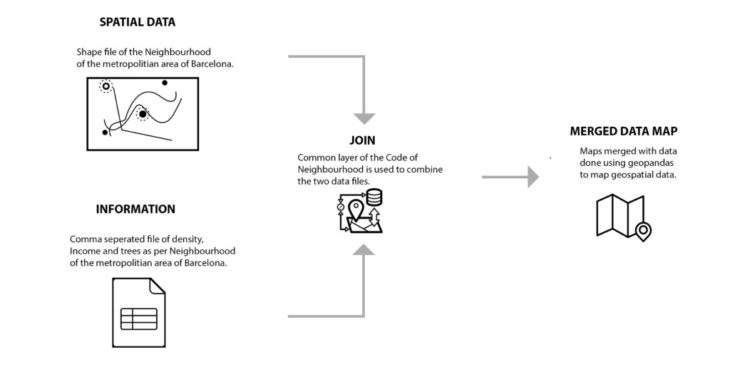
fig 1. Data join work-flow
For the analysis we started with two types of public data, both sourced from Open Data BCN:
SHP file
-A map of Barcelona’s built-up area, divided by neighbourhood
fig 2. Barcelona’s built-up urban area – the SHP before the CSV data join
CSV files
-Average income of residents in each neighbourhood
-Locations of each tree planted on public streets
-Number of residents in each district
We used Python (operating in the Pycharm IDE) to execute a data join operation, merging the two types of data to run various mapping analyses. In this case, we joined geospatial vector data (SHP), with delimited text files (CSV). Each of the files we used has a common data field “Neighbourhood”, which was used as the parameter that enabled the merge operation.
Joining the SHP map data of the city with the CSV text data on income via the common data field, we generated a new data field that showed us the average income in each neighbourhood. We then plotted that result on the map using a gradient to create a heat map for comparison.
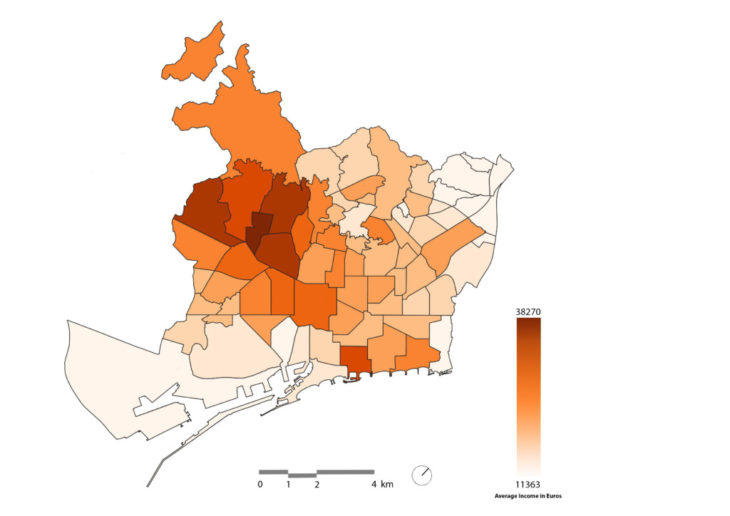
fig 3. Average income in Euros by neighbourhood
Next, we ran the same join operation, this time using the CSV data on street tree location to generate a new field that shows how many street trees are located in each neighbourhood. We then used QGIS to calculate the approximate total area of street space in each district by subtracting the built-up space of building parcels from the total map area of the city. The resulting space (total map area minus building parcels) was used as a proxy for the amount of public street area in the city. The number of street trees was divided into the proxy to map a comparison showing the relative density of street trees by neighbourhood.
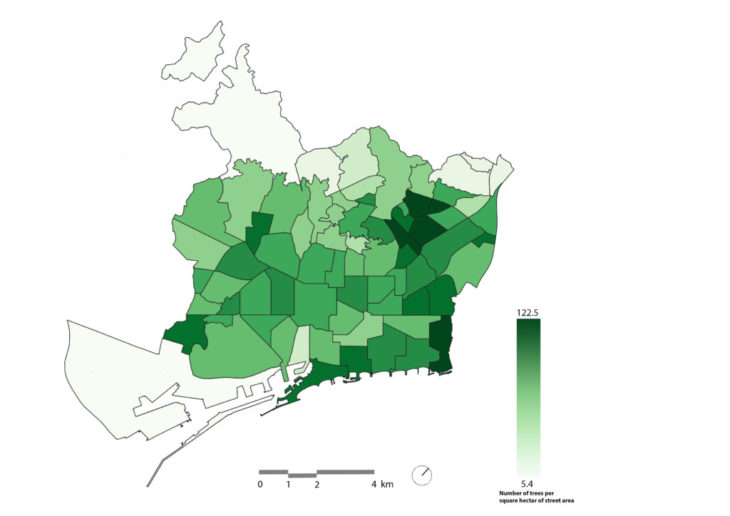
fig 4. Number of street trees per hectare of public street space
Interestingly, the map shows little obvious correlation between incomes and the number of street trees planted across the city of Barcelona. This was counter to our initial hypothesis, so we pushed the analysis one step further by running another data join. This time we used a CSV field indicating the number of residents per neighbourhood. Again joining the CSV data with the neighbourhood field in the shapefile we produced another heat map of the neighbourhoods. In this case, we also see no obvious city-wide correlation between density and the number of street trees planted.
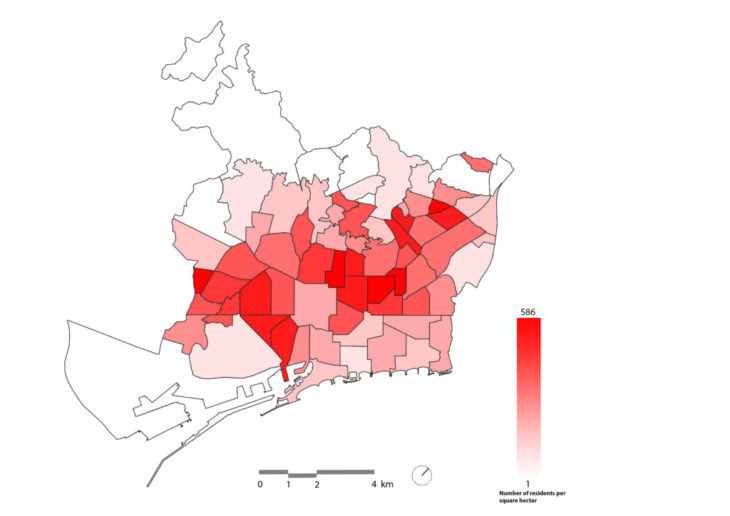
fig 5. Number of residents per hectare in each neighbourhood
Conclusion
Although these results were counterintuitive to us, it is the optimal outcome. If our data and analysis are valid, it says a lot about the city of Barcelona’s public space strategy. Planting and maintaining street trees for public benefit is common to cities across the planet, but it’s not always the case that the distribution of those trees is agnostic to district incomes and density. There are, of course, many other variables which would need to be considered to generate a high-integrity result here, but that is not the subject of this exercise. The purpose, in our case, was simply to practice and demonstrate the power of using code to merge different data types in the pursuit of more well-informed urban analysis. Taking these principles and techniques to the Nth degree is a powerful approach to generating urban insights, and ultimately for building better urban environments.
Urban Trees For All is a project of IAAC, Institute for Advanced Architecture of Catalonia developed Master in City and Technology in 2021/2022
Students: Pushkar Runwal, Weronika Sojka, & Ocean Jangda
Faculty: Diego Pajarito