The central question for this seminar was: can Twitter be used to analyze urban patterns?
The class was given a database of all Tweets coming from inside Barcelona from November 2017 through March 2018. The task was to analyze the data in any way necessary to answer the main question.
First, it was essential to build a strategy, and a “taxonomy” to organize the many layers of information. How do you organize such a dataset of 1.7 million tweets, each with almost 30 separate data points? A balance must be found between the general and the granular. For us, the hashtag is a perfect candidate. Assuming that when people use hashtags, they are tweeting with special intention, one can associate each hashtag with a topic of conversation.
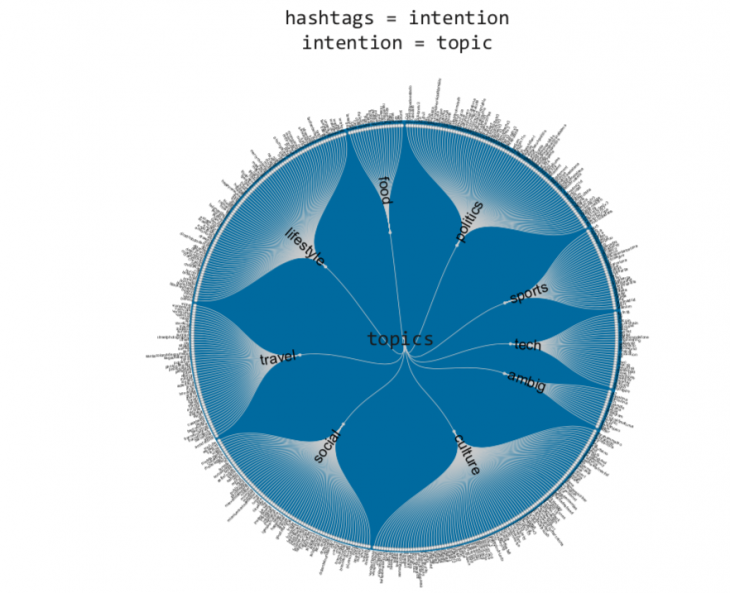
The process of assigning topics to hashtags is by nature slow and subjective. Special care had to be taken to search every hashtag on Twitter to make sure that it indeed correlated with a certain topic. During this step, many hashtags with multiple possible topics were found. They were labeled as “ambiguous.”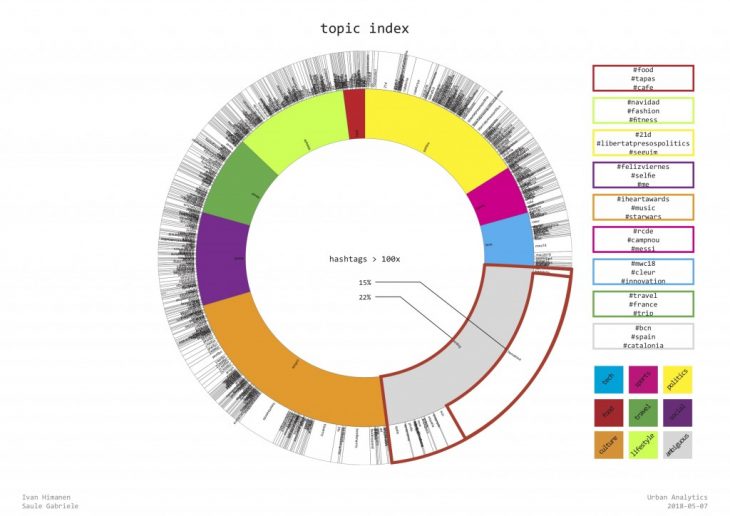
It turns out that these “ambiguous” hashtags are among the most common hashtags. In particular, the single most popular hashtag in the entire database was #barcelona.
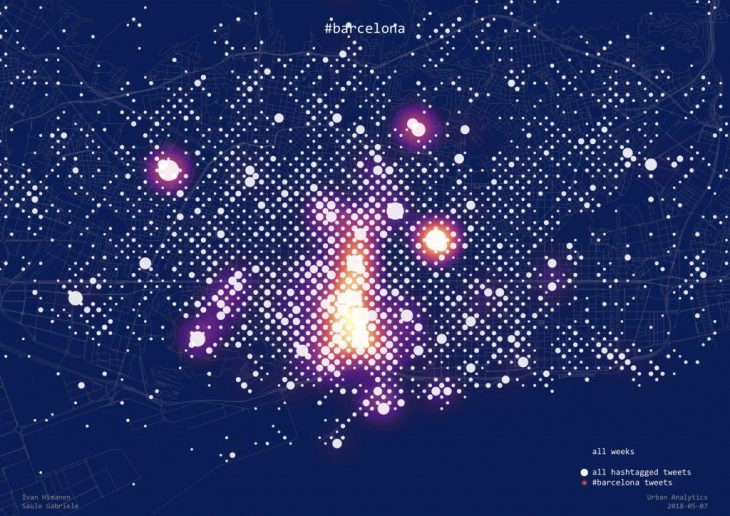
This seems obvious on its face. But could we perhaps take this enormous chunk of tweets that have #barcelona attached to them and determine what topics people are actually talking about when they use it? This became the challenge.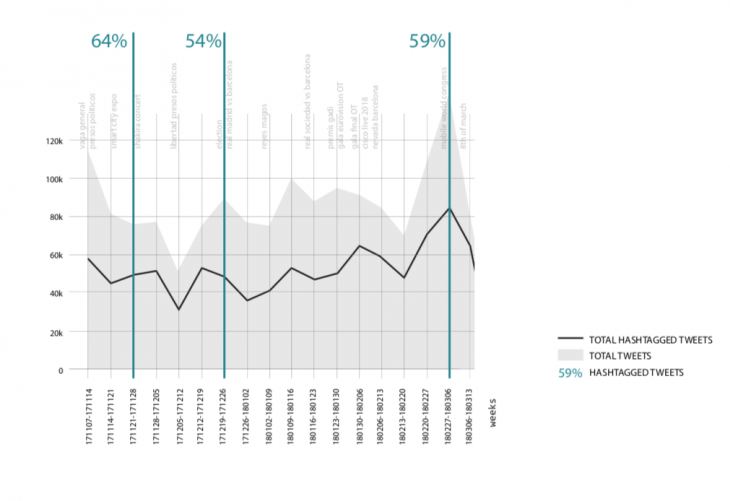 First, by plotting all of the hashtagged tweets over time and comparing them with all of the tweets, one can immediately identify certain periods of activity and “increased intention,” that is, weeks during which the percentage of hashtagged tweets increased relative to total tweets.
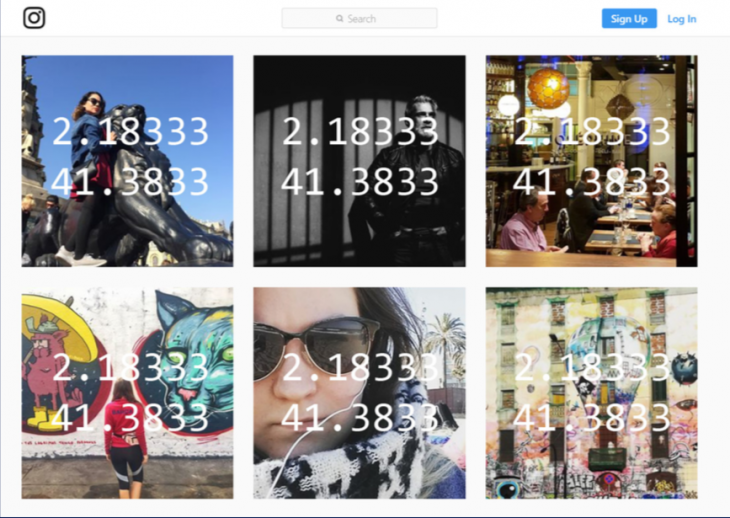
In the process of cleaning the data, it was discovered that many tweets are coming from Instagram– when a person adds a photo on Instagram, they are given the option for Instagram to automatically add the post to Twitter. While these data are useless for mapping, they are useful for hashtag analysis.

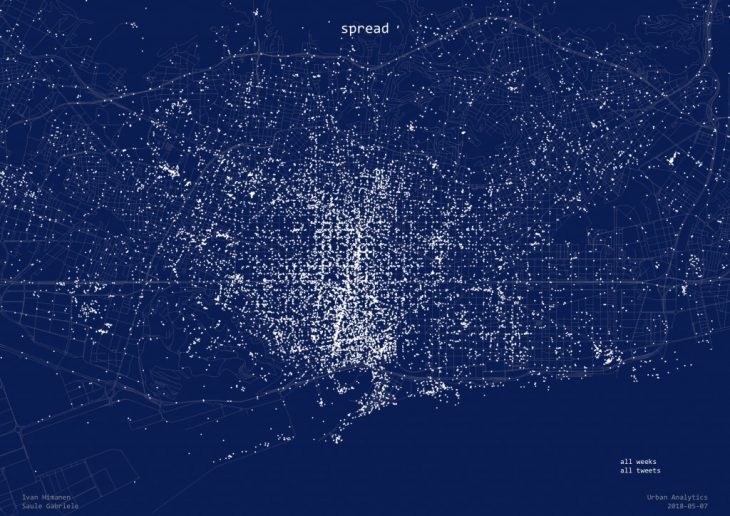
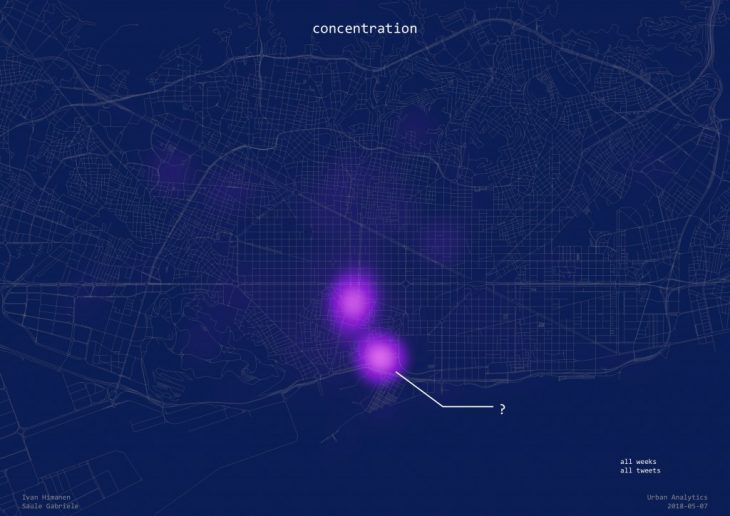
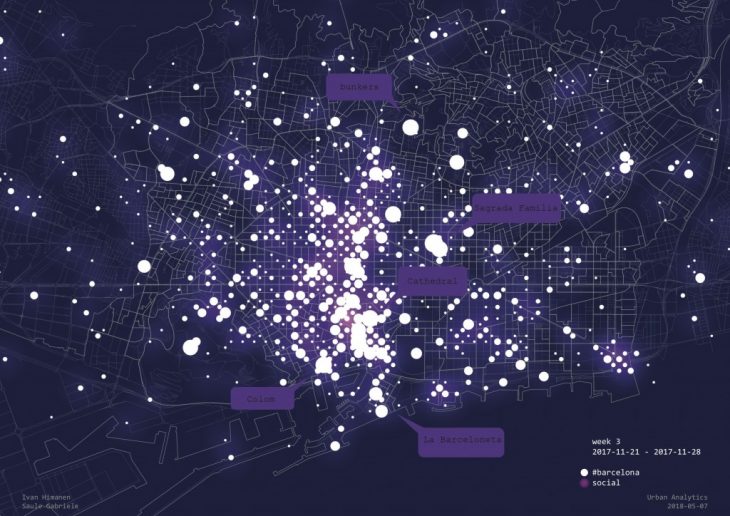
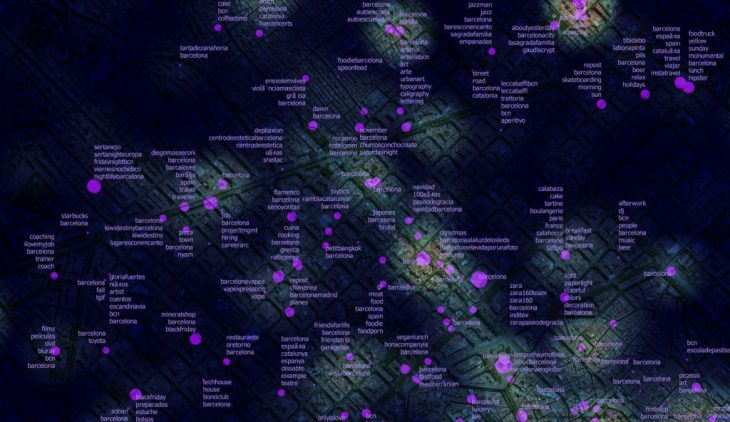
At first glance, the tweets with #barcelona are clearly more concentrated in the expected tourist locations: Park Güell, Sagrada Familia, Passeig de Gracia, and Ciutat Vella. Does this hold for week-by-week analysis?
Mobile World Congress: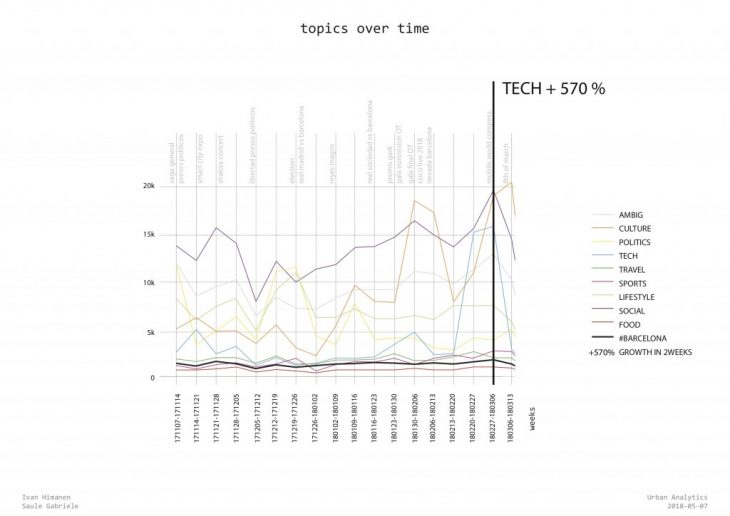
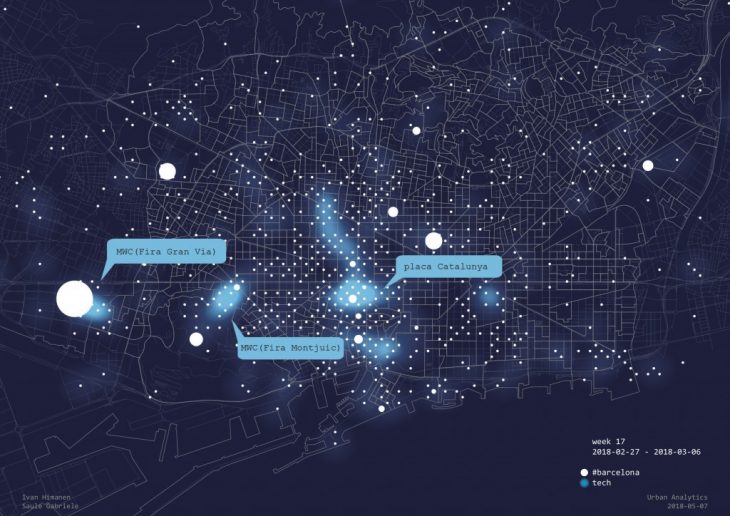
There were people adding #mwc18 to locations in Barcelona that had nothing to do with the Mobile World Congress. It is clear that these are the techy visitors who are seeing the entire city through the lens of the event they are visiting for.
Below, the week of the December 21st election.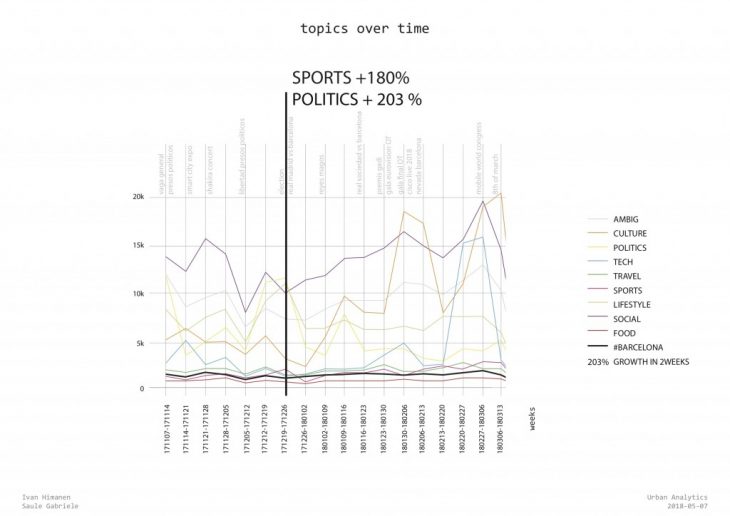
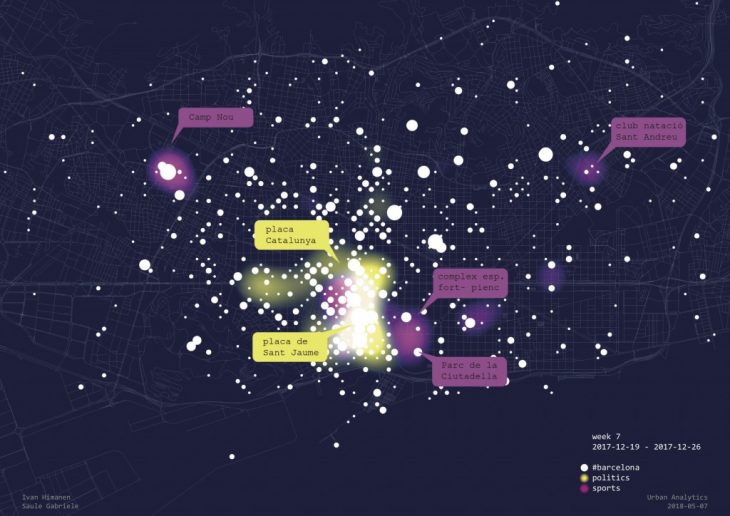
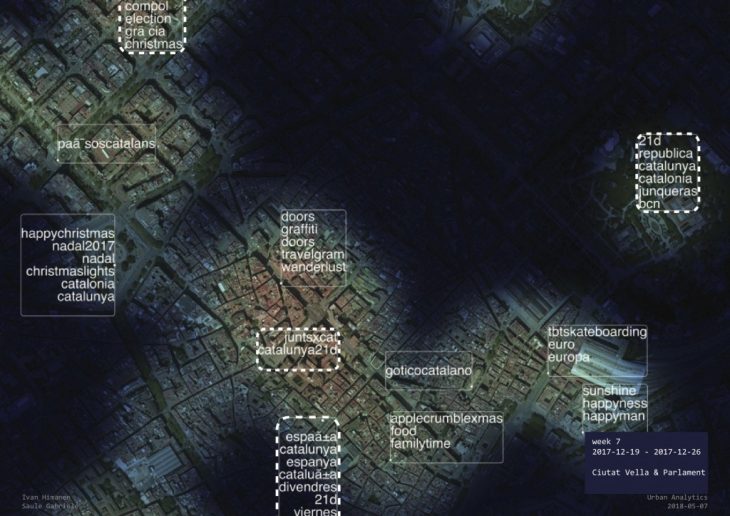
Interestingly, there were as many people talking about politics as there were people talking about the El Clasico match on December 23rd. In general, these topics occurred much less in correlation with #barcelona than, say, the Mobile World Congress. Political activists and FC Barcelona fans feel less need to emphasize that they are in Barcelona.
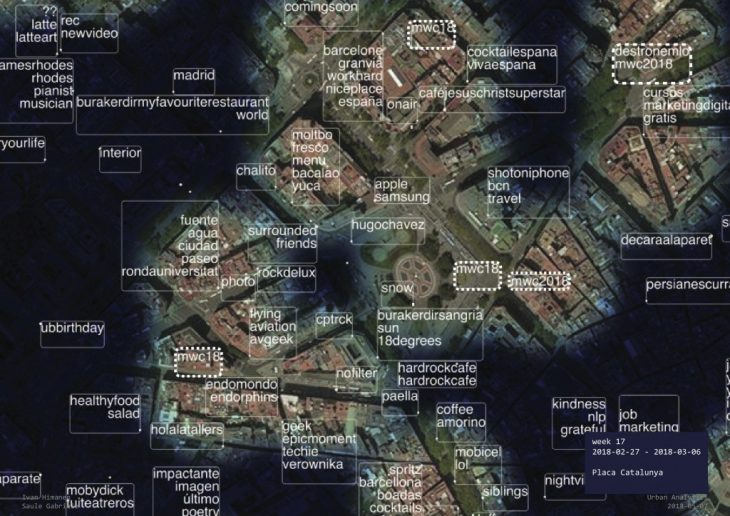
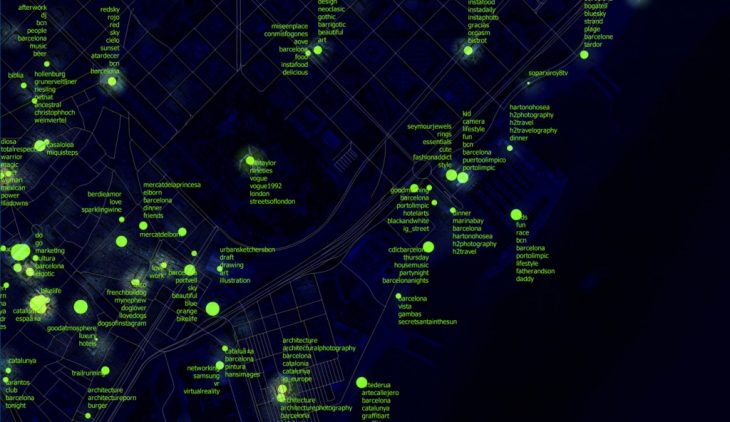
Finally, we had to return to Instagram: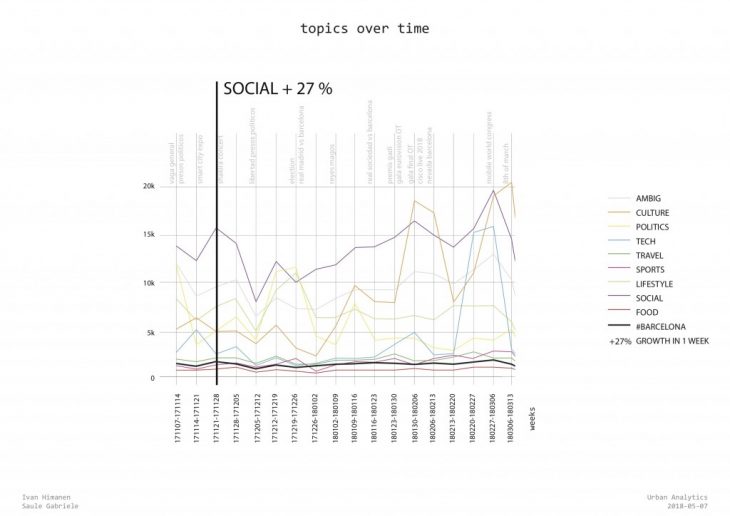
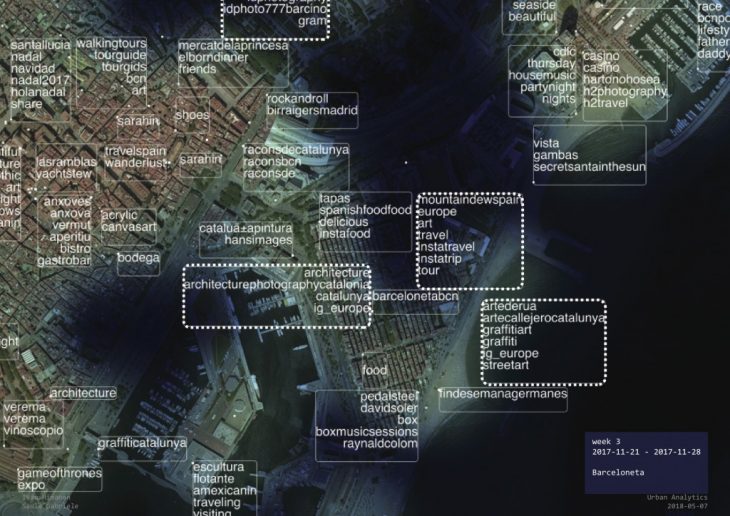
Using Instagram as an additional filter lets us see what people are seeing of Barcelona, as opposed to what they are speaking about. Taking a photo is more connected to the territory. A picture is worth a thousand words.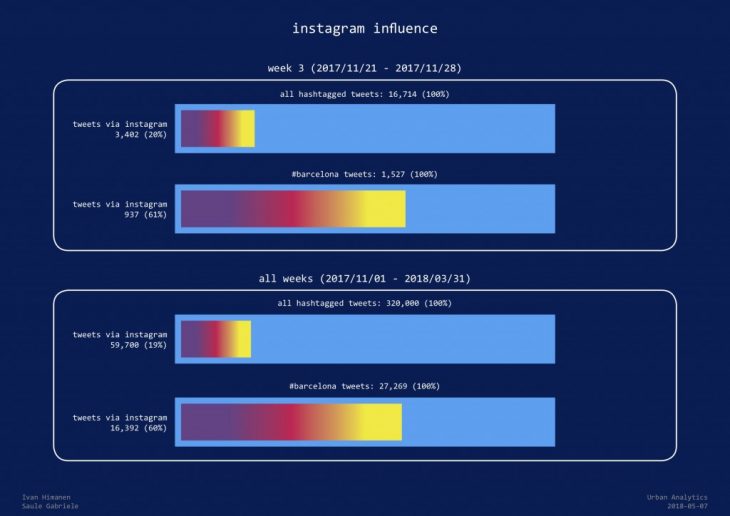
Ultimately, however, the seminar fell short of arriving at a proposal, or a prediction model, or clearly describing how the discovered patterns can concretely be used to influence the development of the build environment. The discussion at the final presentation centered around this next step. Among the possibilities were:
- Instagram analysis– if Twitter is more for having a conversation through text, Instagram might be more for showcasing one’s life. Which are people more interested in doing? Perhaps the latter can yield richer results with a smaller dataset. Focusing on the image of the city and its inhabitants could reveal more about their relationship to the built environment.
- Sentiment analysis associated with certain hashtags, or topics. Is Twitter a more negative or positive platform? If we can identify areas where people tend to gather to talk about certain positive or negative topics then we could intervene in those spaces.
- We noticed a large number of hashtags associated with a fitness app (#endorphins, #endomondo). Runners most likely have a wearable device that automatically tweets for them when they finish a workout, logging the distance they ran, and where they ran. These tweets are interesting because a) they are physically connected to the city (the location of the run); b) they live in the grey zone between tweet-bots and real humans. Analyzing the movements of people who use the public streets to work out could be an interesting step towards planning for a more runnable/walkable city. Does this happen in other cities as well?
 Who Tweets #barcelona? is a project of IAAC, Institute for Advanced Architecture of Catalonia, developed at MaCT (Master in City & Technology), 2017-18 by:
Students: Saule Gabriele Petraityte, Ivan Himanen
Faculty: Luis Falcón