Organic analysis of the urban fabric
The studio dealt with the study of a 3km by 3km part of Barcelona city.
The tile H lies at the bottom center of the grid and is part of the seafront.
This tile consists of:
- 30% water,
- 29% abiotic spaces,
- 14% biotic spaces
- 26% of connectivity.
The total number of inhabitants is 41,100.
Total carbon emission per metre square is 0.03m2.
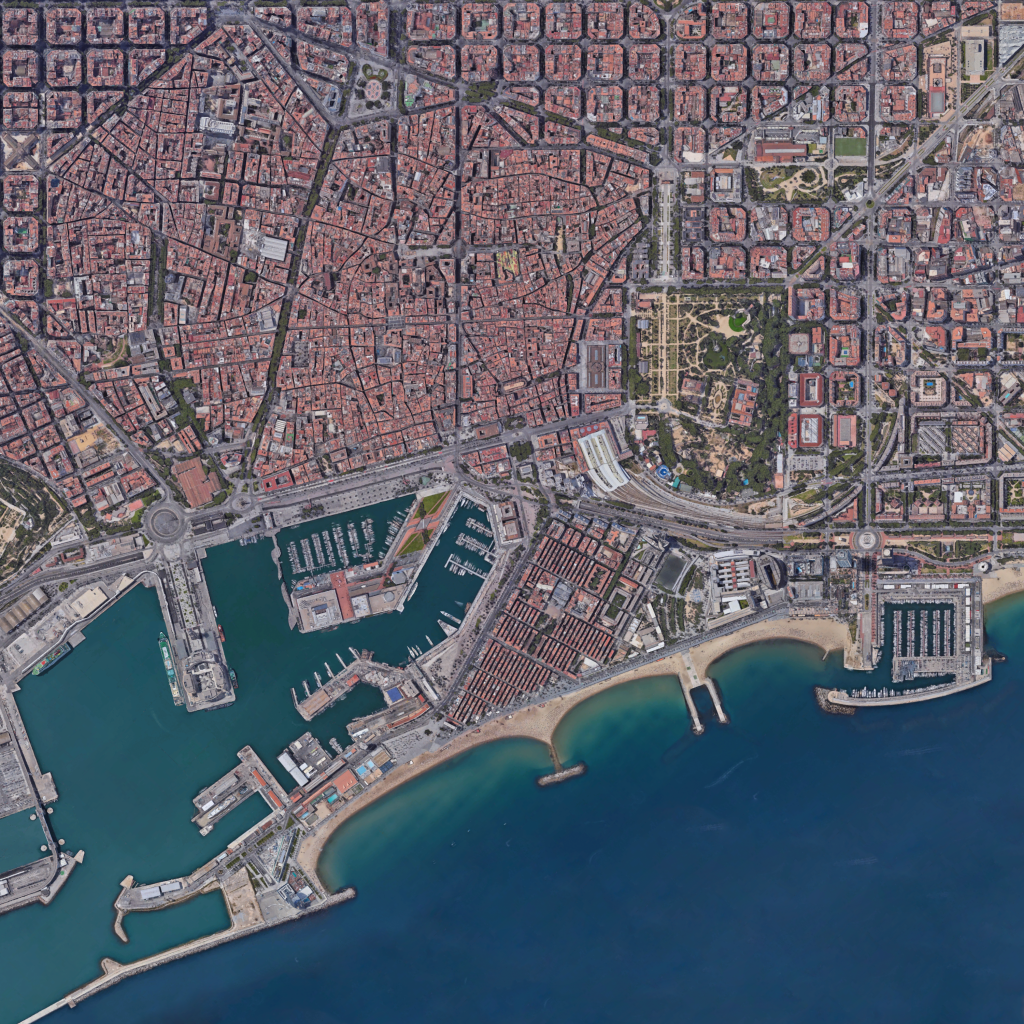
Satellite map of the district
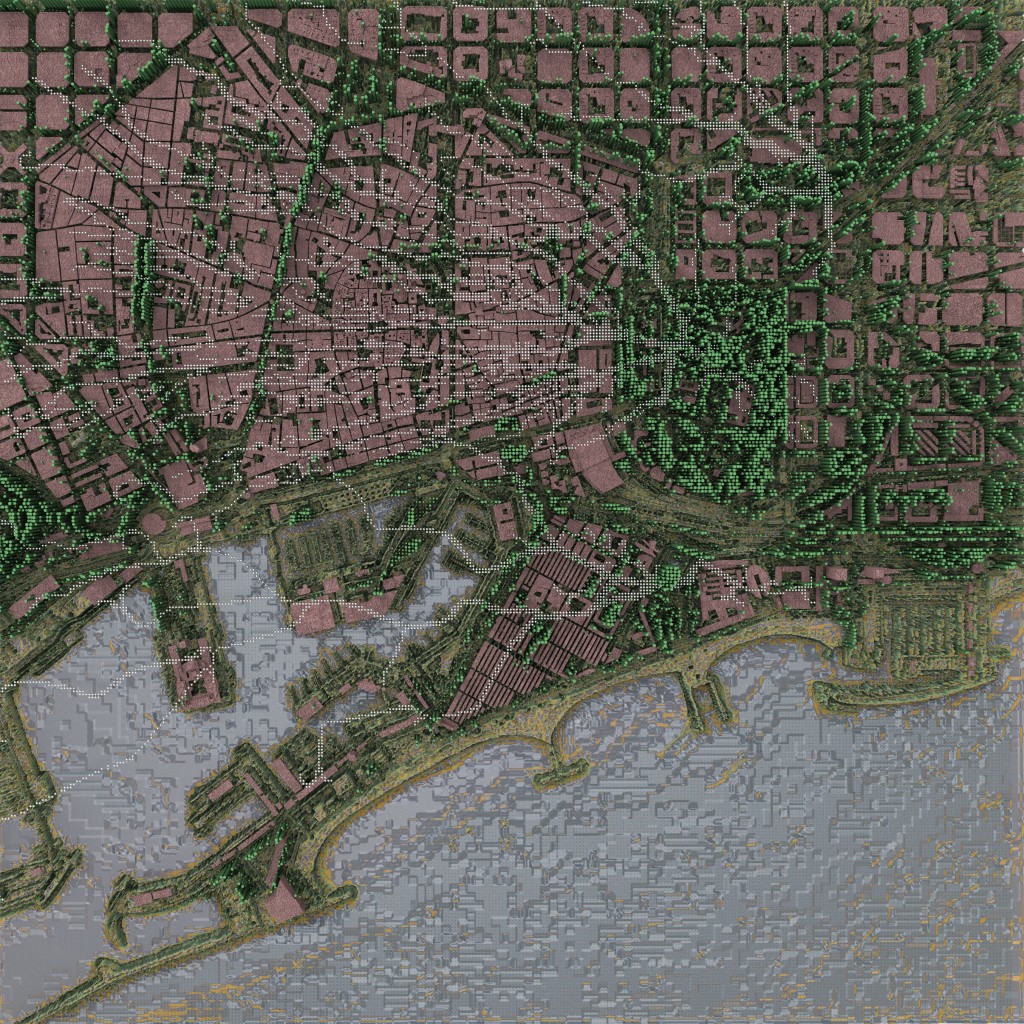
A set of layers have been extracted from the satellite map in order to create bit-maps, which then help in creating Gradient field diagrams.
As we proceed further, every new layer that has been generated is being informed by the layer below or previously.
Hence, creating an INFORMATIVE link between all the layers.
Carbon analysis is done in order to understand the amount of carbon dioxide emitted or absorbed by different areas in the context.
We have created virtual plots which represent the carbon emission, the size of the plot is proportional to the building density and amount o emission. The larger the plot – the lesser is the emission. The emission is represented in the absorption extent of the biotic regions.
Each point accounts to a certain amount of absorption, an accumulative sum of the larger biotic spaces has been represented in the maps for ease in data visualization.
Proposal
With the data gathered, we came to the conclusion that the amount of carbon emitted to the amount of carbon absorbed is extremely high.
How could we reduce the amount of Carbon in the atmosphere?
Carbon emitted is present in the atmosphere as oxides of carbon. These particles travel through the atmosphere and hence spreading over a larger area.
With this, we considered the main agent for the scattering of these particles is the Wind or the air that blows over a particular region.
Is there a possibility that wind movement can be used to reduce the carbon concentration in the atmosphere?
By considering every abiotic entity as a Chimney that produces a certain amount of Carbon throughout the year.
With this strategy of Informative linking of layers, a bitmap of the abiotic spaces is created, these points act as the center each one of them.
Generating virtual plots which a new grid of the entire tile.
Depopulating the number of points by considering the points with only emission values above the average of the entire tile.
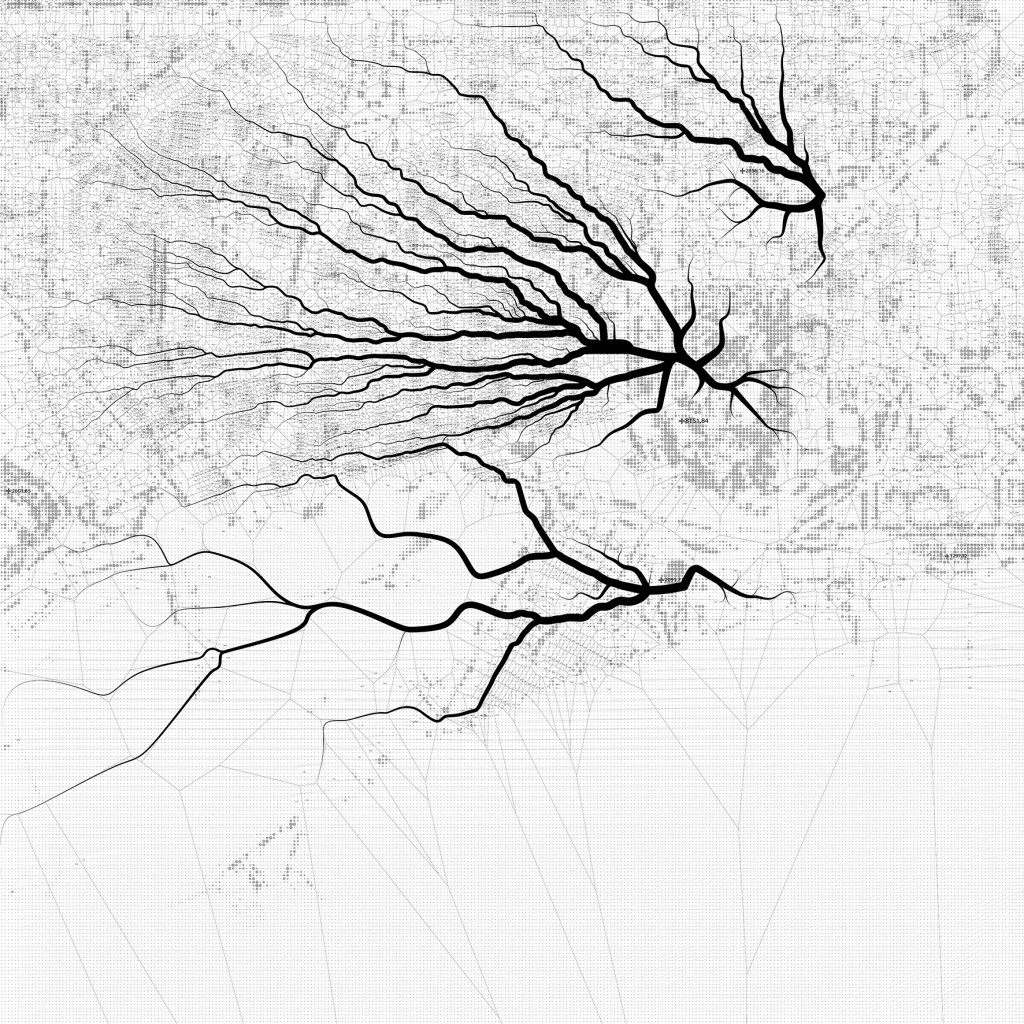
Simulating a dominating wind map on the grid, to show the natural direction of movement of the carbon particles.
Hence, obtaining a Shortest path taken by the particles along the new grid network from high carbon to least carbon concentration zones, along which filtration devices can be installed which would consume carbon.
Introductory Studio G2 // IaaC, Institute for Advanced Architecture of Catalonia
Developed at Master in Advanced Architecture in 2018 by:
Students: Anton Koshelev, Elif Karamustafa, Pratik Borse
Senior Faculty: Claudia Pasquero and Marco Poletto (EcoLogic Studio)
Computational Expert: Konstantinos Alexopoulos (EcoLogic Studio)