The Brief
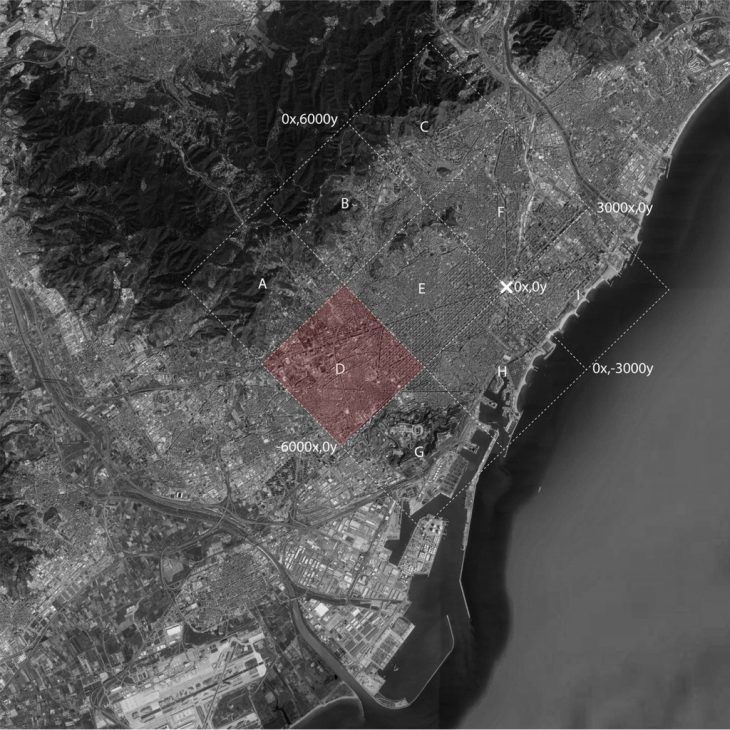
In this studio, Barcelona is explored in 9 sites; each of them is 3km square. Both digital and biological intelligence by using computer-generated algorithms and Physarum Polycephalum, a mold are used to analyze the city. Each group had one site to analyze and propose a new urban manner.
Analysis
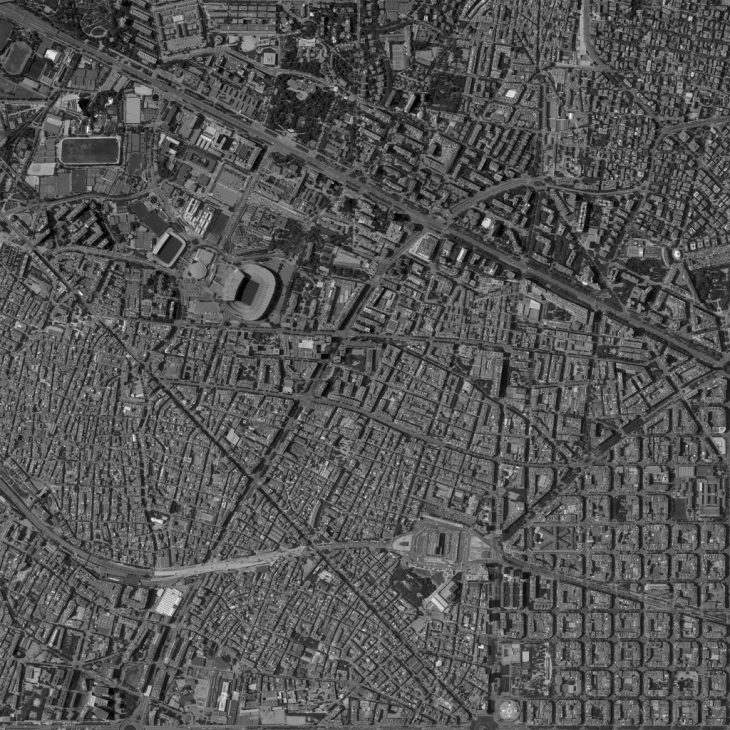
Here, we are looking for site D. It is located upside of Montjuic area. In this area, there are 3 types of urban structure.
- First one is the west side, which is the old city. Narrow streets and the high density of people decrease this area’s air quality very low. It is very intense and residential.
- The second one is the east side, which is the grid city, the Eixample. The area was constructed in the 19th and early 20th centuries. The air quality is much better according to the old city.
- The third one is the north side of the area, which is the new city. It is a new neighborhood and it has more CO2 absorption areas according to the other 2 parts.
- The old city has a park for 36,000 sqm named Park de Espanya Industrial, Park Turó of 31k sqm adding to a total of 60K sqm.
- Grid city has Park Joan Miro of 64k Sqm.
- The new city has Park de Pedralbes, Jardins for 1L sqm and Park Cervantes for 89K sqm adding to a total of 2L sqm.
- Football complex for 1 sq km.
- Biotic zone count for 0.39 sq km and football complex for 1 sq km adding to 1.4 sq km.
The Approach
We analyzed 3 different urban planning and air quality in the site. 4 points are specified in this area as the source points. These are representing wide and critic CO2 absorption areas. Also, each block of the buildings is representing CO2 emission areas.
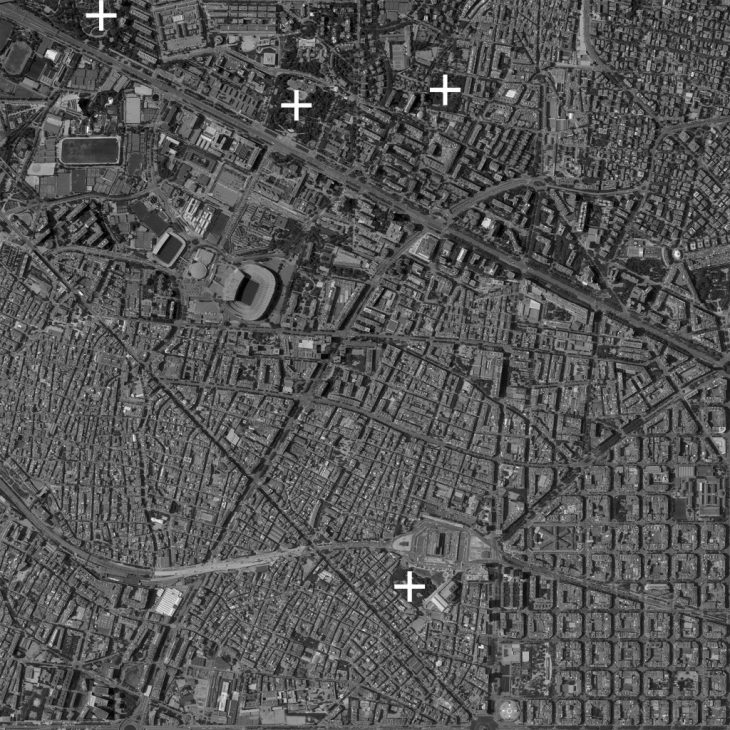
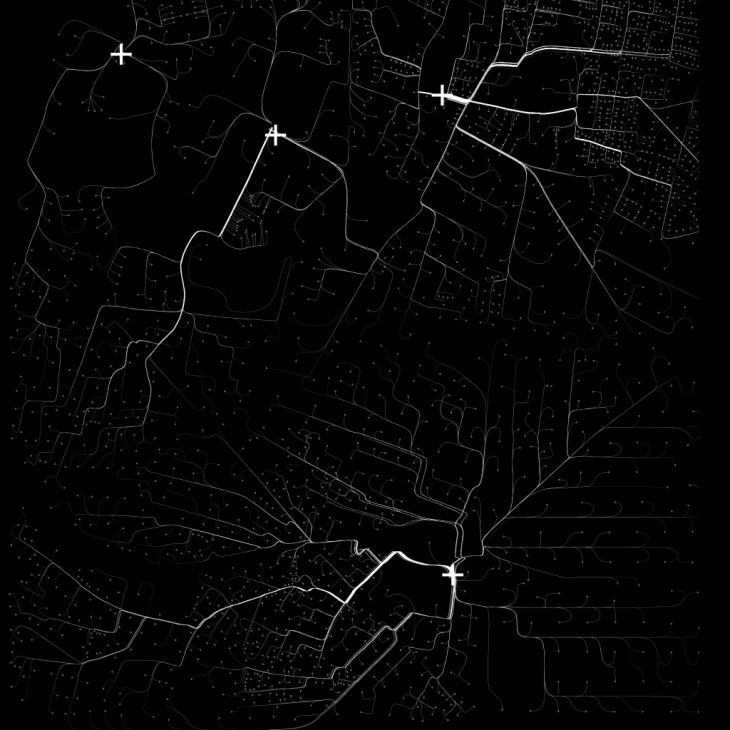
These images show the connections between the source points and main CO2 producers. It creates dense path systems through the absorption points.
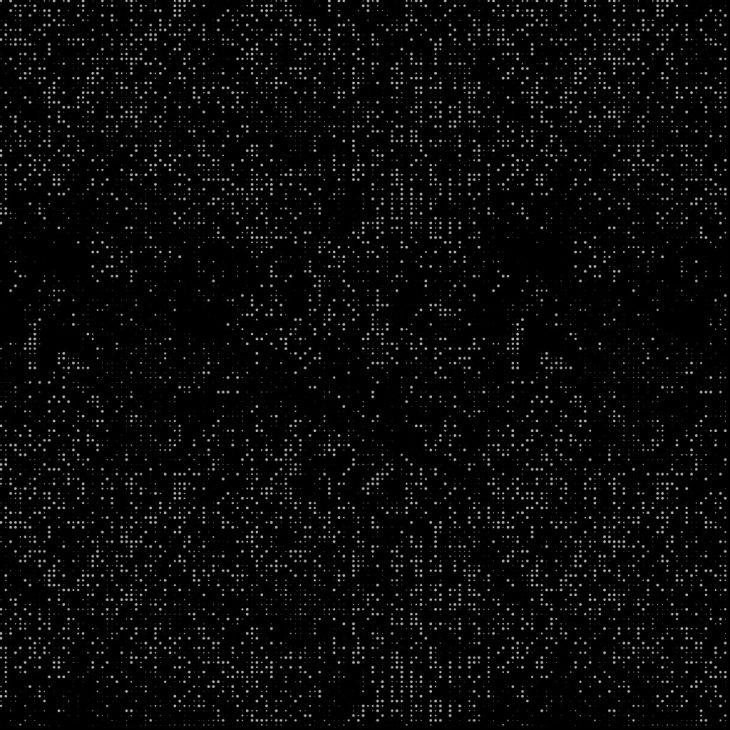
Each dot is representing a building which means a CO2 producer hub.
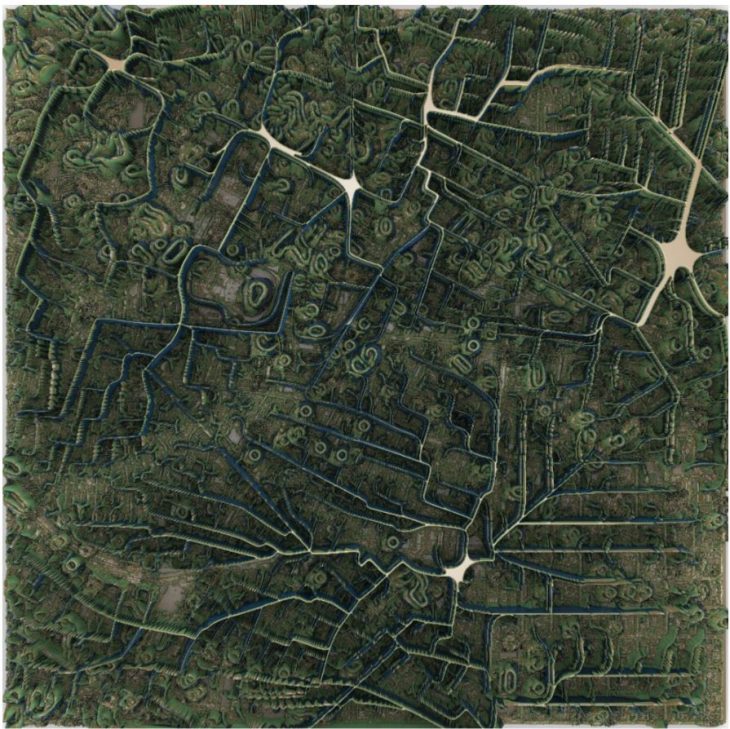
CO2 absorption areas

When we overlap all the analysis that we found with the digital intelligence, it started to be readable for a conclusion. Each line is representing a piece of information and each line is a factor. It is seen that how the path is spreading and growing. It is coming from the points that cause air pollution through the main O2 producer areas. The path of biotic.
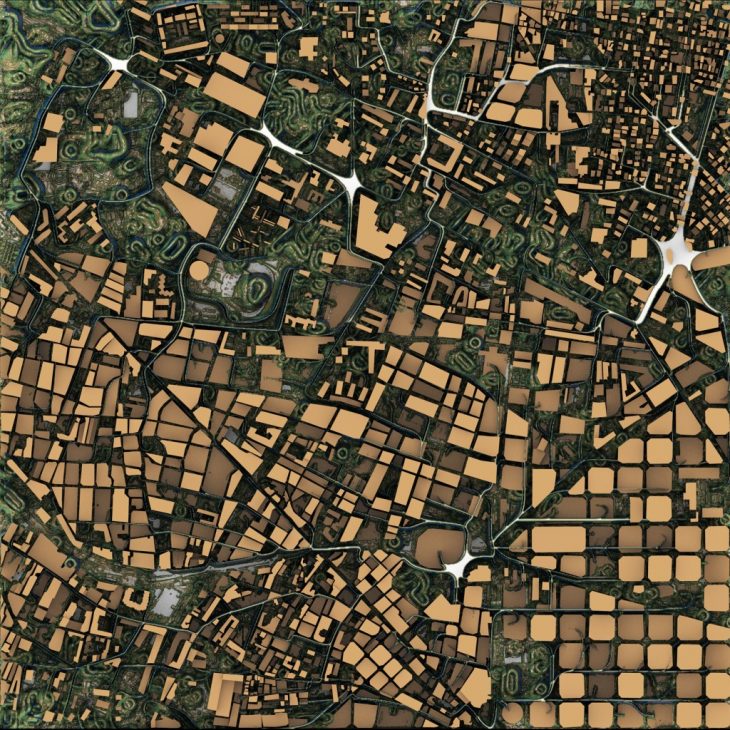
The Proposal
With all these data the proposal is merged as a biotic road.
The proposal is offering 3 levels; building level, pedestrian level, and soil level. Instead of car roads, the proposal offers a soil ground to create the biotic road. On this level, the tree biomass is going to cause foliage. This foliage is going to provide soil respiration and microbial biomass.
Biotic factors may have a propensity to cling wherever conditions permit. For example, air plants. Their nutrients from debris and dust in the air.
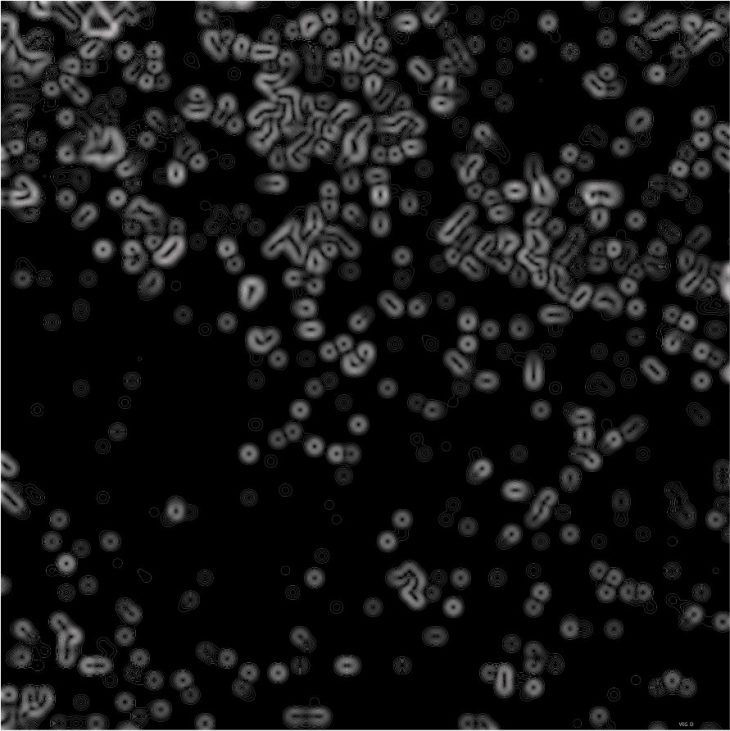
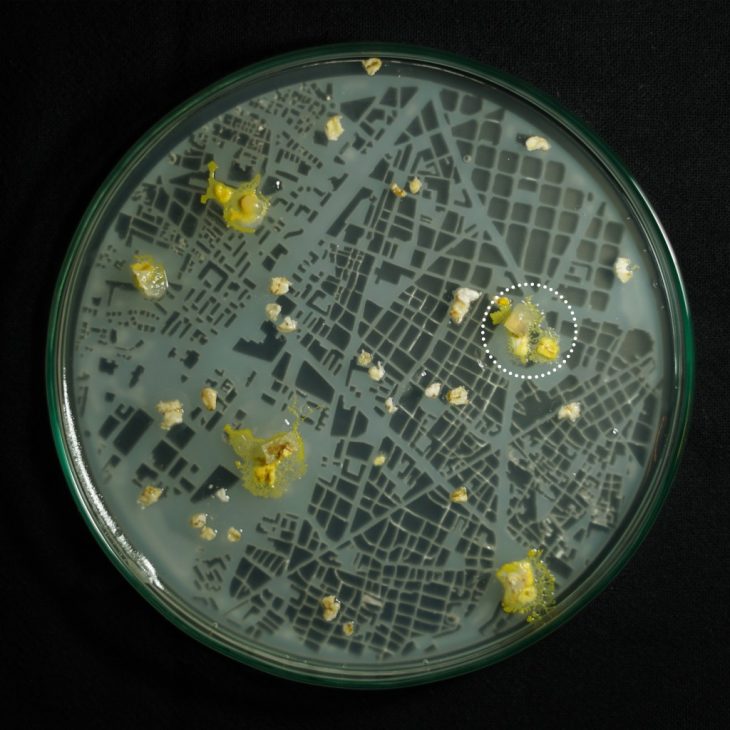
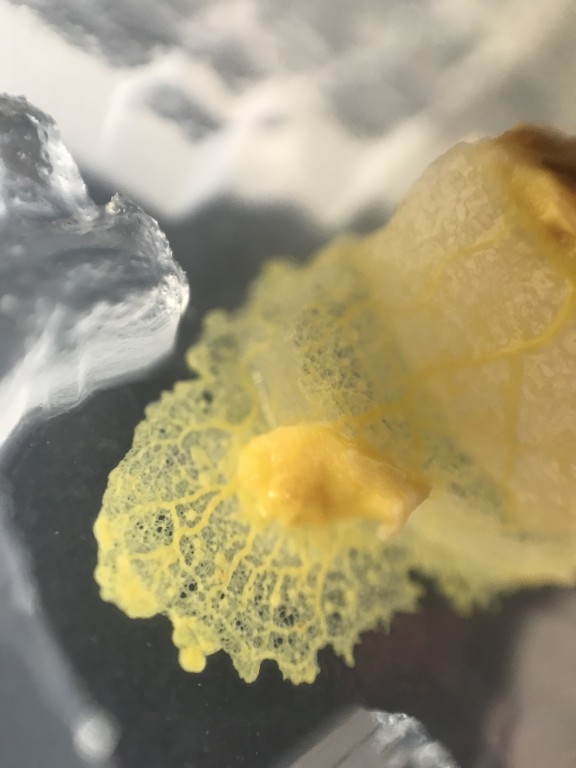
As the biological intelligence, we used slime mold to understand the autonomous manner of this biotic road in the city. We put the foods on a 3d printed map and specified the source points as the reaching points to watch how the mold is growing through there.
WET. WARE BCN is a project of IaaC, Institute for Advanced Architecture of Catalonia developed at Master in Advanced Architecture, in 2018/2019 by:
Students: Hena Micoogullari, Logesh Mahalingam
Faculty: Claudia Pasquero, Marco Poletto
Computational Expert: Konstantinos Alexopoulos
