Barcelona
The urban heat island effect and its consequences is one of the most important problems cities worldwide have to face in an effort to become more sustainable. Barcelona is known to have a Mediterranean climate where there is an intense peak in hot temperature during the months July, August, and September. This spike creates an uncomfortable feeling in its citizens.
On the other hand, the city consumes 1.5 million cubic meters of water in 2019. This huge volume of water then goes back to the far by water treatment facilities to be cleaned and either disposed back to the river. This dependency creates a strain in the centralized water distribution system.
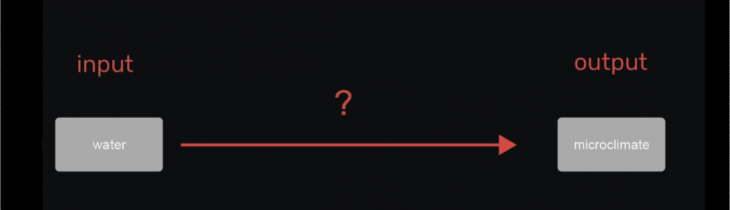
Is there a way to rethink how we can reuse our wastewater? How can we provide a more comfortable microclimate using water as a tool?
Introduction: User Interface

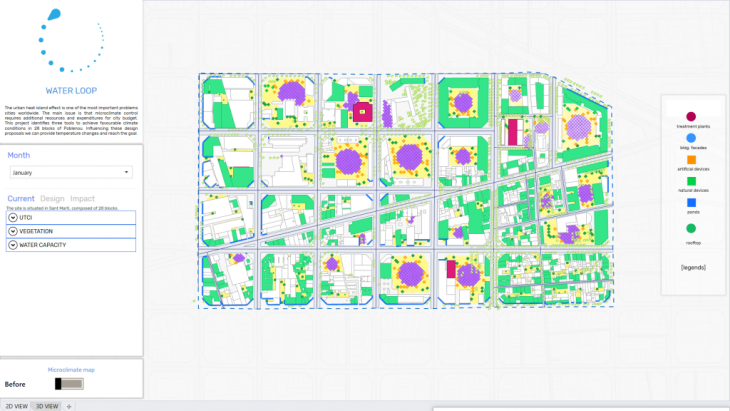
Water Loop simulator is a tool designed for city planners, city council, designers, and even for the public to be able to simulate different potential scenarios in finding balance between water efficiency and improvement of microclimate within the 28 blocks.
The simulation revolves on how different water-based tools together with the identified key performance indicators (KPIs) would affect the microclimatic conditions of the site. Its main objective is to find the best possible proposal that has the lowest temperature drop and highest savings in terms of water demand.

Universal thermal climate index (UTCI) is the main index to be used to measure the proportion between heat stress, no thermal stress, and cold stress areas within the 28 blocks. It takes into account dry bulb temperature, relative humidity, wind speed, and solar radiation, all calculated in Ladybug.
At the same time, water demand and water capacity difference also plays a huge role in the simulation as it may limit or may not limit the intensity of how many tools one have to deploy.
The simulator is then sectioned into three (3) main parts: Current, Design, and Impact.
Methodology
Before moving to the simulation, in order to understand how much greywater we can achieve, the number of population per building is identified. In addition, only residential buildings were included during the calculation as they perform the greater part of consumption.
The formula for calculating water capacity is by multiplying the population to average water consumption per inhabitant per day. Then only 61% of the sum is taken as its the percentage of greywater being produced in each household.
Treated greywater/month = 0.61*(population*av.consumption/day)*30
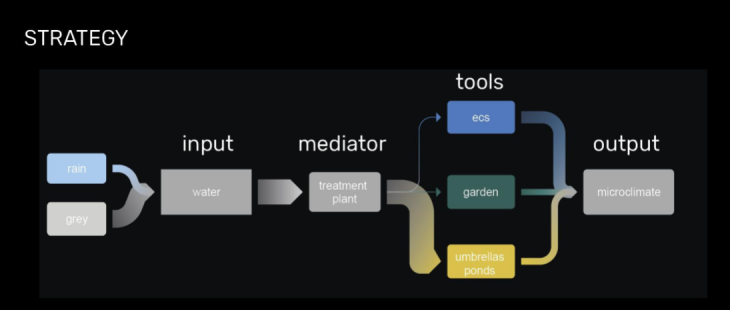
Rain water will also be a part of water gathering. Available rooftops catch rainwater and send it to the treatment plant. Umbrellas and ponds will also catch rainwater and the formula will keep the same.
Rainwater = roof area * precipitation/month
Treatment plants require 1.00m2 per capita. Buildings with the biggest basement area will accommodate treatment plants and serve other buildings. Eight (8) were defined as appropriate.
The design intervention is then subdivided into three levels: 1) Street, 2) Ground, and 3) Roof. Each level has its own set of parameters to adhere to in order to achieve a more effective result at the end.
Street
Streets are those places where we are usually exposed to solar radiation. Moreover, close building location also adds heat to this level. The proposed tool is a building facade that is integrated with an evaporative cooling system. It has the ability to improve thermal comfort on the streets.
In locating in which building surfaces the facades will be attached, hottest areas along the street are first identified. All the building surfaces that are adjacent to these hotspots will be the one where the facades will be placed.
Ground
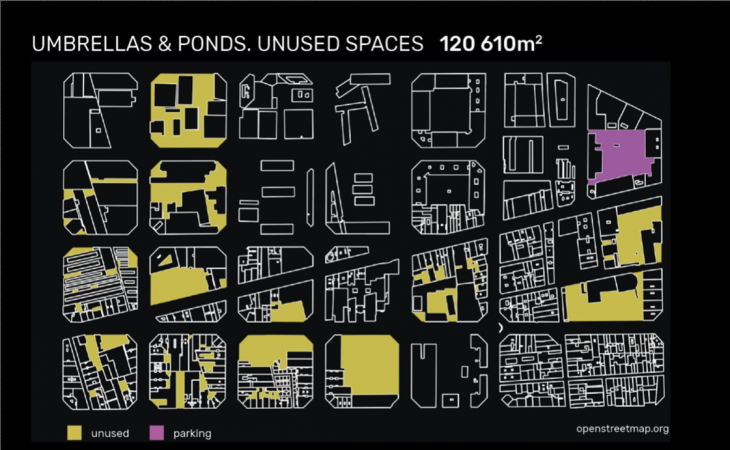
This level is focused on the unbuilt spaces that are present in these 28 blocks. The summarized area of interest is 120,000 m2. All these spaces are then separated into those that are less than 1000m2 and more than 1000m2.
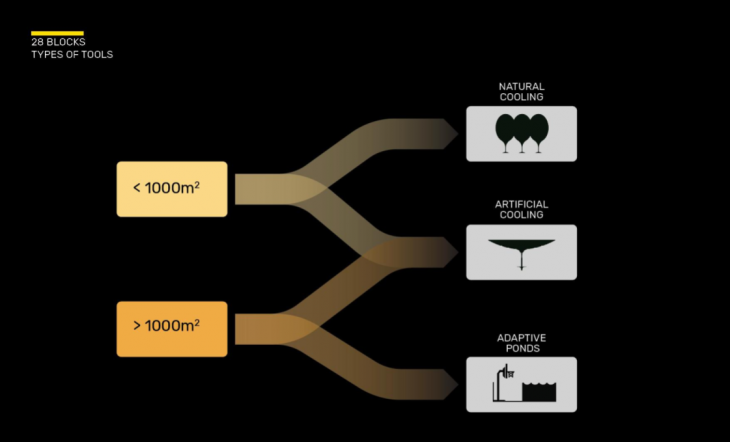
It will have three climatic tools namely inverted umbrellas, trees, and adaptive ponds, that will be deployed proportionally across the unbuilt areas. Combination of umbrellas and ponds are designed to fill areas greater than 1000m2 and umbrellas and trees only for the rest.
First one is adaptive ponds that transform from a flexible public space during sunny days to a retention area during rainy days. These ponds once filled with rainwater creates evaporation that provides the inhabitants nearby with additional cooling effects.
Second tool is inverted umbrellas. They are connected directly to the treatment plants for water supply. In addition, these are equipped with 18 small nozzles on the perimeter. Moreover, these create shaded areas that also contribute to improving the microclimate. One umbrella consumes 273 liters/day.
Lastly, trees are also used as a climatic tool as they offer natural cooling effects to the environment. Amount of green areas in 28 blocks today is 8m2/capita. The goal of Barcelona city council is to increase it by 15m2/capita. Using trees as a design proposal can help to achieve both goals. Moreover, trees do not require water to irrigate and provide shade.
Roof
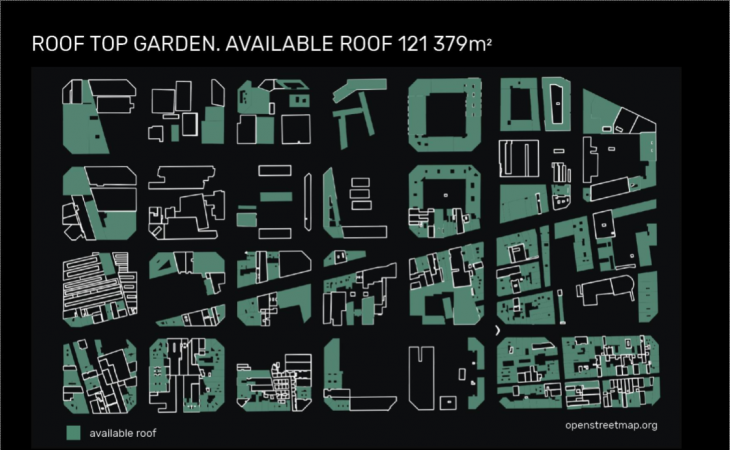
Rooftops are usually unused 80% of the day and the place where condensers and water tanks are placed. The group proposes to transform these ordinary rooftops into gardens where the public can socialize and interact with. Vegetation on the roof protects buildings from extra heat and reduces electricity bills by decreasing operation hours of air conditioners inside.
Availability in terms of occupancy and flat surfaced rooftops are the parameters for the selection. As a result, a total of 121,379m² were acquired to turn into gardens.
Grass will be exposed to solar radiation a lot. These gardens definitely require additional irrigation to keep plants alive and efficient. One square meter of green patch requires 96 liters of water per month for irrigation. If all available roofs will be plated, a total volume of 11,600m³ of treated water.

Each scale of design intervention and its corresponding tools has its own level of effectiveness in terms of temperature drop. According to our research, the ecs building facades have the highest effectivity rate with a decrease of 3.0°C.
Steps: Water Loop UI
Month
The user is given the opportunity to select which month he/she wishes to use as the starting point of the simulation. Each month has its own figures of water consumption and this becomes of the parameters in identifying what will be the best proposal.
Current
Next step is to educate the user basic information about the 28 blocks. It includes the current conditions of the site such as the average UTCI that is taken from the EPW file of Barcelona. In addition, it also displays the current total surface area having vegetation and total water capacity on the selected month which includes greywater and rainwater. It is displayed in a three-fold approach: 1) UTCI, 2) Vegetation, 3) Water Demand/Capacity.
Design
This section allows the user to manipulate the proportion between the three (3) levels of intervention and be able to compare one proposal to another to arrive into its desired result.
Street
The user can slide from 0% to 100% of the selected facades. The predetermined facades are based from nearest building surfaces that are adjacent to the hottest areas along the streets. Each month has its own layout of facades as each month has different temperatures.
Ground
This displays the appearance of artificial and natural devices, and ponds. The user has the opportunity to decide which one he/she prioritizes more, artificial or natural devices. In addition, he/she can also play with the size of the ponds having 60% of the total surface area of the unbuilt space as the maximum percentage.
Roof
Same with the street, the user can slide from 0% to 100% of the selected rooftops. The selected rooftops are made prior by identifying its availability in occupancy and flat surface.
Each set of the adjusted parameters will generate its own result in relation to the water, microclimate, and vegetation data. In addition, a before and after microclimate map is displayed below the in 3d model to better understand the effectiveness of each scenario.
Impact
The final section will be dedicated to display the result of each generated proposal’s own set of modified parameters. It has the same three-fold approach in the ‘Current’ section: 1) UTCI, 2) Vegetation, 3) Water Demand/Capacity. 
With this, the user can start to compare how effective one is from another. At the same time, help him/her in decision-making.
Water Loop: Water to Microclimate Simulator is a project of IAAC, Institute for Advanced Architecture of Catalonia developed at Master in City and Technology, workshop in 2019/2020 by Students: Rashid Gilfanov, Jianne Libunao, Linara Salikhova and Faculty: Alex Mademochoritis, Eugenio Bettuchi, Rodrigo Aguirre, Iacopo Neri