Concept
The concept of this mapping was to show the variations of height occurred during the tracking, creating territorial sections of the tracks.
Methodology
The first phase was based on the collection of data, using the Map plus application for Iphone. Data where exported in .kml file, and sent via email. Data collection was simple and accurate, and I made 5 tracking.
To add more datas, I have downloaded course mate data picked from the folder, in order to have 11 file to use.
Then, I have opened the file on rhino with Barcelona plan in it and the remapping file in grasshopper, to geo-referencing the picture and plane coordinates. In order to have better graphic result, I have changed the base picture with a new one without google earth pitch.
I have used the FILE PATH component to import the 12 file as a list of .kml files, connecting them with the list item component that allows to read each list/file separately, to create a set of point in grasshopper for each track. Entwine instead merge the lists of point toghether keeping each path separate. To simplify the algorithm, I made boxes grouping components. The output is a section, created by translating points according to the Z axis value.
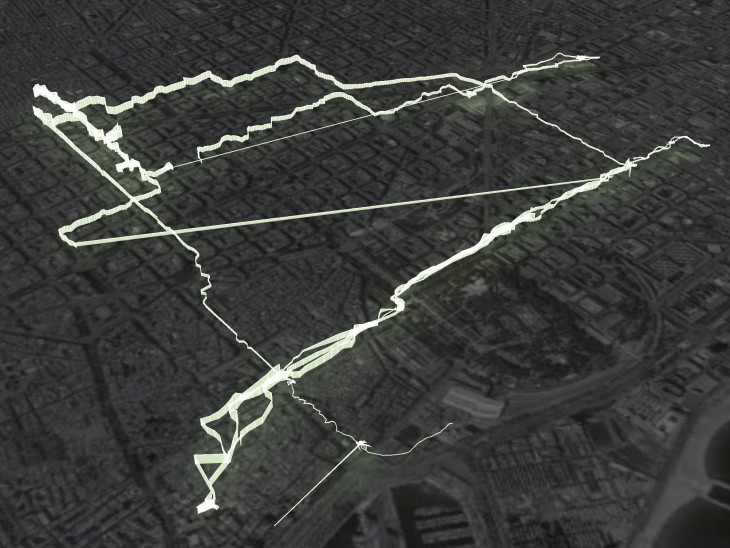
Conclusions
It is interesting how tracking paths can give a feedback on the usage of the city, opening interesting reflections when correlated to other datas.