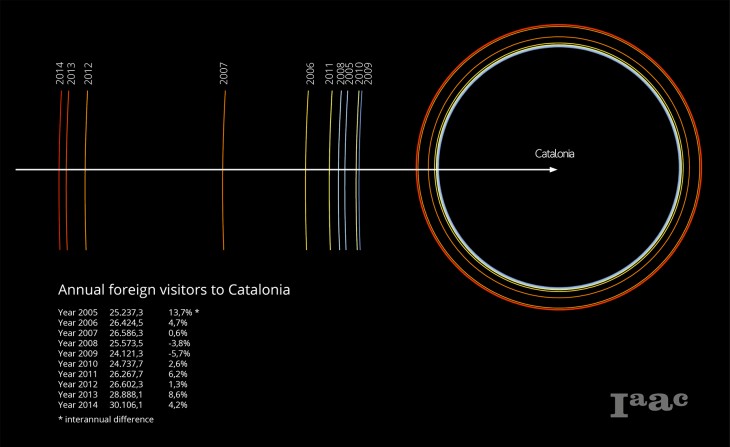
 Catalonia is one of the most visited regions in the world rounding 30 million visitors in 2014. This brief survey offers a visualized portrayal of some of the tendencies in the tourism flow in Catalunya using data from Gencat (Generalitat de Catalunya).
The graph above shows that the annual increment during the last 10 years has not always been positive, though the overall tendency is growth.
In the age of data our developed capabilities as a society to break various phenomena and activities down to data that can be recorded and stored offers a unique opportunity to better understand urban anthropogenic patterns. However, our ability to navigate, make connections and interpret the data to see these patterns still relies heavily on the function of the visual cortex- the part of our brain responsible for processing visual information. In later years, Data Visualization has emerged as a professional field and sometimes even an art form as it deals with the sourcing, contextualization and visualization of large datasets, tailored around the visual cortex’s ability to process information.
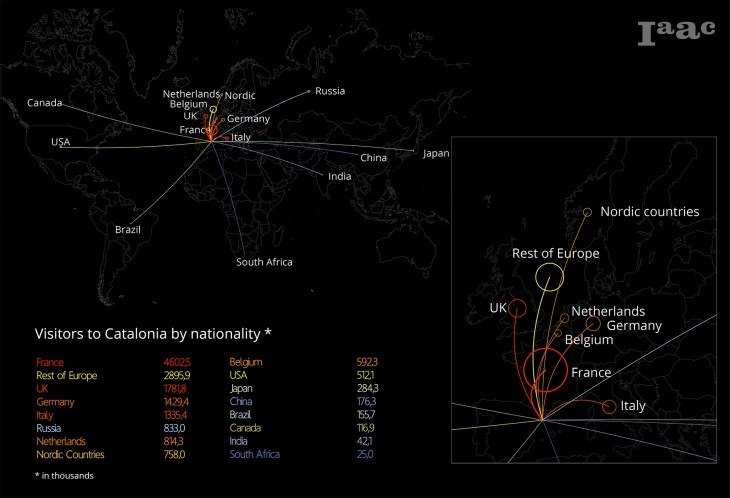 As to which nationalities are the largest visitor groups in Catalunya it is clear that European countries constitue the biggest group, followed by USA, Japan and China.
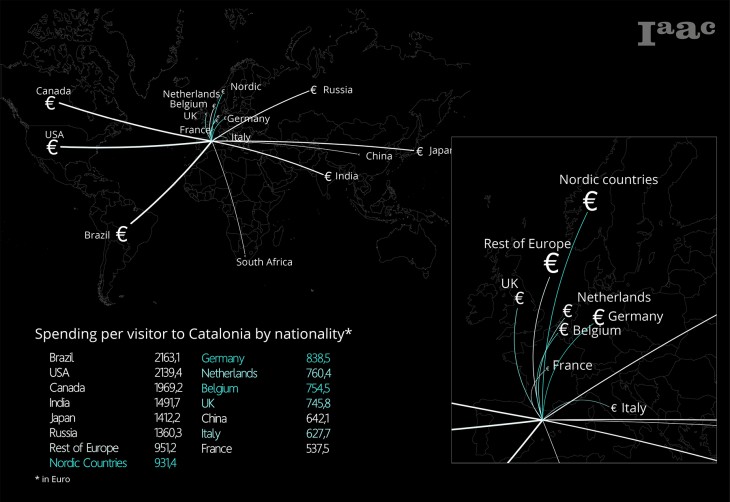 When sorting the data based on each nationality’s spenditure the tendency seems to be that countries located further away from Catalonia prevail. This is because the data provided by Gencat includes transportation costs, including expenses for plane tickets, etc.
Visualizing Data – Tourism in Catalonia is a project of IaaC, Institute for Advanced Architecture of Catalonia
developed at Master in Advanced Architecture in 2015 by:
Students: Peter Geelmuyden Magnus
Faculty: Luis E. Fraguada, Rodrigo Aguirre