VEUS
Veus is an app for participatory design process that uses AR to allow a seamless and constant dialogue between the municipality and the citizens.
Why a new way of participation?
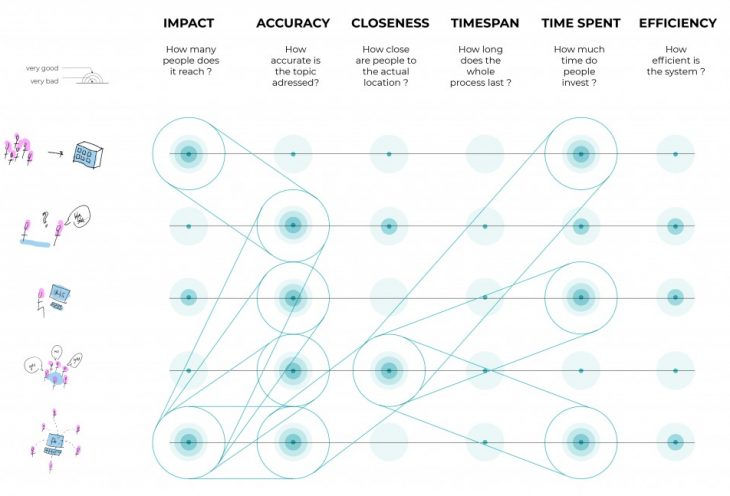
There are several options for citizens to participate in urban decision making: municipal elections, face-to-face surveys, digital platforms developed by municipalities to enable citizens to express their opinion, neighbourhood associations, facebook groups, etc.
By analysing them we discover important features in which some perform better than others; for instance municipal elections and facebook groups do address a high number of people, whereas options like face-to-face surveys and neighbourhood associations take place in the specific area related to the topic being addressed; people can express their opinion very efficiently in terms of time when it comes to municipal digital platforms or facebook groups, but most times it stops there and their thoughts are not fed into the design process.
Therefore, none of the common means of participation perform excellent in all analysed aspects. This highlights the necessity to think of a means that seeks to cover efficiently all qualities inherent in the existing systems.
What is veus?
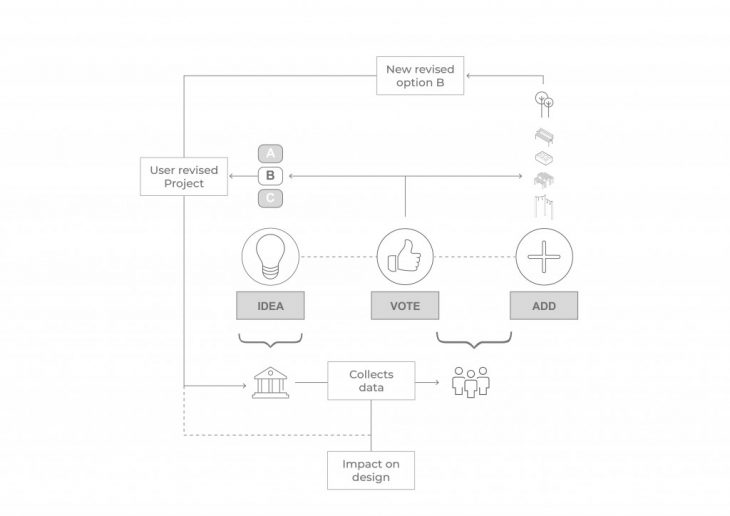
Veus – a catalan word meaning both “(you) see” and “voices” – is an App developed to to enhance participatory processes on urban design. Based on the principle of first seeing and then speaking out your opinion, it enables municipalities to convey ideas or projects for specific areas and gives citizens the opportunity to vote them and to add elements to the design which they think would improve the design of the public space.
How does it work?
First you log in, entering your data about gender, what agegroup you belong and whether you work or live nearby or just pass by; after, there’s three major screens you can acces:
The map, where you can check what projects are available to vote around; a newsfeed site, where you can have an insight about the latest released projects and which shows other information such as it’s popularity (people already having taken part in the participation process); and the voting part. This consists of 3 main steps: info – showcasing 3 different projects for the site -, voting and adding elements to the voted project.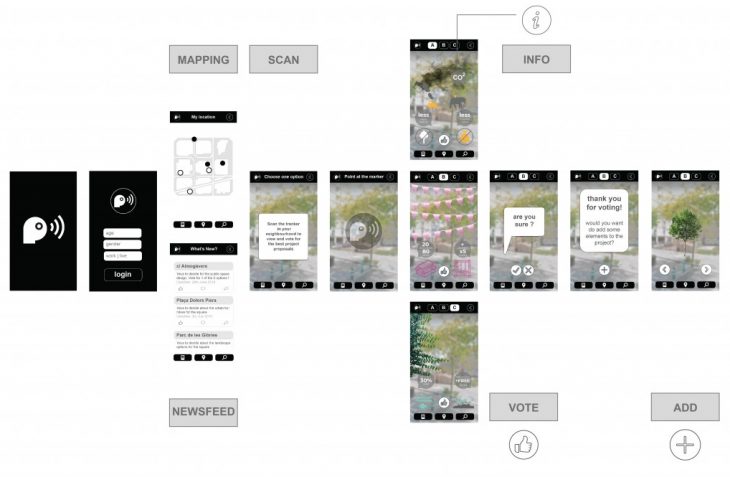
How do citizens use Veus?
Veus is designed to convey citizens information on urban design projects and ask them for opinion and suggestions.
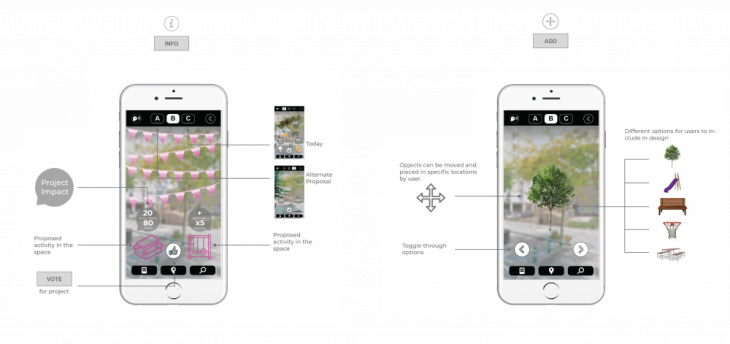
The “info” screen displays the features of the 3 available projects by using animations, icons and sounds to showcase the impact and effect of the proposal. No rendering is shown, since it usually is a very powerful tool in expressing a final image, but it can often be misleading.
The “add” screen offers citizens the possibility to add elements to the project that they have voted for. The catalogue of items consists of generic images displaying elements such as benches, picnic tables, trees, playgrounds, sport areas, trees, urban gardens, etc. Citizens can select them and drag and drop them into a specific place of the area.
How does the municipality use Veus?
The data generated by Veus’ users combined with data owned by the municipality is a very powerful tool for the municipality to understand citizen’s needs and the logics behind them.
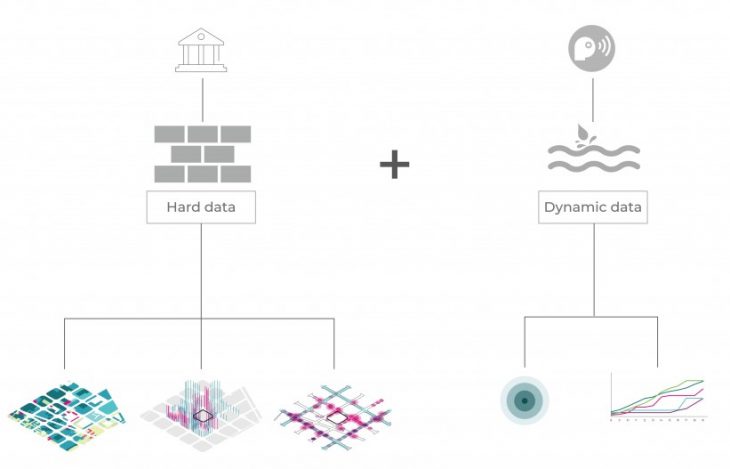
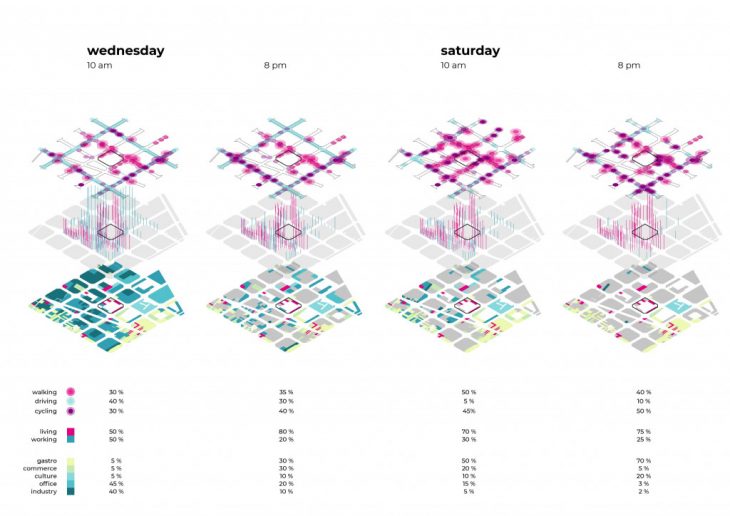
In terms of the neighbourhood scale, taking external data into account, such as ground floor uses, opening hours, main building activity and people’s flows from Strava Maps, municipalities can gain a very accurate insight into the area to understand its physical aspects throughout the time (see example below).
Then of course zooming in into the specific area scale there is the option to analyze the votations in terms of time, which also adds the possibility of exploring other data such as the shadows dropped by the buildings. This can be very useful to understand “demand peaks” for specific elements and to analyze its logic behind: sun-shadow situation, peak office time, break time, lunch time, etc.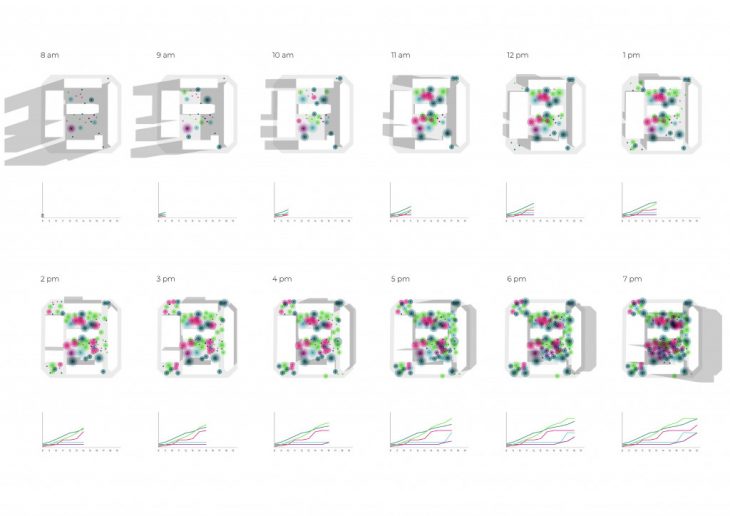
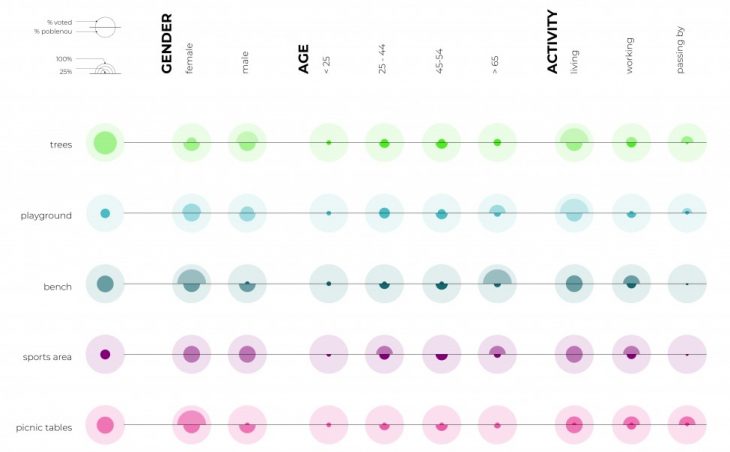
Having a dashboard which displays all the information together can be very effective to understand what decisions can be most representative. The image below shows how to visually combine log-in data on gender, age and activity type (upper part of the circles) with actual data on the neighbourhood (lower part of the circles).
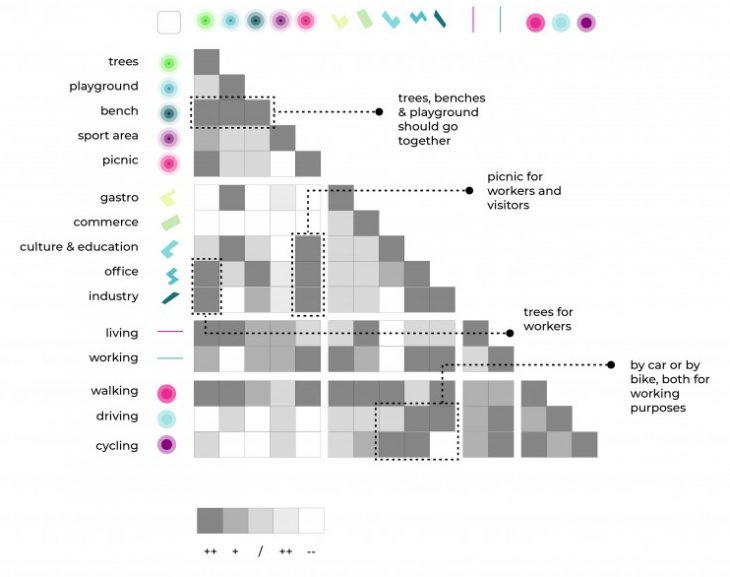
Finally, a correlation enables to see the interaction of different elements with each other or with the other described layers, so that the municipality can base their final decision on a set of conditions described by this way to express the interaction among elements and specific site conditions.
veus is a project of IAAC, Institute for Advanced Architecture of Catalonia, developed at MaCT (Master in City & Technology),
2017-18 by:
Students: Venessa Williams, Alba Alsina
Faculty: Areti Markopoulou, Starsky Lara, Marco Ingrassia
