Vegetative Indices (VI) enable the acquisition of ecological information from satellite and drone data through the analysis of multi- or hyperspectral imagery bands. The reflectance of light changes with chlorophyll content, plant type, sugar content, water content within tissues, and other factors. Due to this fact, the spectral reflectance responses captured by satellite imagery can reflect the interaction and coupling of carbon, nitrogen, and water cycles (Chang et al., 2016; Xue et al., 2017).
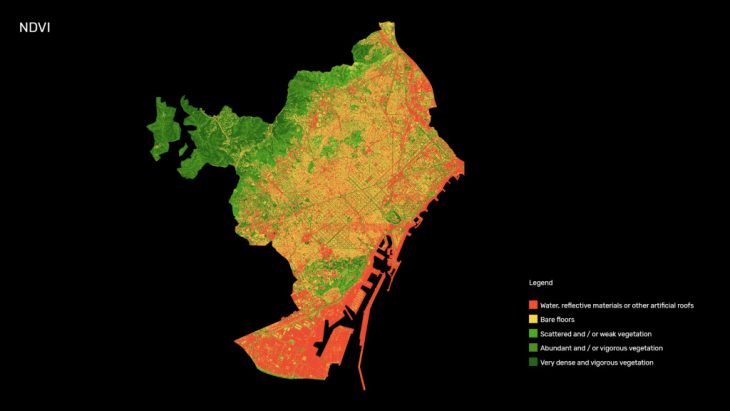
Healthy vegetation absorbs most of the visible light falling on it. Originally developed by NASA, the NDVI index is widely used to analyze the health of plants. NDVI values range between 0 and 1 (due to the normalization procedure). Very low values of NDVI (<0.1) correspond to barren areas of rock, sand, or snow. Freestanding water tend to be in the very low positive to negative values. Soils tend to generate rather small NDVI values (0.1–0.2). Sparse vegetation such as shrubs and grasslands may result in moderate NDVI values (0.2–0.5).
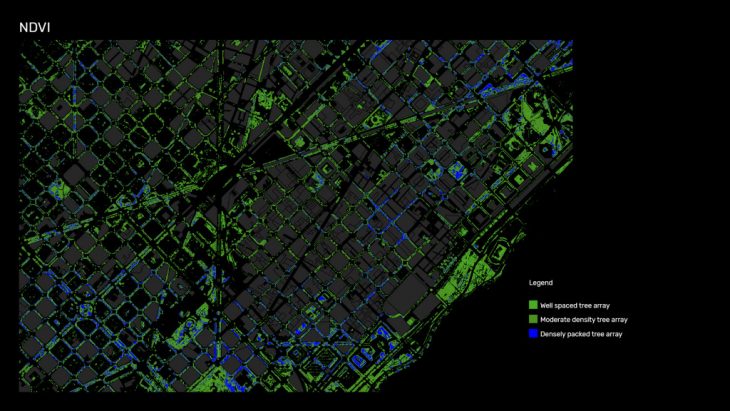
In our project, we use the Normalized Difference Vegetation Index (NDVI) to approximate the tree density in the city of Barcelona. By using raster analysis over the generated NDVI image we are able to categorize the vegetation zones in three distinct densities.
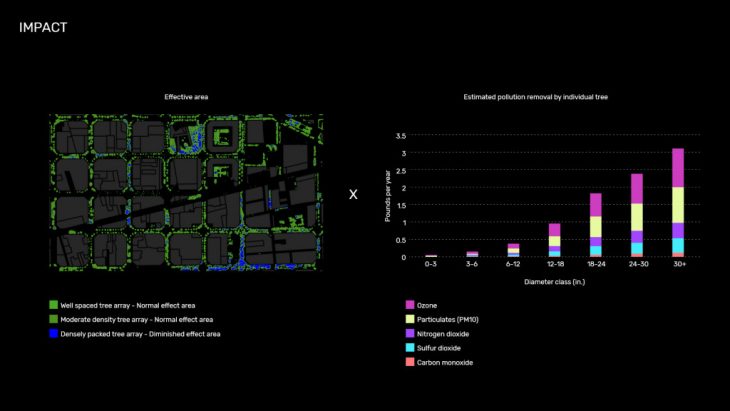
The evaluated areas of the respective vegetation densities are multiplied with the estimated pollution removal capacities to estimate the total pollution removal capacity of vegetation in a given area.
Credits
Using NDVI to analyze air pollution absorption is a project of IaaC, Institute for Advanced Architecture of Catalonia
developed at Master in City & Technology in (2019/2020) by:
Students: Elijah Munn, Kushal Saraiya
Faculties: Diego Pajarito