Abstract
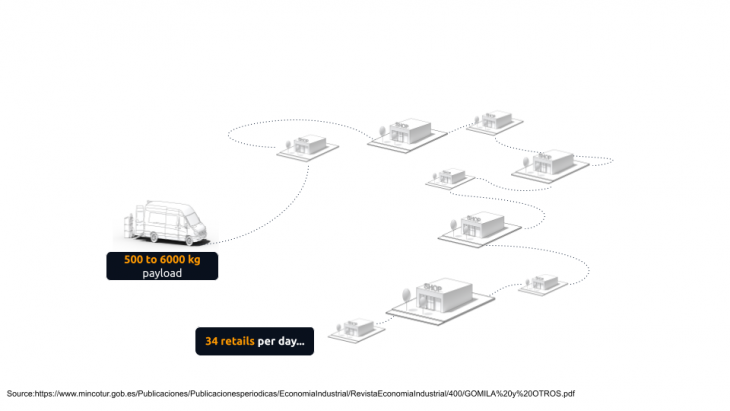
This project is focusing on Urban Goods Distribution with a new methodology to appropriate the most efficient usage of spaces and introduce micro platforms and on-Demand warehouses to utilize the highest potential of space, warehouses, and retails. We started from the number of packages taken from warehouses to 34 retail per day.
Introduction
This project is part of a large process of investigation about the Urban goods distribution system in Barcelona, where the aim was to design a new service that bridges between retailers and eCommerce. In short, we gathered information on e-Commerce warehouses and made a comprehensive analysis on how goods moved to the city center, the pickup points around the 3 areas, retail type, and density in superblocks, and land use of warehouses surrounding areas to make decisions on how we could appropriate a strategy.
The project has been done in 4 different phases:
- Data Gathering
- Data Analytics
- Cleaning unwanted data and Filtering
- Visualization of the data on the purpose of the project
Data Gathering
In this phase, we not only rely on a single source but multiple, some are coming from inAtlas company like footfall data (Device GPS of moving people), others from rent and commercial real estate has been scrapped from the different websites..(logistic centers in Barcelona) As of warehouses of an e-Commerce system we applied isochrone for the device in 5 minutes to the warehouse. We trace the path of the trucks delivering goods which traveling to Barcelona, getting the results we cleaned the redundant data eventually we got the result of 60 logistic centers
Data Analytics
In the Data analytics phase, we explored millions of rows of data, to see the potential and capabilities, which we face endless possibilities. The data contain GeoJSON, JSON, CSV, and GeoSpatial GIS data, With footfall data, we extracted device AID and sorted them based on the Timestamp that has been converted to DateTime format.
Cleaning and Filtering
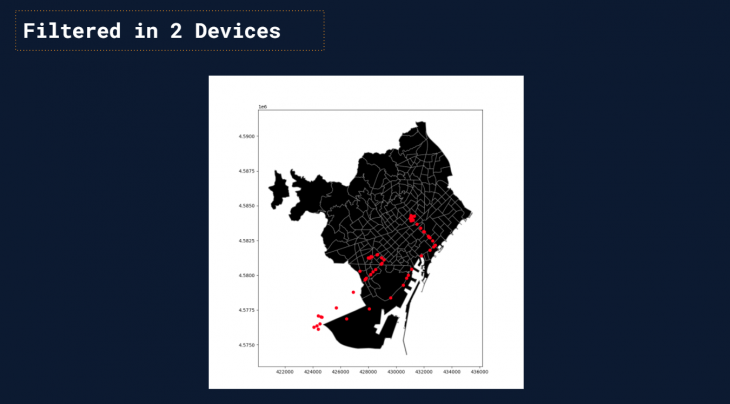
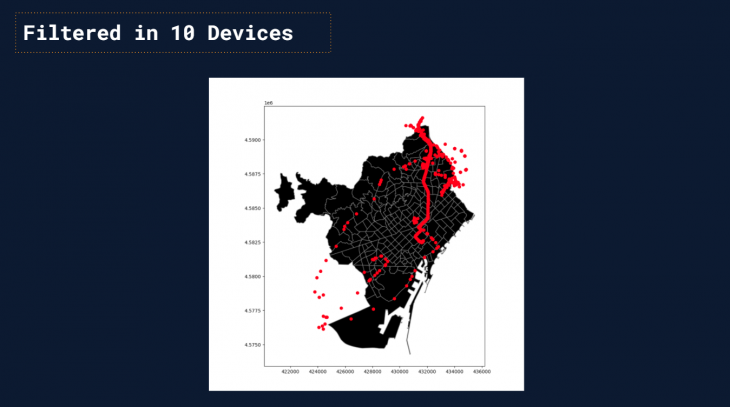
One of the most important parts was cleaning unwanted data, which in this phase, based on the Geolocation of the big eCommerce warehouse around the Eixample and the whole Barcelona, and the device around those warehouses, we applied Geo Filtering, then we clean the whole GPS (Footfall) dataset only for the information we needed, and therefore we had a very low weight dataset for processing, based on that we had many routes visible on maps from the warehouse to the city center out of GPS checkpoints. In general, we first visualized the logistics centers on GIS and the footfall data with the assumption that from isochrone’s 5 min walk we could find the courier devices then clipping points inside. Then export the data from GIS. Since there were still multiple rows and many locations, we first filtered only 2 devices than with the visible routes, we made 10 AIDs of the different devices that exactly showed what we needed the routes from the 10 people moving from warehouses to the city center which showed the good distributors.
STEPS:
- Filtering footfall dataset based on aid device inside the 5 min walk
- Datetime conversion (from timestamp to date)
- Filtering of the data set based on 10 aid
- Use the whole dataset for Kepler and the final plot
Data visualization
The data visualization phase happen multiple times during the data analytics process to experience what we have at our dataset visually, Multiple visualization techniques were used: Charts and Diagrams: Scatter plot, Histograms, Pie charts, and donut charts, and sometimes two stacked together
GeoSpatial: one of the analyses we made was different states and their sizes on Geospatial data done with Python and GeoPandas, for the main map we stacked to axes on one map which was the point and the base map of the city, and finally for the embellishment of better visualization we used Mapbox enabled tool Kepler which helped us see all of the routes in 1 day every two even hours of the day out of our clean dataset, which then has been stacked with graphs and gave us desired results of moving distributors from warehouses to the city center.
First the registered retail analysis
In this part, we analyzed different retails, their categories in a different part of superblocks
And analyzed the land use types in the site then the analysis of land use types in 3 different Pickup points. Then the analysis of GPS and AID of devices in Barcelona
We stacked with Barcelona focused, This shows many devices and so dense, Thus we made filter only for two devices:
 The with 10 Devices:
 Then we animate those 10 devices to track the movement according to time
 Then we made an analysis of the density of devices at different hours of a day. And finally animate density movement on the city and city centers
Data source: inAtlas, Fotocasa, GoogleMaps
Urban Goods Distribution is a project of IAAC, Institute for Advanced Architecture of Catalonia developed at Master in City & Technology in 2020/21 by students: Sasan Bahrami, Simone Grasso, Kevin Aragon, Juan Pablo Pintado Miranda, and faculty: Diego Pajarito.