
+ ABSTRACT
To best accommodate rapid urbanization while making cities more sustainable, livable, and equitable, designers must utilize quantitative tools to make informed decisions about their designs. Computational workflows have proven to be a successful approach to deal with the building scale, but are challenging to apply at the urban scale due to increase computational expense. Our research is focused on testing and developing a new approach using machine learning to learn and predict complex operations. This new workflow can save on computing time by 10x and open new possibilities within the urban design field.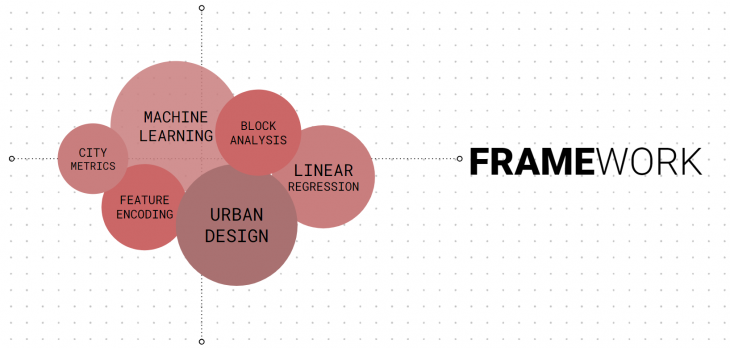
+ CONCEPT
Based on this challenge, we wanted to develop a process capable of overcoming the current constraints that the traditional and computational process presents when dealing with an urban scale. Also, we want it to find a way to capture and harness the cumulative learnings that the process creates instead of just having a prototype as the final output. This is why we decided to explore different machine learning processes to perhaps replace or enhance existing computational methods to improved the design and simulation process.
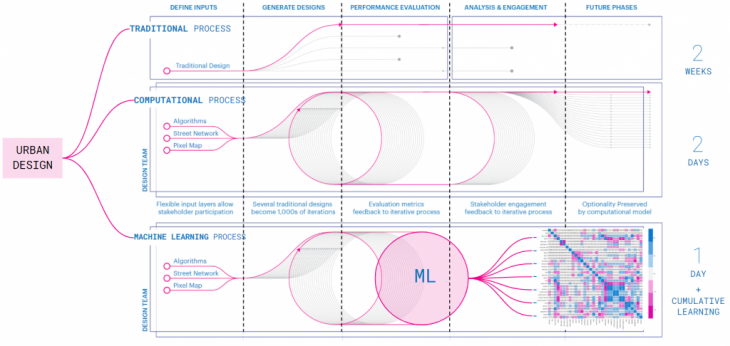
+ Original diagram from KPF Research paper at SimAUD 2019: “How to generate a thousand master plans”
+ METHODOLOGY
We followed the methodology below to defined, analyses, and create an accurate machine learning model that can later be incorporated into a user-friendly app that can be used in real-time natively on grasshopper.
A | METRICS DEFINITION
As a first step, we defined and conceptualize all the different metrics and variables we want to use on our project. For this, we created a pseudo-code where we specify the input parameters that the definition is going to use. Then the defined the parameter space, which are the metrics that the algorithm is going to calculate. And finally, the output parameters, which are the final metrics on which we are going to evaluate the proposals and use machine learning to predict.
B | GEOMETRY GENERATION
Once the metrics have been defined, we then proceed to develop a Grasshopper script that allows us to generate diverse urban blocks using the inputs parameters defined above. For this, we make use of the parcel generator from Decoding Spaces among other custom nodes to create the urban block. After that, we then connected the script with Wallacei, a genetic optimization algorithm, to find the 2 best and worst-performing genes across the pool of 5000 individuals. We did this to identify the 4 options that are the most further apart so we can then used them as inputs for the Kohonen map.
C | SOM + KOHONEN MAPS
After we created 4 different urban block samples, we used them as input seeds for the Kohonen map to generate 3150 options on a 45 by 70 grid structure. We can see below the result of such an operation. On the left, we have the SOM distribution and on the right the final urban blocks. We then proceed to extract the data and parameters of all the options onto a single CSV file that we are going to use as a database for the machine learning process.


D | PCA + MACHINE LEARNING
As a next step, we need it to analyze our new dataset and understand how correlated our columns where we the features we want the machine learning algorithm to predict. For this, we run an extensive PCA analysis onto our dataset using the methodology described below. As a result of this process, we managed to understand and select the right columns and PCs that are relevant to our features.
PCA ANALYSIS // PAIRPLOT: Plotting the dataset onto two-dimensional plots to understand the pairwise bivariate distribution.
PCA ANALYSIS // CORRELATION HEATMAP: We use the Pearson correlation coefficient to understand the attributes that are linearly related to the features we want to predict: Radiation, Green Comfort and Energy Balance.
PCA ANALYSIS // VARIANCE LINE PLOT: We plot the Eigenvalues on a scree plot so we can visualize the amount of variation each PC covers.
PCA ANALYSIS // PRINCIPAL COMPONENTS: We use a biplot to overlay both the score plot and a loading plot to visualize the PCs that account for most of the variance on our data. 
PCA ANALYSIS // PC HEATMAP: As the last step, we plotted the PC’s onto a correlation heatmap so we can pinpoint the final PC’s that we are using for our ML model.
MACHINE LEARNING // MODEL SELECTION: Once we analyzed and understood our data and features with the PCA analysis, we then need it to decide which machine learning model was best for our needs. Based on the nature of our dataset and the type of features we want to predict, we decided to use a linear regression model that will allow us to learn and predict large quantities of labeled data using a supervised approach.

+ Linear Regression model predicting a single feature: Radiation

+ Linear Regression model predicting a single feature: Energy Balance
MACHINE LEARNING // SINGLE PREDICTION: As an initial test, we wanted to train the model to learn and predict a single feature at a time. We started with multiple layers and a really dense architecture, and after several trials, we then realize that we need it to simplify the layers as well as the number of neurons. Our final configuration is the one below, where we created a 5 layer architecture with a small number of neurons per layer and use relu and linear as the activation models. This final configuration shows us really good results and the model was learning and predicting with a Validation loss of 0.0057.

+ Linear Regression model predicting multiple features
MACHINE LEARNING // MULTI PREDICTION: Once we understood the right architecture and hyperparameters for our model, we then proceed to run a multi-prediction using the three selected features: Radiation, Green Comfort and Energy Balance. As we can see on the plots below, the model train and predict quite well, but without the high efficiency, we had on the single prediction test. Our final validation loss was 0.0981.
E | URBAN APP

+ Testing the pre-trained model locally using VS and Hops
We took the pre-trained model and save it locally onto our Visual Studio environment. This then allowed us to connect the model live with Grasshopper using Hops where we could have a live and real-time prediction instead of having to wait 1.5 minutes per iteration.

+ URBANAI: Introduction to the tool

+ URBANAI: User interface
URBAN APP // PACKAGE: Once we test that the model was working well locally on grasshopper, we then decided to package it onto a user-friendly app call “URBAN BLOCK”. The app was created using the Human UI plugin and it allows the user to navigate through the multiple dimensions and scorings.
+ SURROGATE MODEL
The problem was solved and the process has proven to be successful to imitate and replace time-consuming computational processes for more flexible and faster machine learning models. So now, the next question for us was to test the limits of this new process and see how flexible can it be when we start using it to predict a more diverse set of urban blocks that it has never seen before. The new question is now how can we create a more open-source model where the people can use it to predict in real-time the Sun hours, Green Comfort, and Energy consumption of existing urban blocks extracted directly from open street map.
The first test was using an existing urban block from Rua Ferreira Lapa, in the city of Lisbon. We chose this particular block because it has a similar shape, size, and building distribution as the synthetic dataset we used to train the model. As we can see, the prediction was acceptable for the Radiation and Green Comfort values but extremely low for the Energy Balance one.
For the second test, we tried with an urban block that has smaller and denser parcels with more irregular footprints. As we can see from the results, we had an average performance on the first two metrics but the model failed to predict the Green comfort due to the irregularity of the building footprint.
+ CONCLUSION
As a final conclusion of our research, we have realized that the use of a machine learning model in complex design and architectural workflows can not just fast-track the computational times but also open the door to new and broader opportunities that can disrupt the way we do architecture. We realize that is possible to train a regression model using synthetic data to later use it as a surrogate model to predict results on existing blocks. However, to make this process more accurate and ready to be implemented on real projects, the dataset needs to be refined based on existing urban blocks in order to provide a more accurate representation for the trained model.
+ GITHUB REPOSITORY: LINK
+ PROJECT PRESENTATION: LINK
+ PROJECT VIDEO: LINK
+ CREDITS
UrbanAIis a project of IAAC, Institute for Advanced Architecture of Catalonia developed in the Master in Advanced Computation for Architecture & Design in 2020/21 by Joao Silva and German Otto Bodenbender. Faculty: Gabriella Rossi and Illiana Papadopoulou